Presented at Manitoba Mining and Minerals Convention, Hudbay Lalor Symposium, November 2014
For a PDF of this paper click here
Summary
In late March, 2007, soon after the drill discovery of the Lalor VMS deposit, Hudson Bay Exploration contracted Geotech to fly VTEM time-domain EM surveys over the region west of Snow Lake, Manitoba. The deposit escaped detection due to its large depth of burial (>550m) and the lack of magnetic response. In 2009 Geotech carried out a ZTEM test survey over the Lalor deposit, which was successful and led to a larger survey over the area. In 2012 a second VTEM survey test was flown, using the more deeply penetrating VTEMMAX system. The mine-site development appears to overprint the deeper deposit response. However a deep conductive anomaly above South Bull’s Eye, south of Lalor, is well resolved in the two later EM surveys.
Key words: Airborne, ZTEM, VTEM, electromagnetics, magnetics, 2D-3D inversion, Lalor, VMS.
Introduction
In March, 2007, the Lalor Deposit polymetallic zinc-copper-gold-silver-lead volcanogenic massive sulphide, approximately 3km northwest of Chisel North mine near Snow Lake Manitoba (Fig. 1), was discovered by drill testing a Crone fixed-loop time-domain electromagnetic (DPEM) anomaly from 2003 (Fig. 2). The Lalor drillhole intersected high grade zinc mineralization at a depth of approximately 800 m below surface and would eventually lead to the 14.4 Mt Lalor deposit (Gilmore et al., 2010).
Soon after, in late March, 2007, Hudbay Minerals contracted Geotech Ltd. to carry out a large helicopter time-domain EM survey of the Snow Lake region using its newest VTEM (Witherly et al., 2004) B-field and dB/dt system. Unfortunately the deposit was not detected due to its large depth of burial (>550m) that fell below the ~400m depth of investigation limits imposed by the S/N of the VTEM system at that time.
In November, 2009, Geotech carried out a test of its new ZTEM (Lo and Zang, 2008) passive helicopter-EM system, with the objective to test its ability to map the deeply buried Lalor VMS deposit that had escaped detection in previous airborne geophysical surveys. Initial survey results, complemented by 2d inversions, confirmed the deposit location and vertical extent, and becoming the first AEM survey to successfully detect Lalor. The survey was subsequently extended across the Lalor Lake-Chisel Lake-Snow Lake region.
In November, 2012, a second VEM survey test was flown, using the VTEMMAX large-loop/large dipole moment system. With the Lalor mine-site development well underway, the deposit area was masked by powerline noise and metallic culture. However, the survey resolved another deeply buried, mineralized but subeconomic stringer-sulphide body southeast of Lalor that was also defined in previous large loop TDEM survey (see South Bull’s Eye anomaly in Fig. 2).
This paper presents the results of these three airborne EM surveys and compares them with the known Lalor VMS and surrounding deposit region.
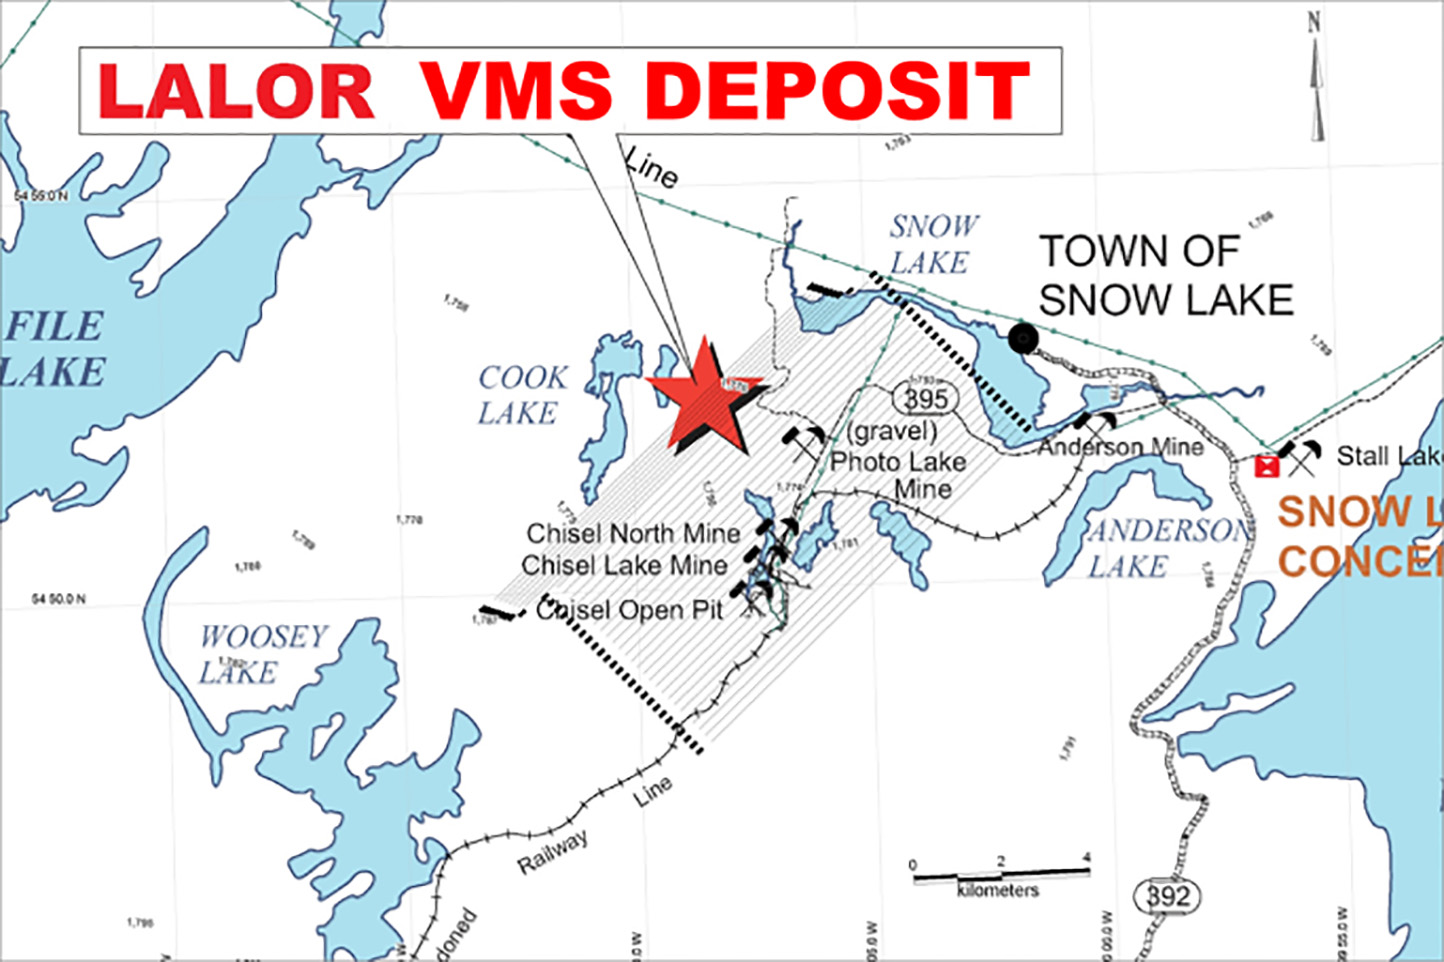
Figure 1: General location of Lalor VMS deposit and 2009 ZTEM survey flight lines, in Snow Lake district (modified after Blakley, 2008).
Deposit Geology and Mineralization
The Lalor deposit is situated in the Flin Flon Greenstone Belt and is a classic volcanogenic massive sulphide (VMS) deposit similar to other massive sulphide bodies in the Chisel sequence (Chisel Lake (C), Ghost-Lost Lake (G-L), Chisel North (CN), and Photo Lake (P) – see Fig. 3). The Chisel sequence that hosts them contains thin and discontinuous volcaniclastic horizons and intermediate to felsic complexes. Lalor ((L) – see Fig. 3) lies along the same stratigraphic horizon as these other ore bodies and its top is interpreted to lie below a decollement (fault) contact with overturned hanging wall rocks at the surface. The Chisel Lake pluton is a nearby (Fig. 3) late 1.8km x 9.8km layered ultramafic intrusion that truncates the Chisel Lake VMS deposit. Footwall rocks have been extensively hydrothermally altered and metamorphosed to chlorite, sericite and cordierite-anthophylite schist and gneiss (Carter et al., 2012).
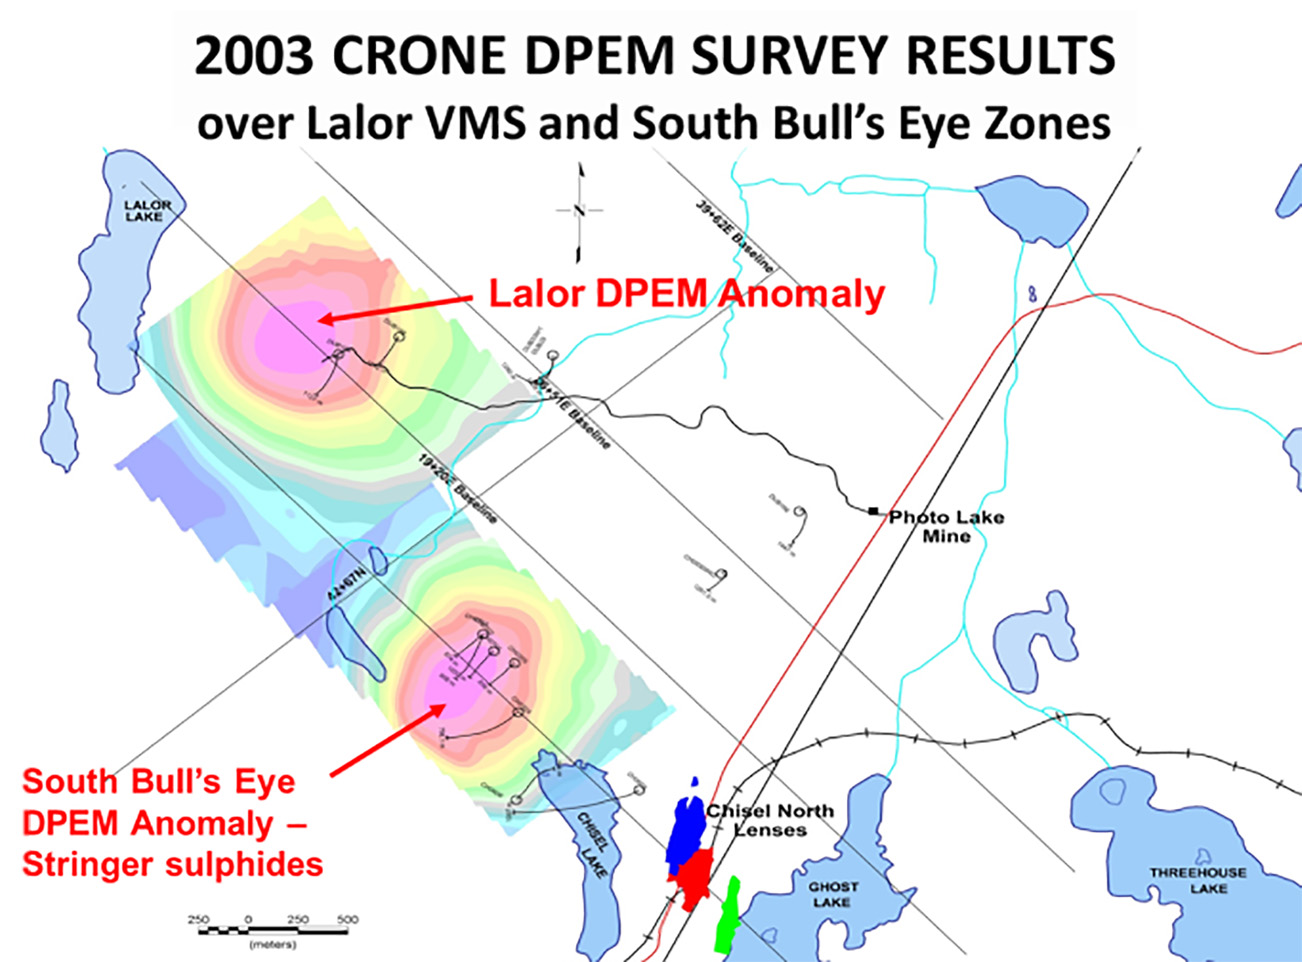
Figure 2: Crone fixed loop time-domain EM (DPEM) survey results from 2003, showing Lalor & South Bull’s Eye DPEM anomalies (after Gilmore, 2010).
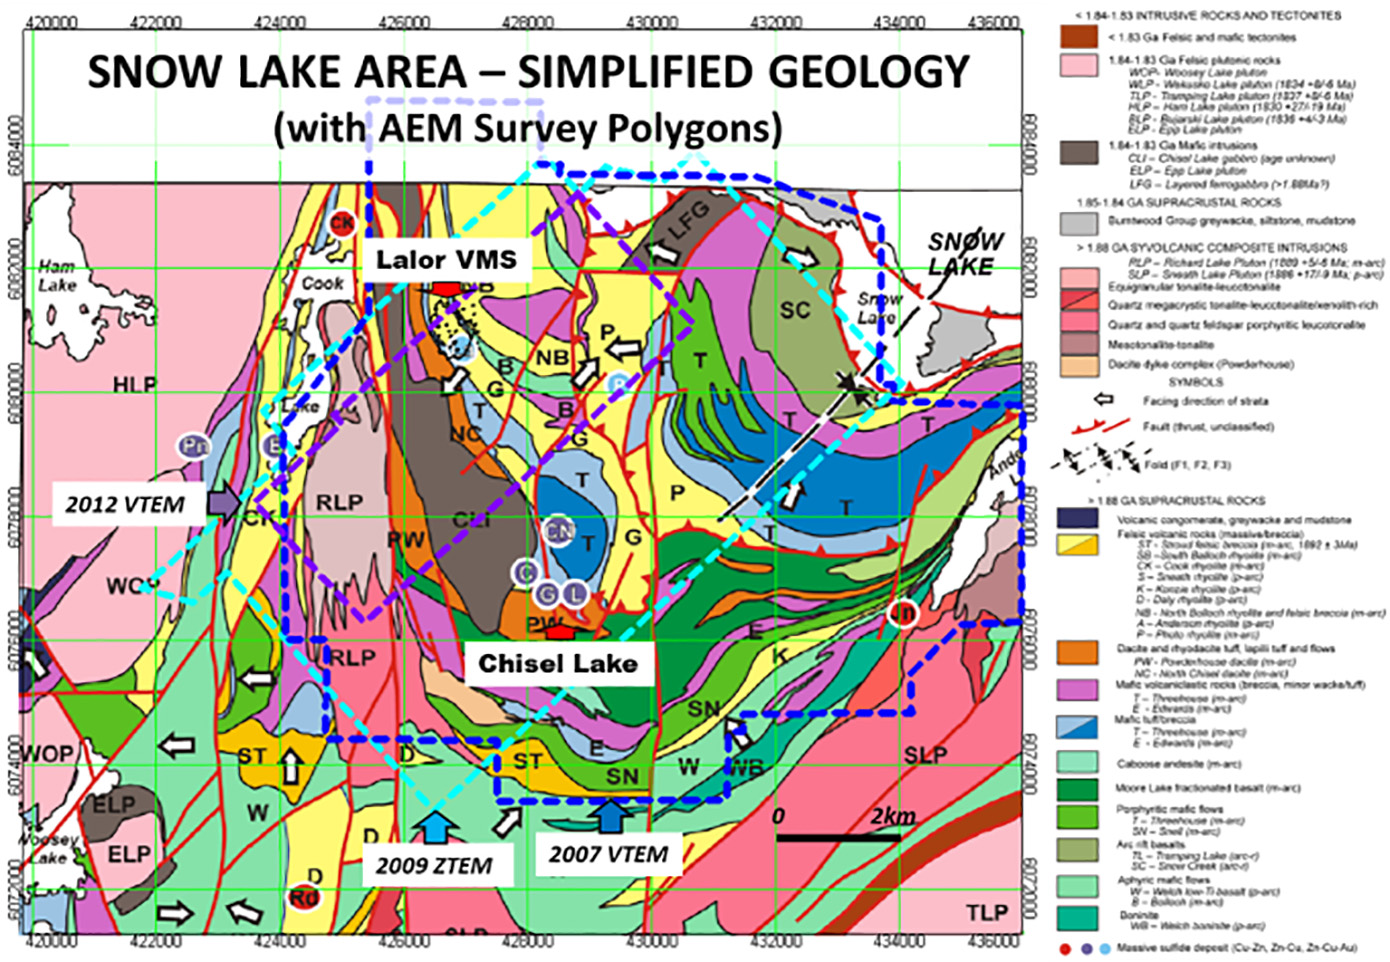
Figure 3: Snow Lake simplified geology map and legend, showing AEM survey polygons (cyan-blue-violet hatched polygons) and highlighting Lalor and Chisel Lake deposit regions (modified after Bailes et al., 2013).
The Lalor Deposit mineralization occurs as massive to disseminated sulphides consisting of mainly of sphalerite, pyrite and chalcopyrite, with lesser galena and arsenopyrite, as well as occasional massive pyrrhotite. Rock units in the hanging wall include mafic and felsic volcanic rocks that have been overturned and are in unconformable possibly fault contact with the footwall rocks. The mineralization is immediately underlain by a thick zone of intense metamorphosed, hydrothermally altered rocks (Carter et al., 2012).
The deposit’s mineral reserves are 14.43M tonnes at 1.86 g/t Au, 23.55 g/t Ag, 0.60% Cu and 6.95% Zn. The deposit has a lateral extent of about 900 metres in the north-south direction, and 700 metres in the east-west direction (Fig. 4a), and it dips shallowly to the northeast. The deposit is geologically interpreted as six stacked massive sulphide base-metal lenses extending from 550-1200m (Fig. 4b) and also six separate, disseminated mineralized gold zones extending from 750-1500m (Carter et al., 2012).
AEM and Magnetic Surveys
The 2007 VTEM (VTEM2007) survey comprised 1743 line-km (104 km2) over the Lalor deposit region (see Fig. 3 & 7a) and was flown at a nominal spacing of 100-200m along NS and EW lines. The VTEM2007 system measured 24 off-time channels of vertical dB/dt and calculated B-field (120-6578us) data after a 7.2ms wide trapezoidal waveform pulse at a repetition rate of 30Hz and 390k-410k NIA dipole-moments from a 26m x 4 turn transmitter loop. The EM and caesium magnetic sensors were flown at 35m and 60m avg. terrain clearances, respectively.
The 2009 ZTEM survey consisted of a total of 372 km, flown at a nominal line-spacing of 100-200m, over a 66 km2 area (see Fig. 3 & 9). The ZTEM vertical axis HZ receiver coil (7.4m dia.) and caesium magnetometer were flown at an avg. sensor height of 88m and 105m, respectively. Two orthogonal (HX-HY) horizontal axis coils (3.5m dia.) measured the horizontal EM reference fields. Data from the three coils were used to obtain the Tzx (In-line) and Tzy (cross-line) AFMAG tipper vector transfer functions (In-phase and Quadrature) at five frequencies in the 30 to 360 Hz band.
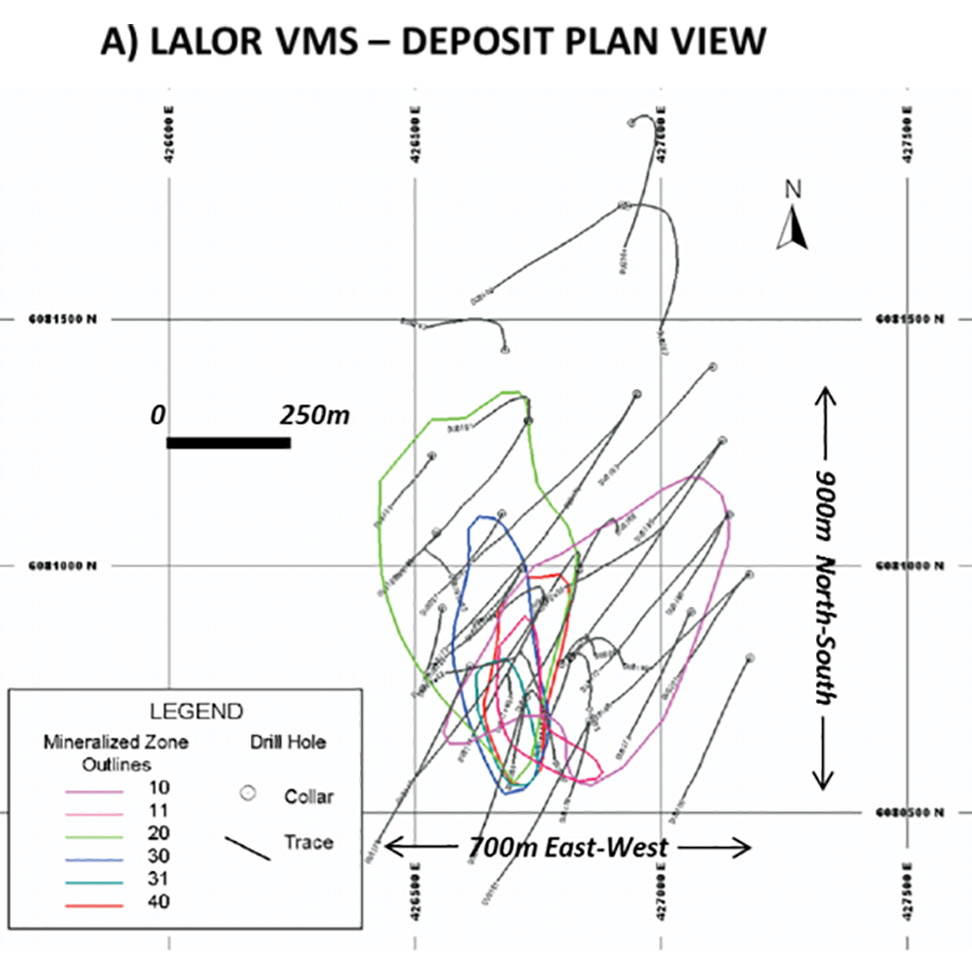
Figure 4: Lalor VMS deposit shown in: A) Plan view
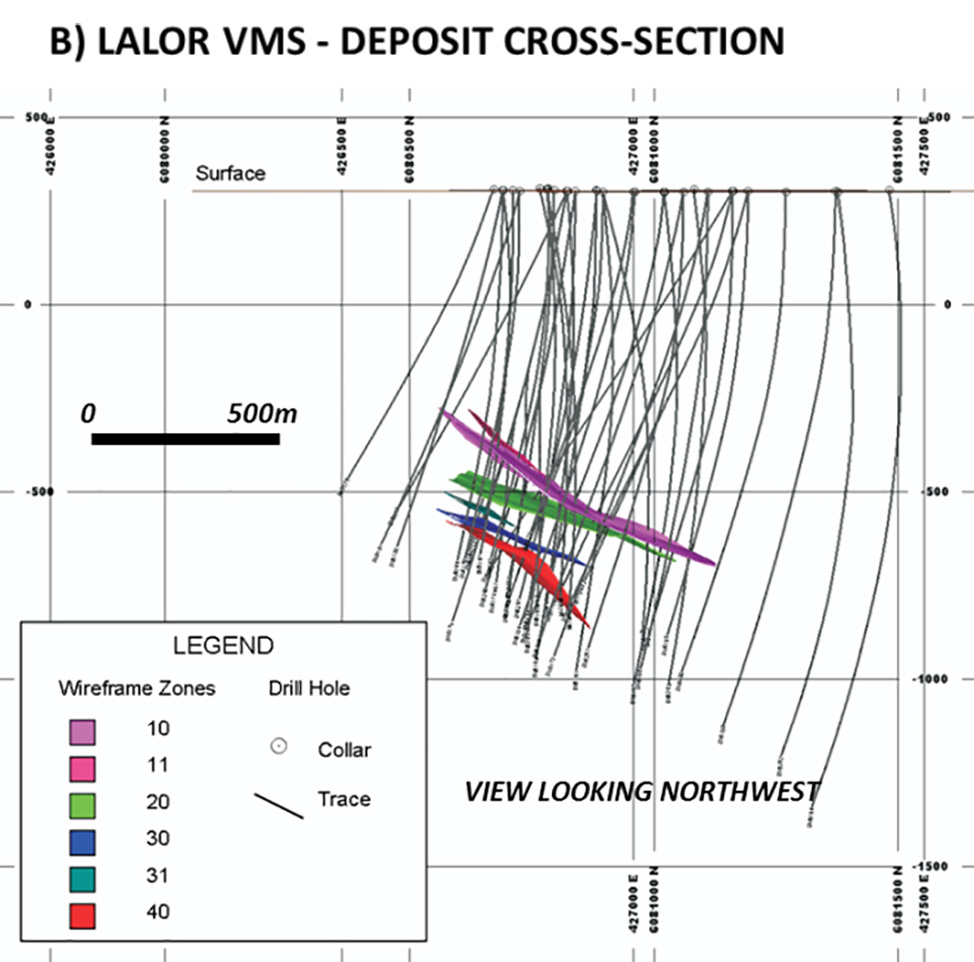
Figure 4: B) cross-section, showing drillholes and zinc-rich orebody outlines (after Blakley, 2008).
The 2012 VTEMMAX test survey, totaling 112.5 line-km (20 km2), was flown along 100-200m spaced NE-SW flight-lines that roughly coincided with the ZTEM coverage and extended southeast from the Lalor deposit (see Fig. 3 & 7b). The VTEM system measured x- and z-components of dB/dt and B-field (83-9286us) from a 5.8msec wide trapezoidal waveform at 30Hz and 1.4M NIA dipole-moments from a 35m x 4 turn transmitter loop. The EM and caesium magnetic sensors were flown at avg. bird heights of 43 m and 60m, respectively.
Magnetic Survey Results
Figure 5 presents the total magnetic intensity (TMI) results over the Lalor deposit area, from the ZTEM airborne survey. Strong (>500nT) magnetic highs identify the synvolcanic Richard Lake intrusive complex (RLIC) and the Chisel Lake gabbro (CLG), whose outlines coincide well with the mapped geology map (black hatches traced from Fig. 3). None of the known VMS deposits features a distinctive magnetic anomaly, possibly reflecting weak po-sulphide content. However a weak, SE arcuate magnetic high lineament is seen extending from the Lalor to the Chisel Lake deposit region and roughly coincides with the Ghost rhyolite horizon (G – see Fig. 3) that caps/overlies the Lalor deposit. Another weak SE-trending magnetic lineament is seen over the South Bull’s Eye occurrence. More prominent moderate-strong magnetic highs seen further northeast roughly coincide with the Photo rhyolite (P) and Treehouse volcaniclastic-breccia (T) horizons (see Fig. 3) and the Snow Lake fault zone (SLFZ) that suggests it is possibly po-rich as well as graphitic.
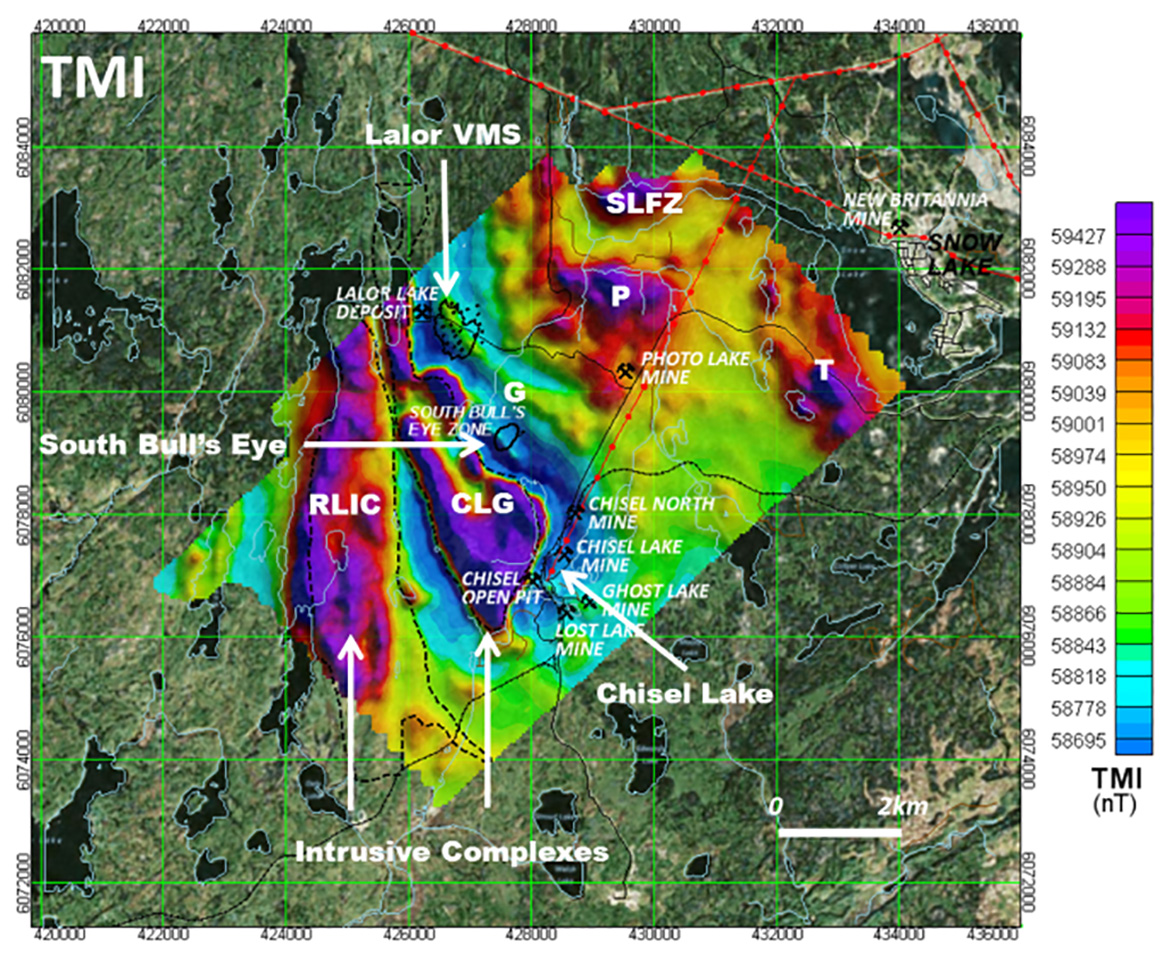
Figure 5: Magnetic TMI results, showing outlines of mapped Richard Lake intrusive complex (RLIC) &Chisel Lake gabbro (CLG) and VMS deposit locations (see Fig. 3), and highlighting weak magnetic high extending from Lalor to Chisel Lake (G), relative to responses from intrusions and other units/features (P, T, SLFZ – see Fig. 3).
Figure 6 presents a magnetic susceptibility (mag-susc.) depth-slice at 500m depth obtained from a 3D inversion of the TMI from the VTEMMAX survey using the UBC Mag3d code (Li and Oldenburg, 1996). The 3D inversion revealed a broad range of magnetic susceptibilities, varying between 0 to 0.1 SI units, but with the strongest values within the upper 500m of the surface. As expected, the image shows generally high mag-susc. values inside the RLIC and CLG intrusions and the northern part of the Photo rhyolite (P) to the NE. However the Ghost rhyolite magnetic high (G) lineament is barely visible and nearly disappears entirely below 500m, which is consistent with its cap-rock nature described earlier. More importantly, both the Lalor VMS and the South Bull’s Eye zone coincide with distinct magnetic susceptibility lows, which is consistent with a Mag/Po-poor mineralogy.
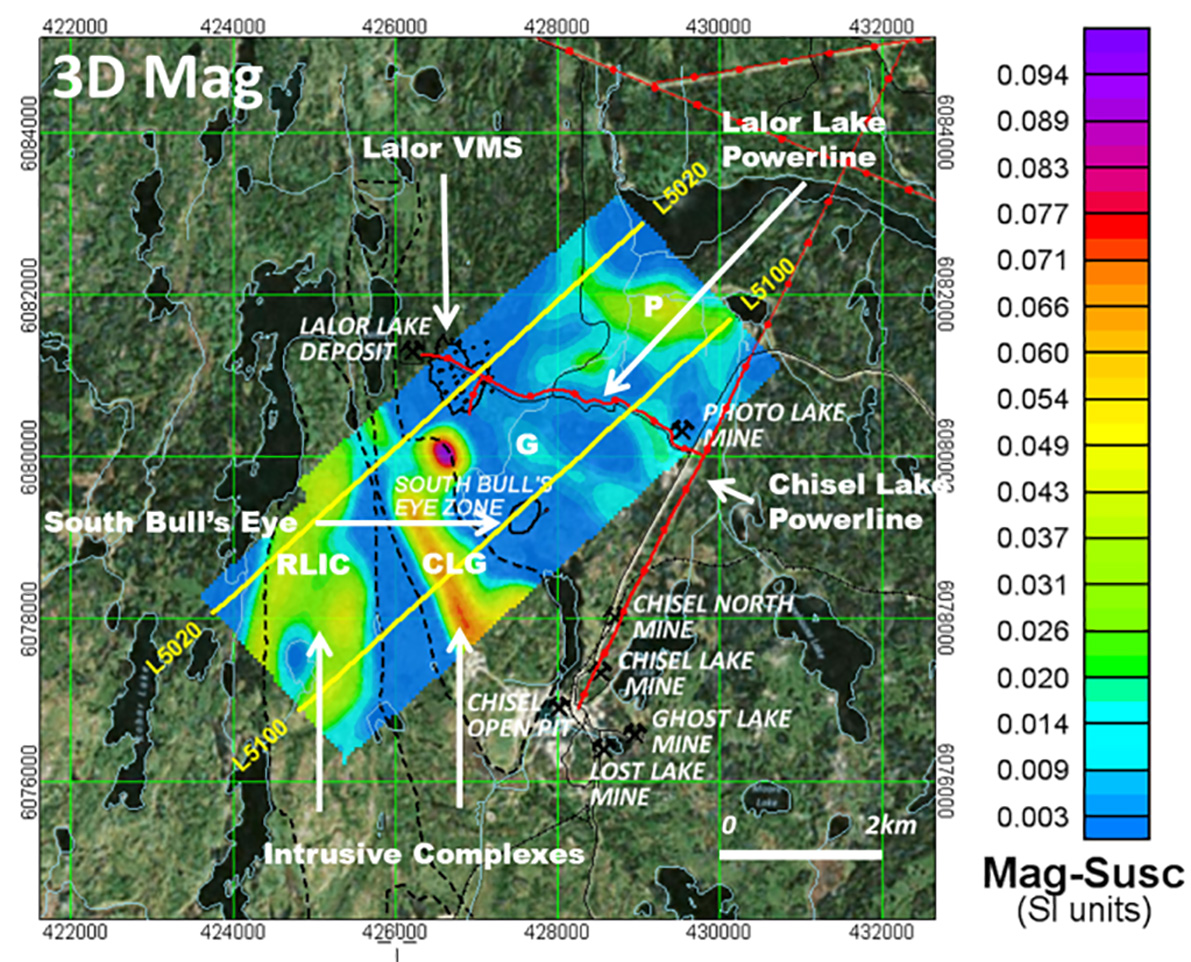
Figure 6: Magnetic susceptibility depth-slice (z=500m) from UBC 3D Inversion of VTEM survey TMI, showing outline of intrusions and highlighting higher mag-susc. values in RLIC & CLG versus low values above Lalor and South Bull’s Eye; and location of L5020 & L5100 model sections in Fig. 11-12.
VTEM Survey Results
Figures 7ab presents the late off-time time constant (Tau) dBz/dt response from the VTEM 2007 and VTEMMAX surveys over the Lalor deposit area. These images highlight the responses from shallow sulphide units just north of Lalor, relative to the weak response over the Lalor VMS itself and the absence of powerline-cultural overprint over the Lalor deposit area in 2007 relative to 2012. Also noticeable is the NS conductive zone just west of South Bull’s Eye, the Chisel Lake powerline, and strong responses from barren Foot Mud sulphide horizon (FMSH) and Snow Lake Fault zone (SLFZ).
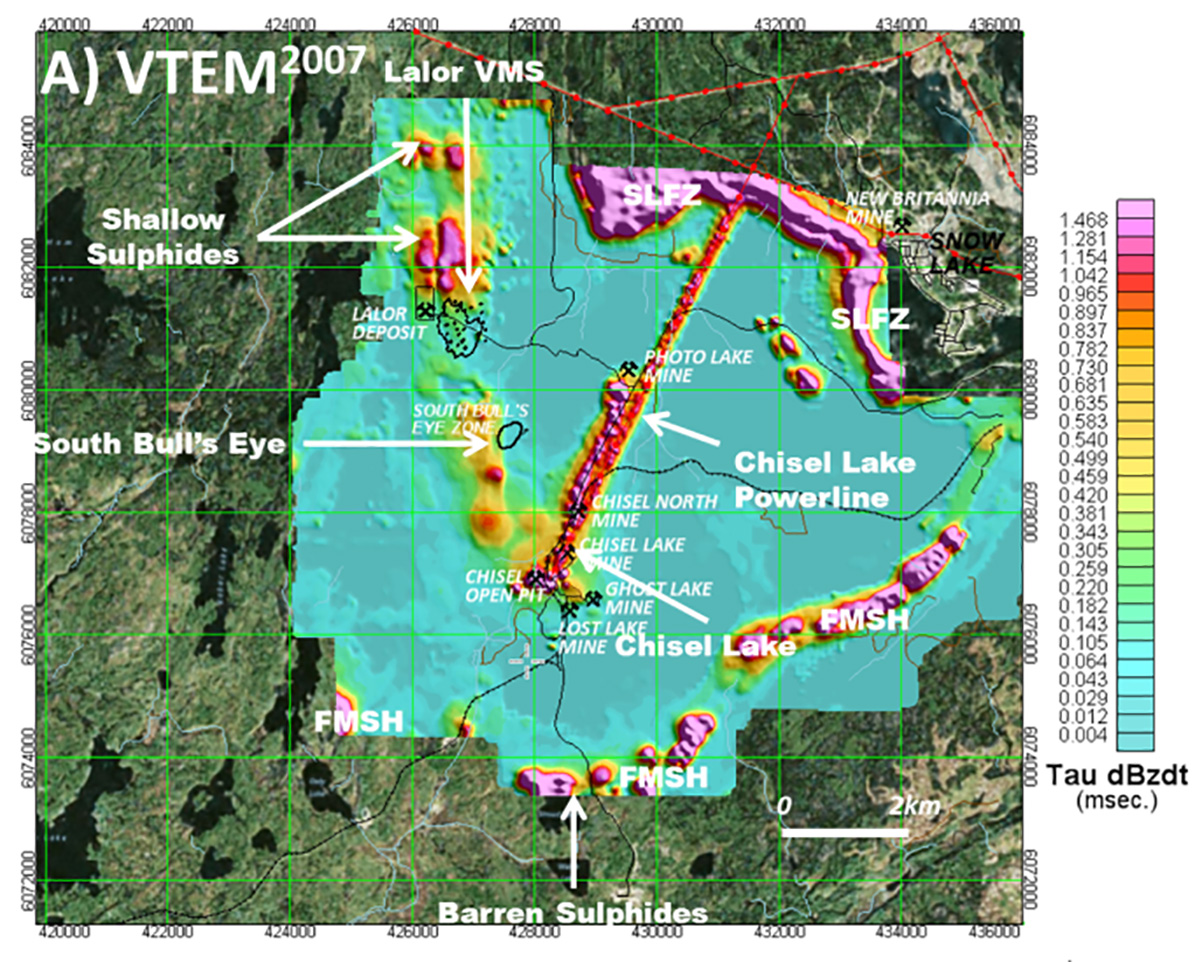
Figure 7: VTEM survey late time Tau from dBz/dt responses for: A) 2007 VTEM.
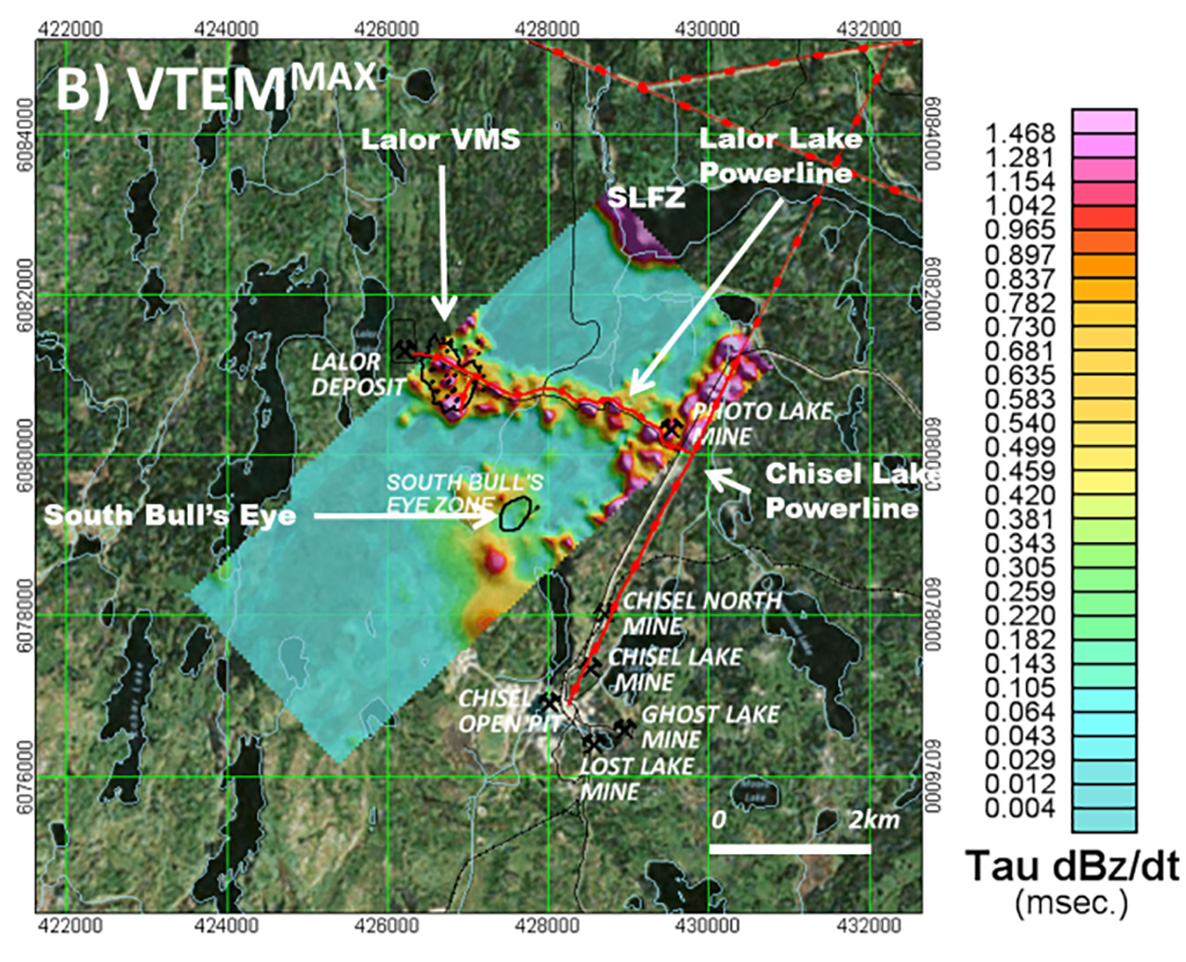
Figure 7: B) 2012 VTEMMAX surveys, highlighting weak response over Lalor VMS deposit, the NS conductive response west of South Bull’s Eye and absence of cultural overprint over Lalor deposit area in 2007 vs. 2012 data.
Figures 8ab present the resistivity depth slices at 400-500m from the VTEM2007 and VTEMMAX surveys over the Lalor region. They were obtained from the resistivity-depth imaging of the dBz/dt response using the Geotech RDI technique that is based on the transformation scheme described by Meju (1998). These images highlight a broad, NNE-trending resistivity low feature that extends across Lalor to Chisel Mine, versus the relatively weaker response over Lalor VMS deposit in 2007, as well as 2012 that has also been overprinted by the powerline and minesite culture that post-date the VTEM2007 survey. However, the large resistivity lows that are centred over the South Bull’s Eye occurrence in both the 2007 and 2012 surveys are also highlighted. Also noticeable are the strong responses over the barren Foot Mud sulphide horizon (FMSH), the Snow Lake Fault zone (SLFZ) and shallow barren sulphide units just north of the Lalor Mine.
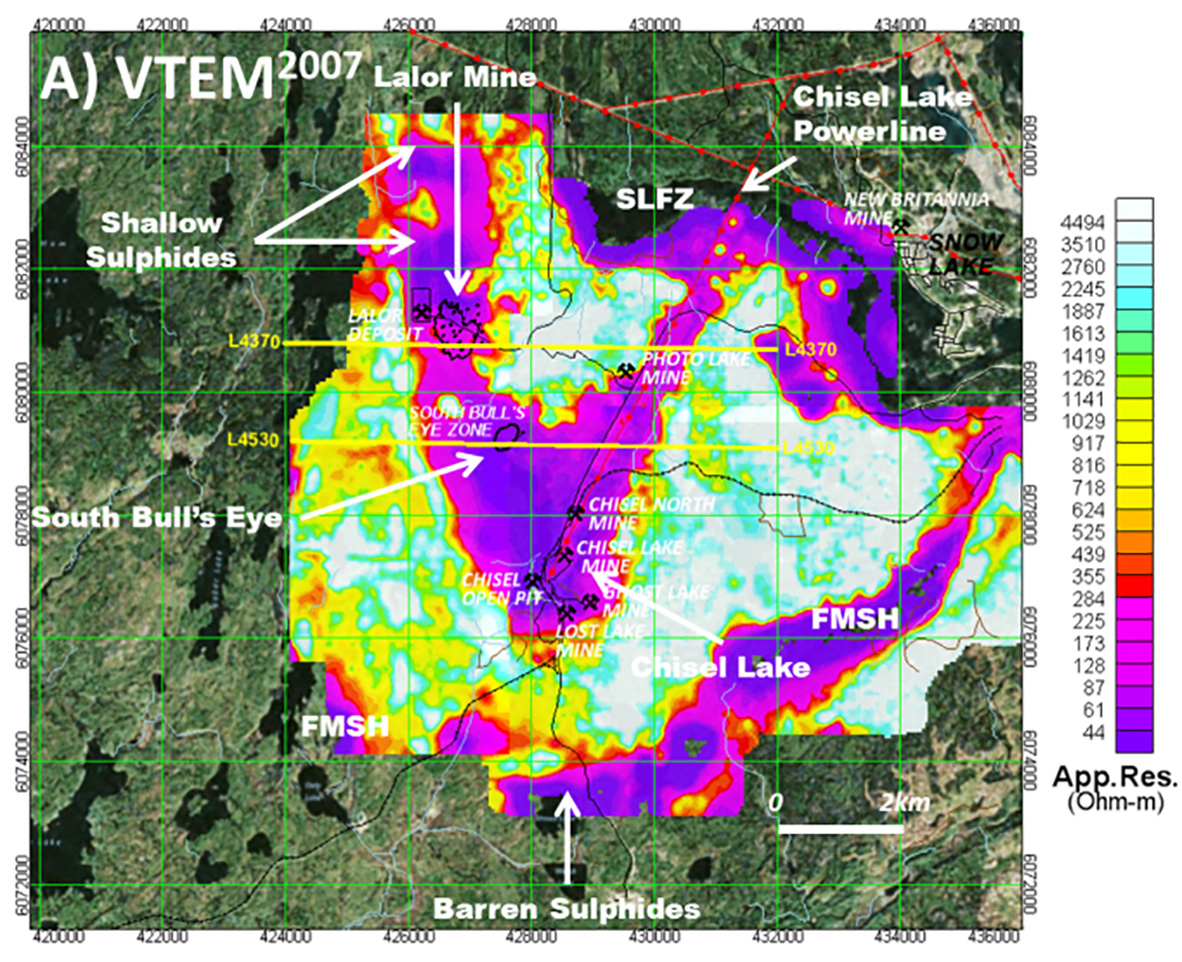
Figure 8: RDI resistivity depth slices from dBz/dt at: A) 400m depth from VTEM2007 surveys.
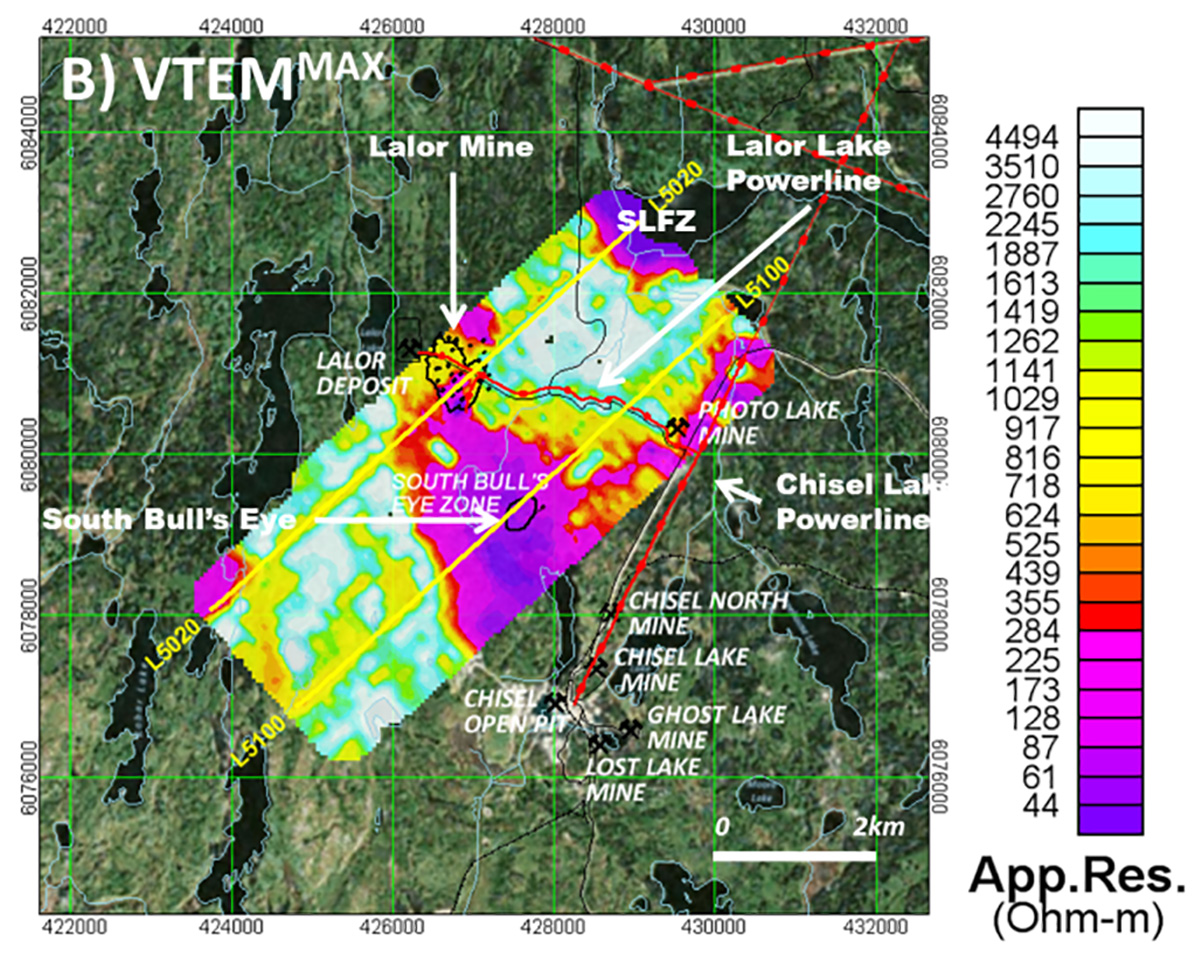
Figure 8: B) 500m depth from VTEMMAX survey. Also shown are locations of RDI model sections in Fig. 11- 12.
ZTEM Survey Results
Figure 9 presents the In-phase ZTEM results in plan at two frequencies (A: 180Hz & B: 45Hz), designed to highlight the relatively shallow (180Hz) and deeper (45Hz) tipper responses, based on relative EM skin depths. They are presented using the DT (Total Divergence; Lo et al., 2009) that converts the tipper cross-overs into peaks using horizontal derivatives. The DT images also show the outline of the Lalor deposit and drill holes overlain. In the DT image, warm colours represent conductive structures and contacts; cool colours represent more resistive units. The Lalor deposit is not well defined in the 180Hz high frequency data to the presence of conductive sulphide units in the footwall rocks to the north – also defined in the VTEM2007 data (see Fig. 7a). Whereas, in the lower frequency 45Hz image that represents a greater skin-depth of investigation, the Lalor deposit and Bull’s Eye occurrences are both better contrasted from their surroundings. The effect of the NE-SW powerline to the Chisel mine is strongly felt, effectively masking the Chisel Lake-Chisel North-Photo Lake deposit responses at all frequencies. However the Lalor Mine and South Bull’s Eye deposit responses, as well as surrounding Snow Lake Fault (SLFZ) and Footwall Mud sulphide horizon (FMSH), are easily resolved in the ZTEM data.
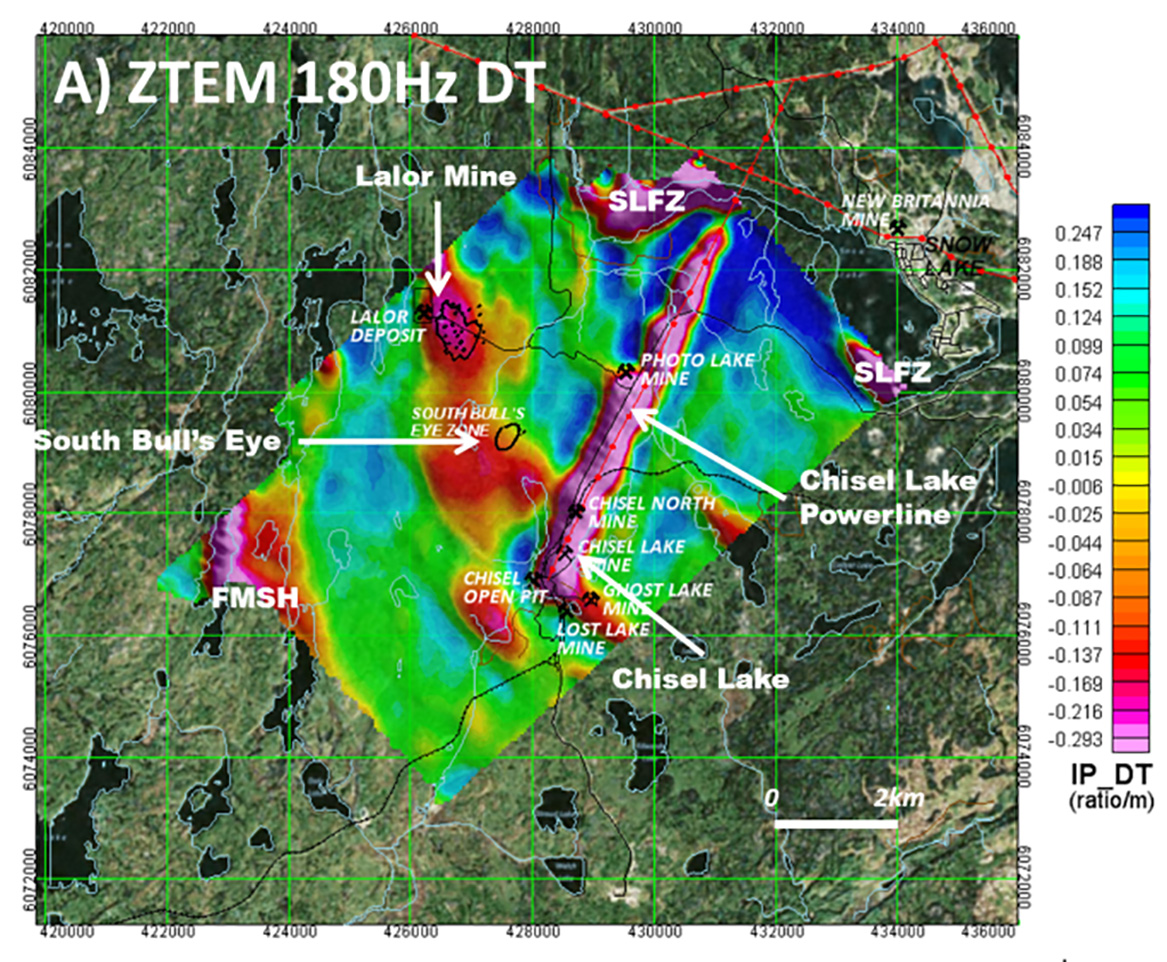
Figure 9: ZTEM In-phase DT at: A) 180Hz.
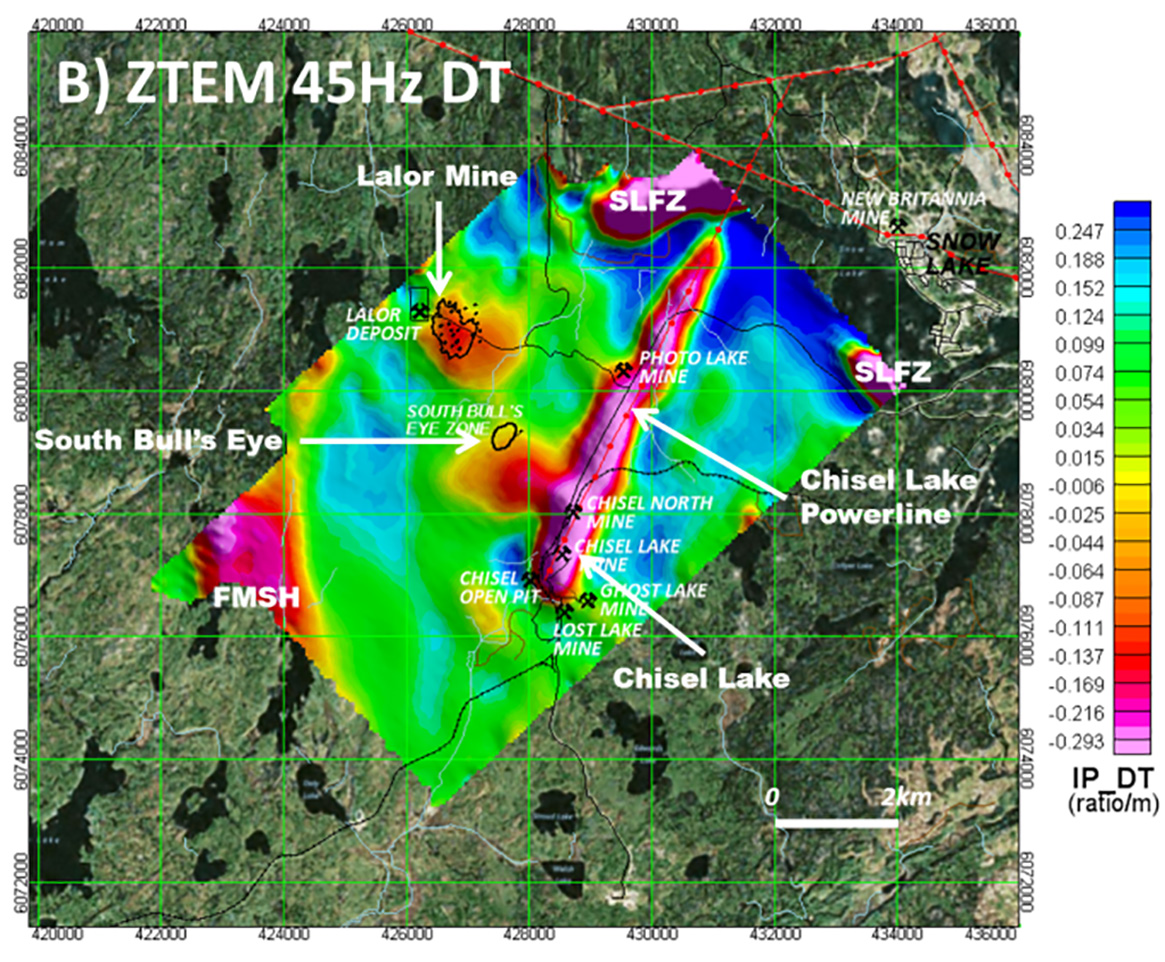
Figure 9: B) 45Hz, highlighting both relatively shallow and deep conductive responses, respectively, over Lalor VMS & Chisel Centre as well as overprint of Chisel Lake powerline.
Figure 10ab present the resistivity depth-slices at 500m obtained from the 2D and 3D inversion of the ZTEM tipper data using the Geotech’s Av2Dtopo code (ref. Legault et al., 2012) and UBC MT3dinv code (ref. Holtham and Oldenburg, 2008), respectively. As shown, both inversion images feature well defined resistivity low anomalies directly over the Lalor VMS deposit and South Bull’s Eye occurrences.
Multi-Parameter Model Comparisons
Figure 11 compares the multi-parameter cross-sections across the Lalor deposit obtained from 1D-2D-3D inversion and imaging applied to the VTEM, ZTEM and Magnetic data, with the deposit outline and drillholes (ref. Blakley, 2008). Figure 11a shows the RDI results for L4370 from the VTEM2007 survey that highlights a ~1.5km wide resistivity low that is perched at ~200-390m depths above the Lalor deposit – possibly clay-altered volcanic rocks or sulphide mineralization in the upper footwall units. The deposit itself lies undetected at greater depths (~600-1200m), below the estimated depth-of-investigation (DOI) limits for the 2007 VTEM system.
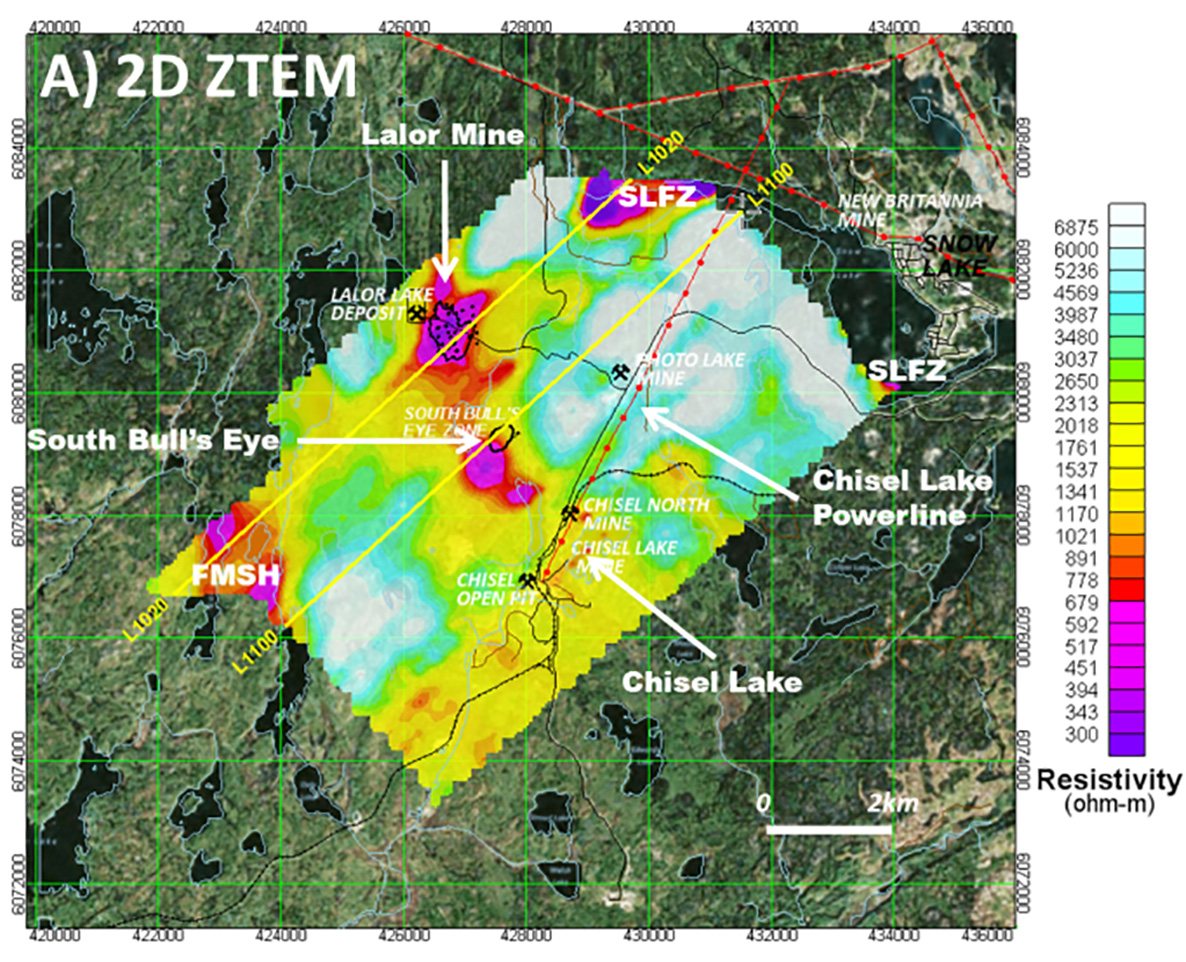
Figure 10: ZTEM Resistivity depth-slice (z=500m) from: A) 2D inversion (Tzx In-line).
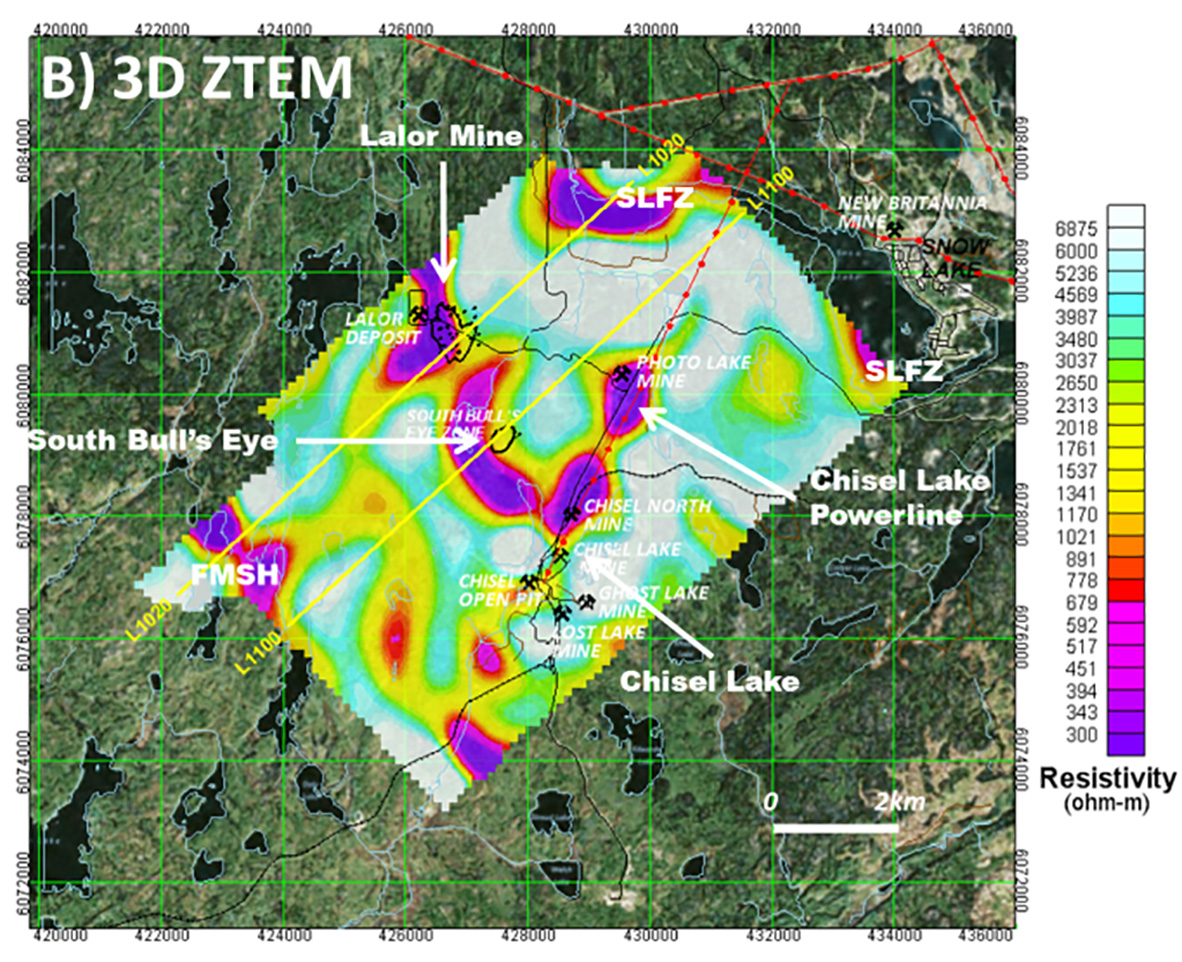
Figure 10: B) UBC 3D inversion, highlighting buried conductive responses above Lalor and South Bull’s Eye and location of L1020 & L1100 model sections in Fig. 11-12.
Figure 11b presents the VTEMMAX RDI cross-section for L5020 from 2012 that features a similar perched conductive layer above the deposit that is slightly wider (~2km) extends from 200-500m depths to below 900-1000m, which is the significantly larger DOI for the VTEMMAX system. However, a shallower, more conductive body is also resolved at approx. 50-400m depths, directly above the Lalor orebody that wasn’t detected in earlier VTEM2007 survey. This NE-dipping, thin-plate conductor must therefore be related to man-made metallic structure, from the Lalor Mine development that was underway in 2012. The Lalor deposit itself, though partially correlated with the broad low resistivity half-space feature, is undetected/unresolved as a distinct conductive feature at depth. In spite of the fact that it lies within the DOI limits of the VTEMMAX system, the evidence suggests that Lalor is being masked by mine-culture at shallower depth.
Figures 11cd present the 2D and 3D inversion results from ZTEM survey data for L1020 from 2009. The 2D model section in figure 11c highlights a distinctive resistivity low feature that correlates well with the actual depth-extent but is slightly broader (~1km) than the lateral width of the Lalor deposit. The 3D model in Figure 11d highlights a more complex anomaly shape, with a shallower, <1km wide more weakly conductive body that correlates well with the VTEM zone, and a deeper, more conductive anomaly that seems to correlates well with the width, vertical extent and possibly also the dip of the Lalor orebody.
Figure 11e presents the magnetic susceptibility section obtained for L5020 using the UBC Mag3D inversion of the VTEM Max survey TEM data. It shows the Lalor deposit lying within a region of low magnetic susceptibility, with slightly higher susceptibility footwall rocks extending from surface to ~400m depths directly above it.
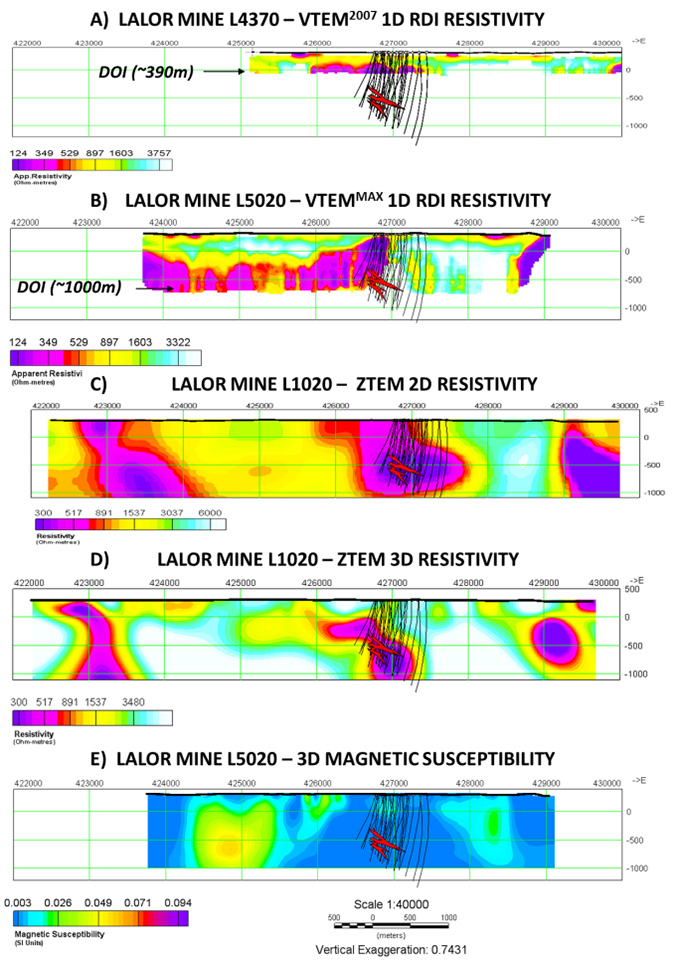
Figure 11: Lalor Mine section: A) VTEM2007 RDI 1D resistivity cross-section for L4370 (see Fig. 8a); B) VTEMMAX RDI 1D resistivity cross-section for L5020 (see Fig. 8b); C) & D) ZTEM 2D & UBC 3D resistivity section for L1020 (see Fig. 10); and E) UBC 3D Magnetic Susceptibility section for L5020 (see Fig. 6); with drillholes and deposit outlines (modified after Blakely, 2010).
Figure 12 presents a similar the multi-parameter comparison for sections across the South Bull’s eye (SBE) EM anomaly that lies approx. 1.5km southeast of Lalor deposit (see Fig. 2) and relates to a subeconomic stringer sulphide mineralized occurrence buried at similar depth to Lalor. The outline of the MaxwellTM conductive 3D plate and model parameters, obtained from the VTEMMAX data that compare well with the ground EM modeling (Hudbay, pers. comm., 2009), are shown for reference. In the absence of cultural contamination, the results from the 3 different surveys can be compared directly to the known geology. As seen in Figure 12a, the VTEM2007 RDI image for L4530 shows a 2km wide resistivity low (<120 Ωm) that is perched above the SBE at ~200m depths and extends to ~350-390m depths, the maximum DOI estimate for VTEM2007. A subcropping, steeply dipping conductive zone that is defined near 426500mE and relates to a sulphide mineralized unit in the overlying footwall rocks is poorly resolved in this RDI. Another shallow-buried, broad conductive feature situated further east near 429600mE correlates with the Chisel Lake Mine powerline.
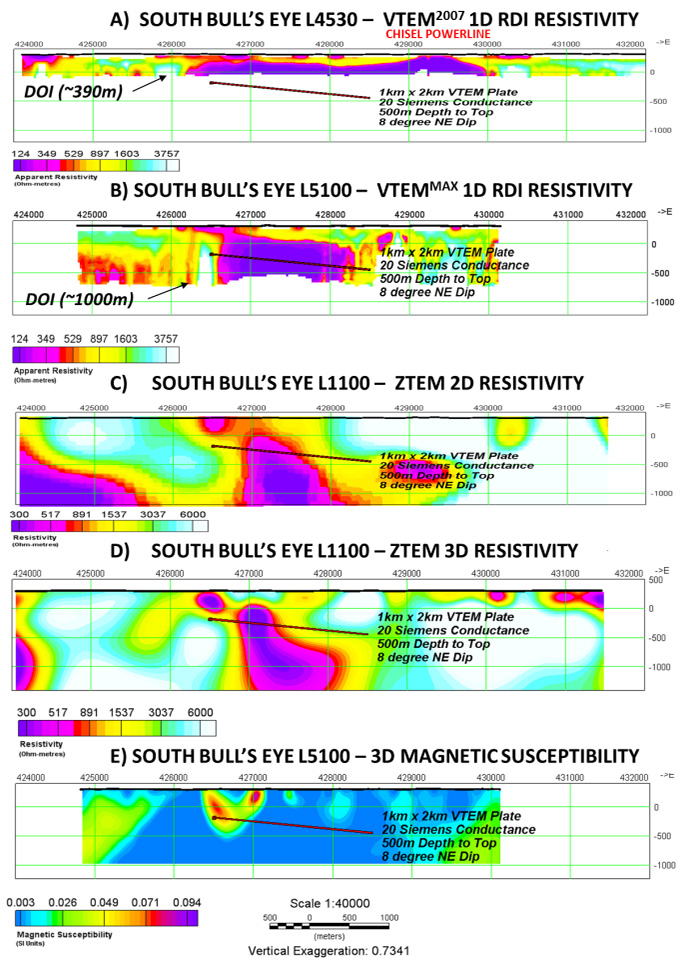
Figure 12: South Bull’s Eye section: A) VTEM2007 RDI 1D resistivity cross-section for L4530 (see Fig. 8a); B) VTEMMAX RDI cross-section for L5100 (see Fig. 8b); C) & D) ZTEM 2D & UBC 3D resistivity section for L1100 (see Fig. 10); and E) UBC 3D Magnetic Susceptibility section for L5100 (see Fig. 6); with Maxwell plate model outlines.
The VTEMMAX RDI image for L5100 in figure 12b reveals a similar >1.5km km wide-body resistivity low that is slightly deeper (~300m) than in the earlier data but extends to depths close to the 900-1000m DOI depths estimated for the VTEMMAX system. As shown, the Maxwell plate model fits well within the limits of wide-body conductive feature. The subcropping conductive sulphide unit in the overlying footwall rocks is well resolved near 426500mE in this RDI image and the 3D mag-susc. section in figure 12e indicates that it is also highly magnetic, possibly related to pyrrhotite.
The ZTEM resistivity cross-sections obtained from 2D and 3D inversion are shown in Figures 12cd. Both images highlight a buried (~400m), NE-dipping, wide-body (>500m) conductive feature that appears to extend below 1.5km depths. The shallower footwall sulphide conductor near 426500mE is also imaged. The ZTEM and VTEM results are therefore in good agreement.
Conclusions
Results from three different airborne EM surveys over a 5-year span have allowed us to compare the system responses over the Lalor VMS deposit region, near Snow Lake. The initial VTEM2007 survey that was undertaken shortly after the Lalor deposit discovery reveals that the orebody escaped detection due to its large depth of burial (>550m) relative to the depth-of-investigation limits of the VTEM2007 system as well as the absence of a magnetic response. A shallower, wide-body conductive feature that was resolved at 300m-depths in both the VTEM2007 and later VTEMMAX results above Lalor might represent clay alteration related to the VMS deposit or else sulphide mineralization in the overlying footwall rocks. Although the improved DOI limits for VTEMMAX should have allowed it to penetrate to Lalor, a conductive feature that is defined at shallower depth is instead related to mine-site culture and masks the deeper deposit signature. ZTEM survey results from 2009, prior to mine development, appear to detect the Lalor VMS deposit, which seems to be confirmed in 2D-3D inversion results. Another comparison with all three systems over a similar, but culturally uncontaminated, deeply buried EM anomaly, known as South Bull’s Eye that is related to subeconomic stringer sulphides, proves it to be well resolved in the VTEMMAX and ZTEM results.
Acknowledgements
We wish to thank BCGS and MMMC for initiating the Lalor Symposium and Hudbay Minerals for graciously releasing these Lalor ZTEM and VTEM data for use in our study.
References
Bailes, A., Rubingh, K.E., Gagné, S., Taylor, C., Galley, A., Bernauer, S., Simms, D. 2013: Volcanological and structural setting of Paleoproterozoic VMS and gold deposits at Snow Lake, Manitoba; Mineralogical Association of Canada-Geological Association of Canada, Joint Annual Meeting, Winnipeg, MB, May 22-24, 2013, Field Trip Guidebook FT-A2; Manitoba Innovation, Energy and Mines, Manitoba Geological Survey, Open File 2013-3, 63 p.
Blakley, I.T., 2008, Technical report on the Lalor Lake deposit, Snow Lake, Manitoba, Canada: NI 43-101 report for Hudbay Minerals Inc. by Scott Wilson Roscoe Postle Associated Inc., 149 p.
Carter, R., Schwartz, T., West, S. and Hoover, K., 2012, Pre-feasability study technical report, on the Lalor deposit, Snow Lake, Manitoba, Canada: Report (NI 43-101) prepared by Hudbay, 292 p.
Gagné, S., and Beaumont-Smith, C., 2014, of Snow Lake – Squall Lake – Herblet Lake: Compilation and Geological Mapping, 1:20,000 map, NTS 63K16/63J1.
Gilmore, K., 2010, New technology and new discoveries in the Prolific Flin Flon Greenstone Belt: HudBay’s Perspective: Presented at PDAC Prospectors and Developers Convention, Geophysics Session, Toronto, Canada.
Holtham, E., and Oldenburg, D.W., 2008, Three-dimensional forward model and inversion of Z-TEM data: SEG, Expanded Abstracts, 564-568.
Legault, J.M., Wilson G., Gribenko A., Zhdanov, M. S., Zhao, S. and Fisk, K., 2012, An overview of the ZTEM and AirMt airborne electromagnetic systems – A case study from the Nebo-Babel Ni-Cu-PGE deposit, West Musgrave, Western Australia: Preview, 158, 26-32.
Li, Y., and Oldenburg, D.W., 1996, 3-D inversion of magnetic data, Geophysics, 61, 394-408.
Lo, B., and Zang, M., 2008, Numerical modeling of Z-TEM (airborne AFMAG) responses to guide exploration strategies, SEG, Expanded Abstracts, 27, 1098-1101.
Meju, Maxwell A., 1998, A simple method of transient electromagnetic data analysis: Geophysics, 63, 405-410.
Witherly, K., Irvine, R., and Morrison, E.B., 2004, The Geotech VTEM time domain electromagnetic system: SEG, Expanded Abstracts, 1217-1221.