For a PDF of this paper click here
Summary
Two airborne EM surveys were conducted over the Drybones Kimberlite by Geotech Ltd. A VTEM helicopter time domain EM survey flown in 2005 is compared to a ZTEM helicopter tipper AFMAG EM survey flown in 2009. Both surveys detect anomalous responses over the pipe, however according to conductivity-depth transforms and skin-depth estimates, supported by 3D modeling, it seems unlikely that VTEM response is representative of the actual kimberlite, buried more than 100 meters underneath the conductive sediments. It appears that the consolidated kimberlite might be too resistive to be differentiated from granodiorites using conventional TEM methods. On the other hand the ZTEM response appears to be able to differentiate between the diatreme (consolidated kimberlite) and the host rock, lying below the conductive blanket.
Key words: ZTEM, VTEM, AFMAG, electromagnetic, airborne, kimberlite.
Introduction
The Drybones Kimberlite is situated approximately 45 km SE from the town of Yellowknife, NWT, Canada (Figure 1). It was initially discovered in 1994 with a single drill hole. The kimberlite is situated in Slave Province of the Canadian Shield. The bedrock geology in Drybones area consists of Archean granite, granodiorite and tonalite (Kretchmar, 1995). The kimberlite is located in Drybones Bay and lies completely underwater, at an average depth of 38 m. The kimberlite itself is further overlain by 65-75 m of lake sediments, predominantly clay, till and sand. The morphology of the pipe can be described as a spatially elongated intrusion (900 m by 400 m), consisting of three facies (diatreme, crater and pyroclastic) distinguished by physical and mineralogical properties of the rock (Figure 2). In general, the diatreme facies appears to be more consolidated and therefore more electrically resistive.
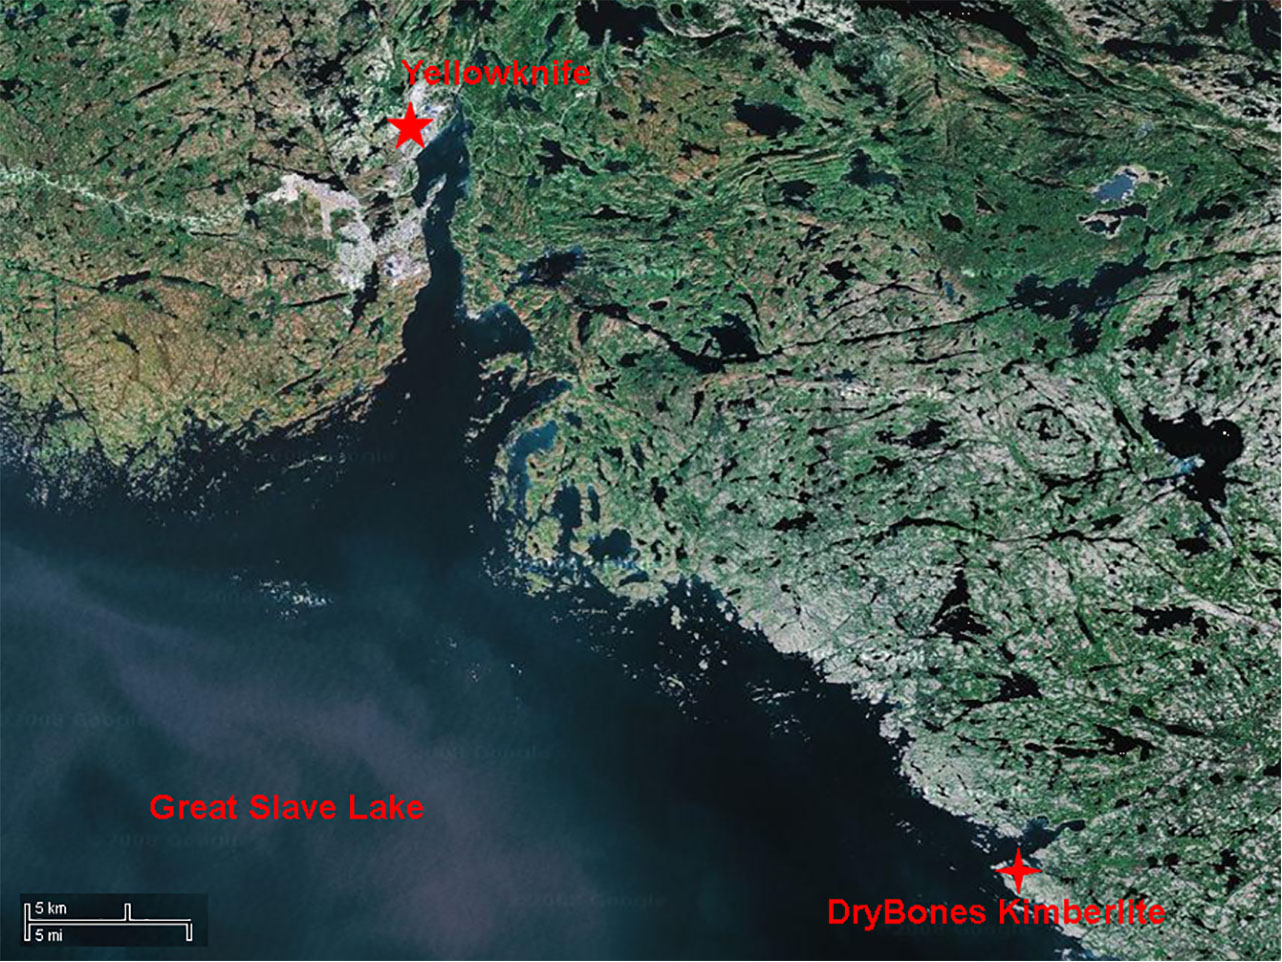
Figure 1: Geographic location of the Drybones kimberlite (Google Earth, 2009).
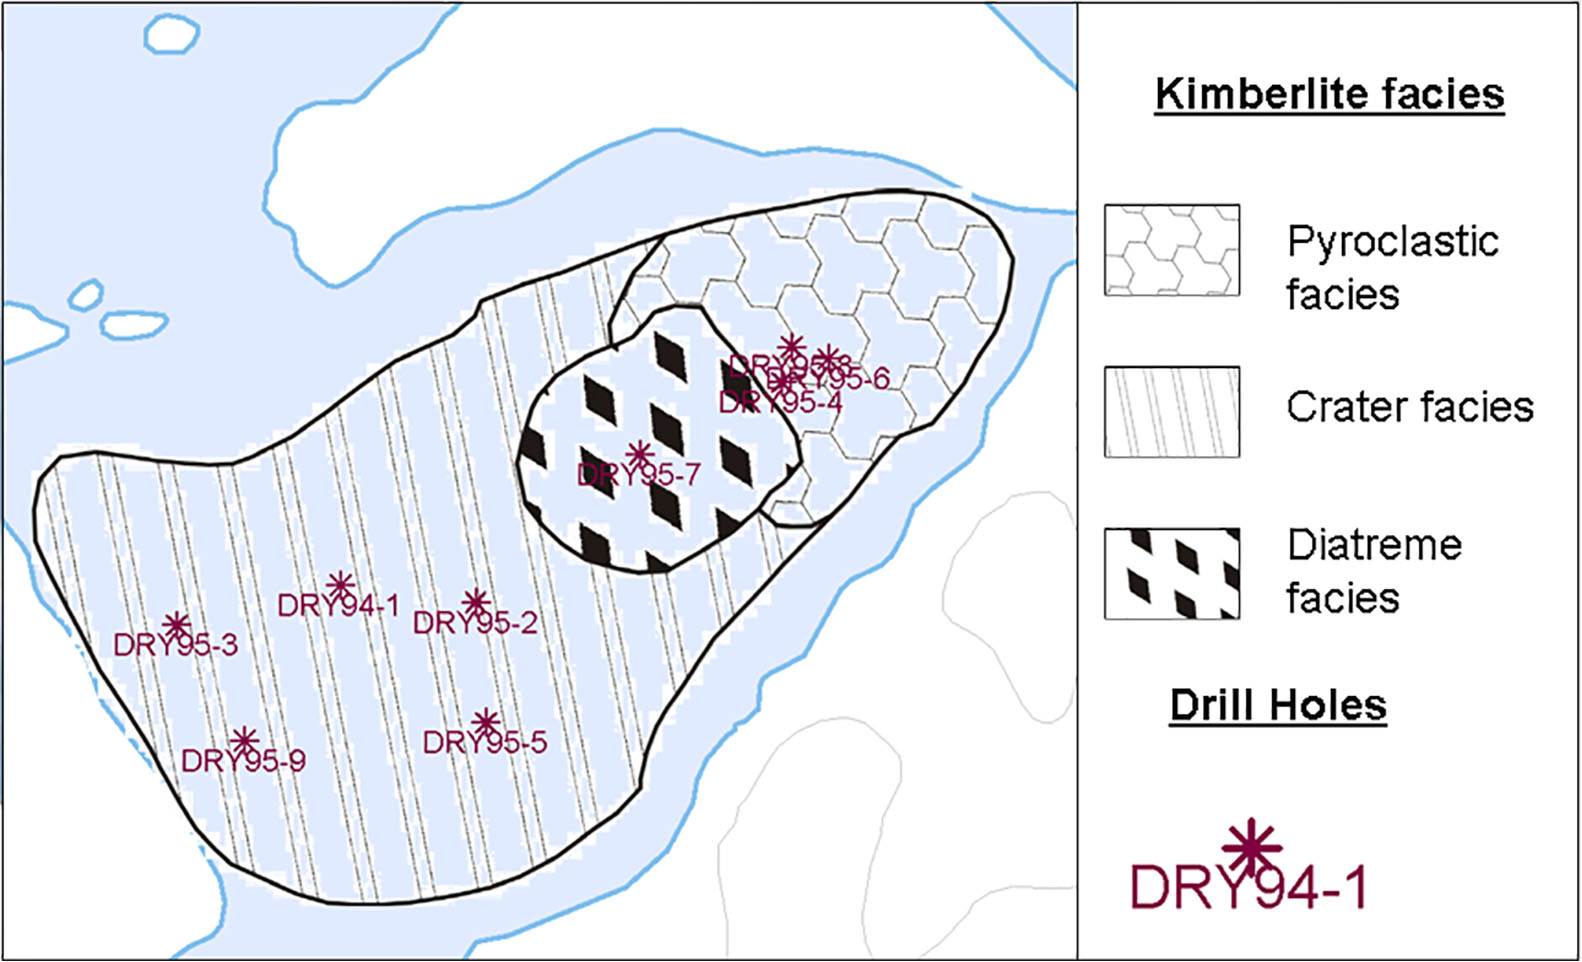
Figure 2: Surface morphology of the Drybones pipe and the locations of 1994-95 Drill Wells (Kretchmar, 1997).
EM Surveys Over Drybones
Geotech, Ltd has conducted two airborne EM test surveys over the Drybones Kimberlite (Figure 3). A VTEM (Witherly et al, 2004) time-domain electromagnetic survey was flown over the pipe in 2005, followed by a larger ZTEM (Lo and Zang, 2008; Lo et al., 2009) tipper AFMAG (Ward, 1953) survey in 2009.
The VTEM test survey was flown at a nominal receiver height of 35m with data sampled at 3m intervals; the ZTEM test survey was flown at a nominal receiver height of 61m at 10m sampling intervals. Both surveys were flown at a 100m nominal line-spacing. The surveys were designed in a manner so the ZTEM and VTEM flight lines would overlap each other as much as possible. In particular, VTEM flight line 50 corresponds to ZTEM flight line 1190. Both EM geophysical studies were successful in identifying the anomaly over the kimberlite (Figure 4).
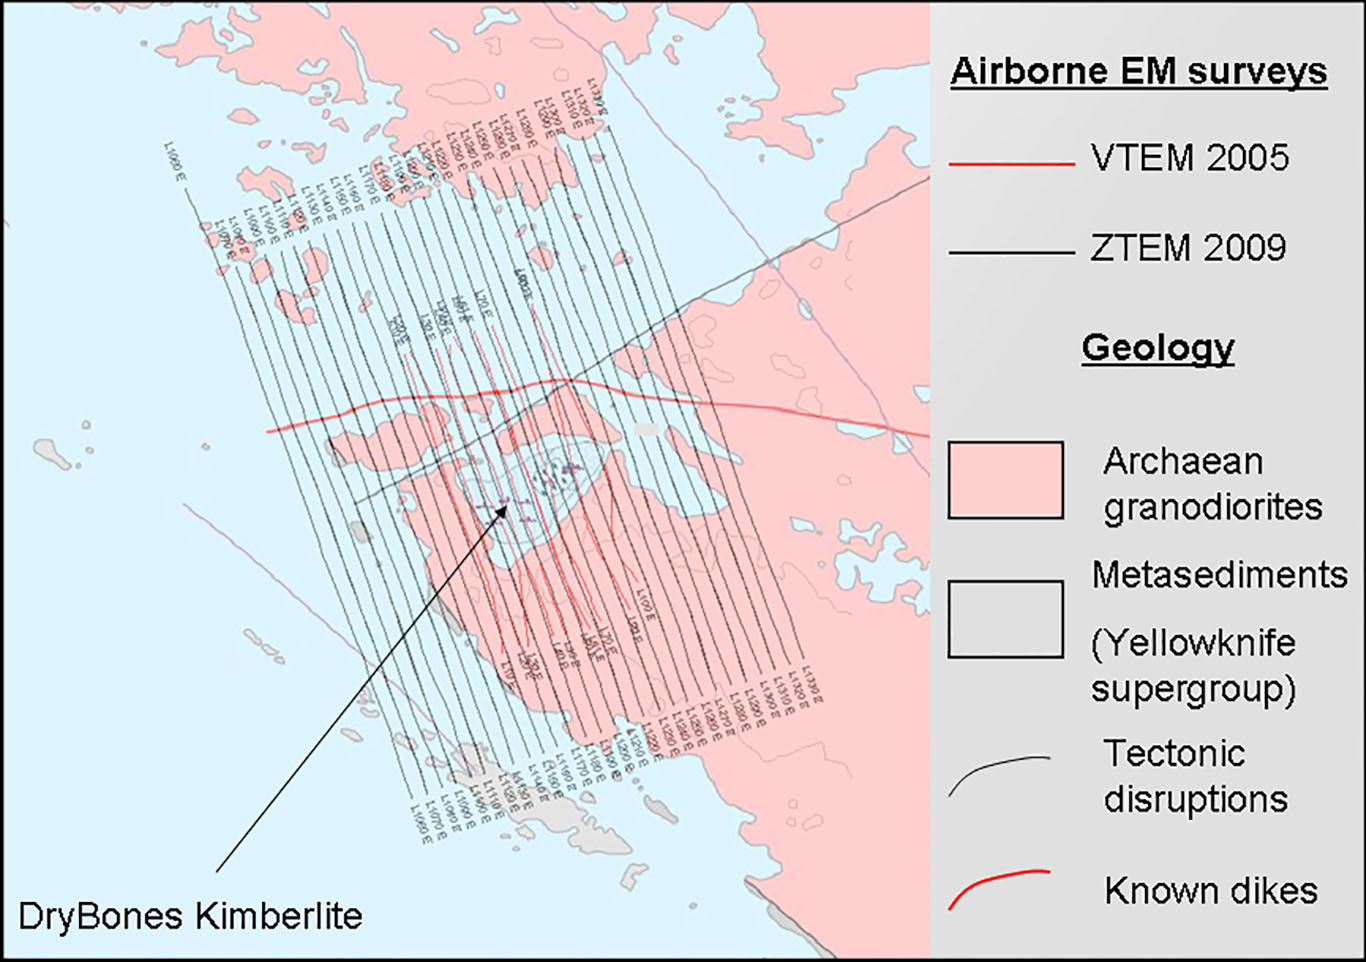
Figure 3: Airborne EM survey flight lines over the Drybones kimberlite pipe
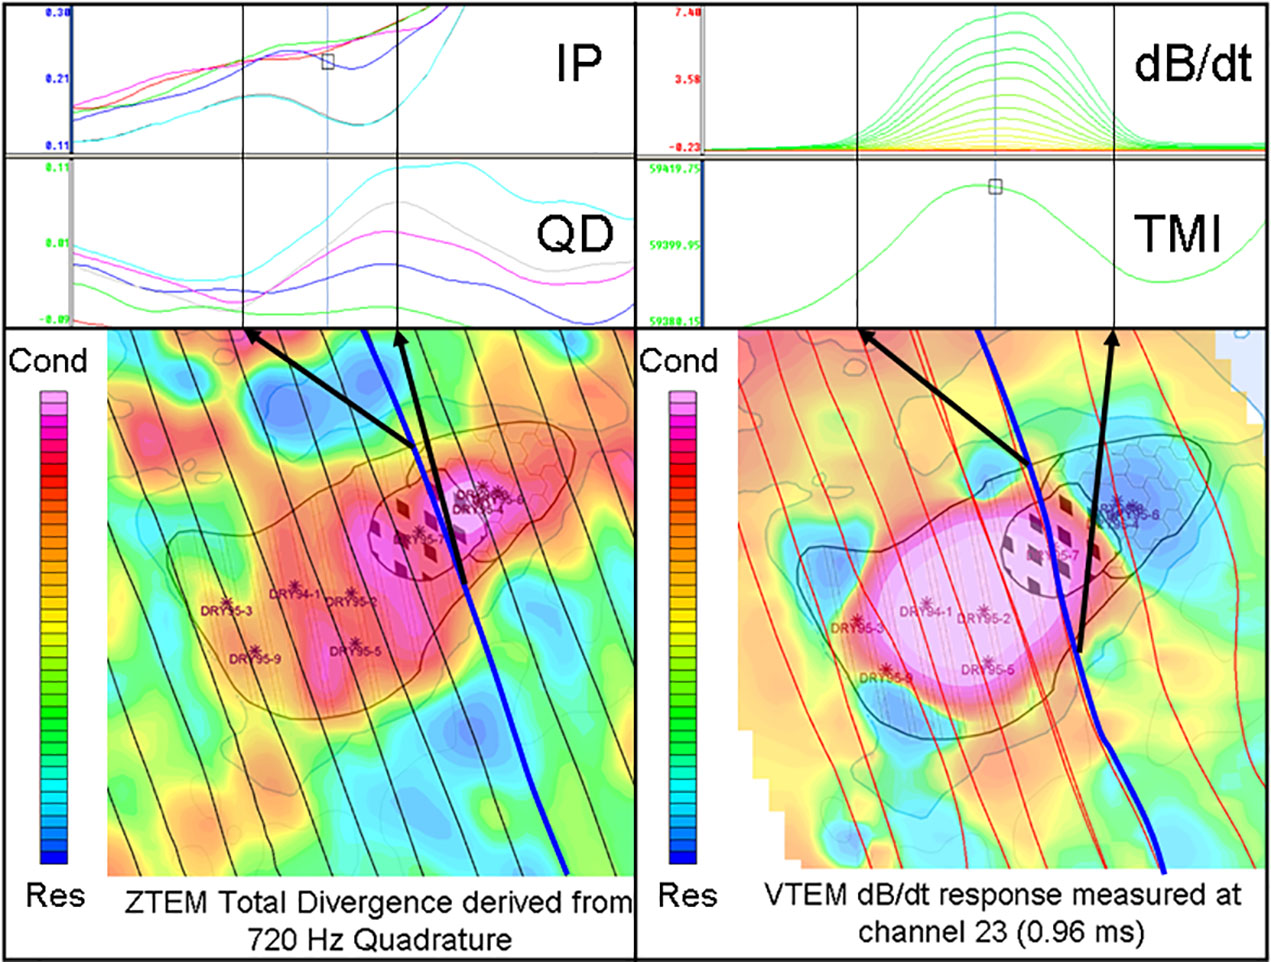
Figure 4: ZTEM and VTEM anomaly comparisons over Drybones kimberlite pipe (red color indicates more conductive response).
Discussion
EM data recorded during the 2005 and 2009 studies over the Drybones Kimberlite were corroborated with the 1994-95 drilling data. In Figure 4 it seems that the anomaly maxima are displaced relative to each other with the VTEM anomaly maximum being centered over the thickest pack of lake sediments, while the ZTEM Quadrature total divergence (DT; Lo et al.., 2009) anomaly seems to correlate well with the location of kimberlite diatreme facies. The Quadrature part of the ZTEM tipper is shown because it provides a more distinct response over the kimberlite than the In-Phase. This is attributed to naturally higher levels of noise noted in the measured ZTEM In-Phase data.
The EM data have been inverted using the conductivity-depth imaging transform (CDI) software for the VTEM dB/dt vertical component data (Prikhodko, 2010) and the Zvert2d inversion for ZTEM (Legault et al., 2009) of de Lugao and Wannamaker (1996), for the In-line Hz/Hx tipper data, using both In-Phase and Quadrature components from 30 – 720Hz. For the ZTEM Hz/Hx In-Phase 180Hz data, a current density-depth transform was also applied using the Karous-Hjelt filtering technique (Karous and Hjelt, 1983). Results of these procedures for a central line over the Drybones Kimberlite are presented in Figure 5.
The inversion model sections reflect the morphology of the kimberlite recovered by each survey (Figure 5). The VTEM CDI suggests that VTEM data, although they define a strong anomaly over the kimberlite (approx. 4S), might in fact be only reflecting the response from the water-saturated fine-grained sediments at the bottom of the bay, i.e., VTEM might not be resolving any deeper response due to strong EM signal attenuation in the thick pack of conductive sediments and high electrical resistivity of consolidated kimberlite. In fact this is consistent with general observations of EM survey results over kimberlites. In contrast, the ZTEM 2D inversion and Karous-Hjelt images both suggest a deeper anomalous structure that reflects the deeper geology, i.e., relatively insensitive to the shallower overburden, which is consistent with the large depths of penetration and planar horizontal primary fields for ZTEM.
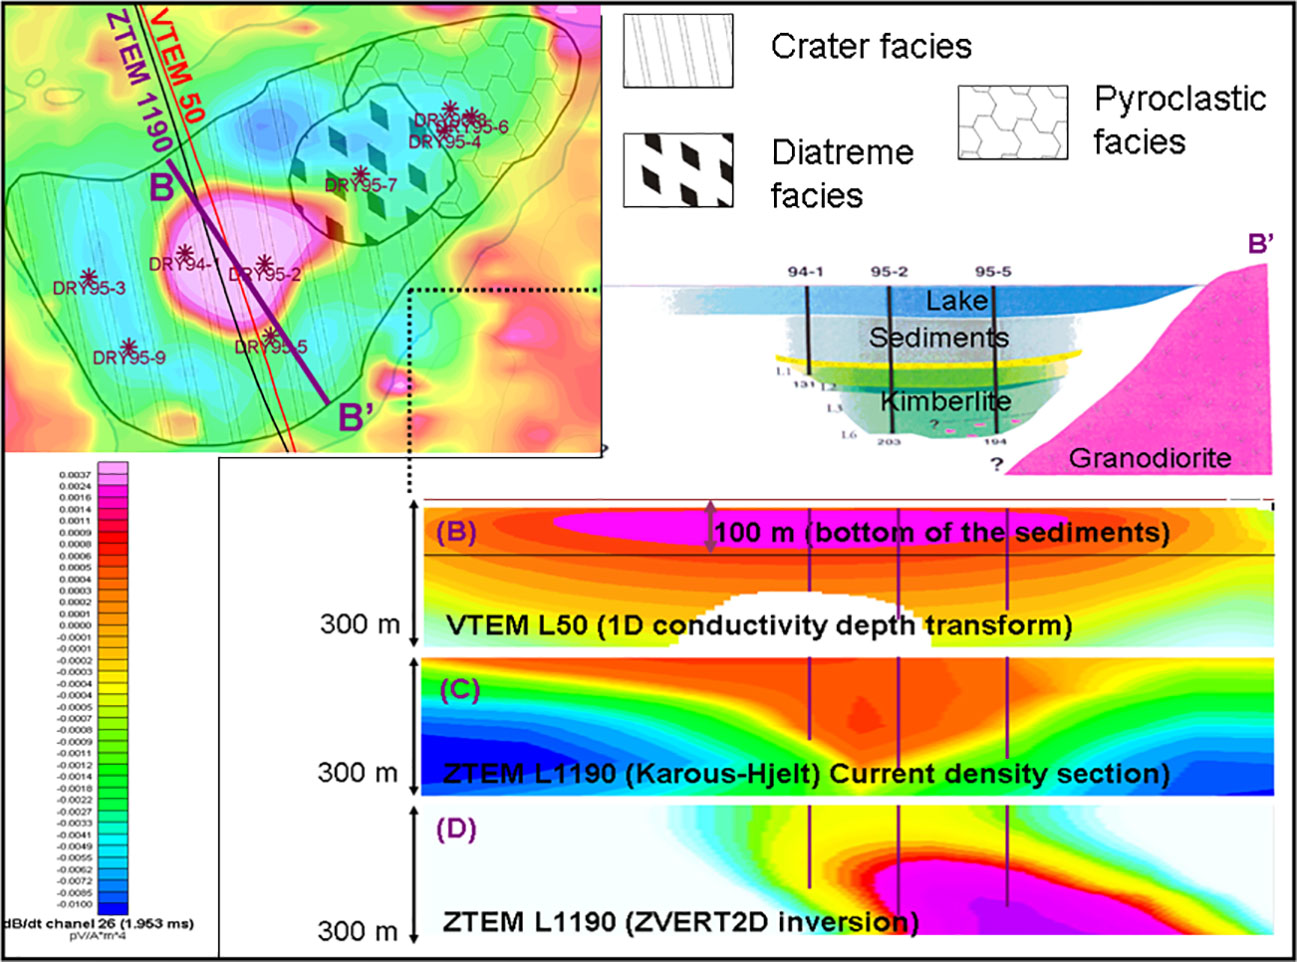
Figure 5: (A): Geologic cross-section over Drybones kimberlite pipe (Kretchmar, 1995); (B): Conductivity-depth transform over VTEM line 50; (C): Karous-Hjelt Current Density-Depth transform (derived from Hz/Hx In-Phase 180 Hz Channel) for Line 1190; (D): Zvert2d inversion over ZTEM line 1190.
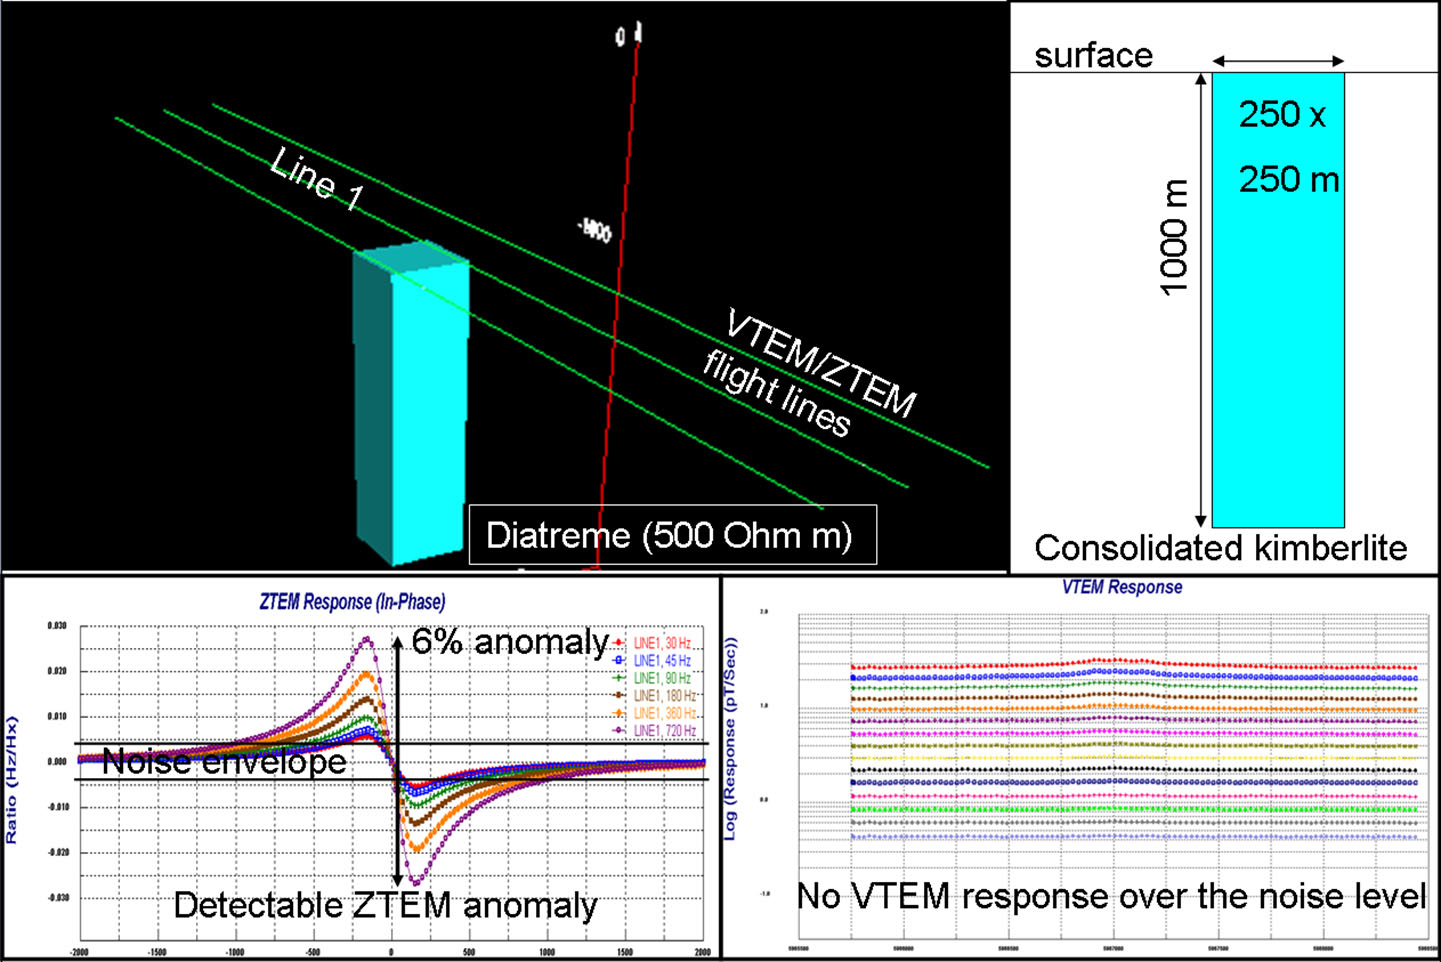
Figure 6: ZTEM forward model (Hz/Hx In-Phase) vs. VTEM forward model over 500 Ohm m target (consolidated kimberlite with no overburden) in 2000 ohm-m host rock, using Emigma 3D forward modeling software.
These observations are further studied using 3D forward EM modeling using the Emigma (PetRos EiKon Inc., Brampton, ON, Canada). Figure 6 presents the expected ZTEM and the VTEM survey profile response over a representative kimberlite, similar to Drybones, considering no conductive overburden. The host and target resistivities were estimated from the VTEM and ZTEM inversion results, but otherwise represent reasonable physical properties. As shown in the simulation, the expected ZTEM anomaly response of 6% is above the 1% noise envelope, however, the VTEM forward model indicates the detectable signal would be barely above the expected geologic and system noise levels. These results confirm the importance of the overburden on the VTEM response relative to ZTEM.
Conclusions
Both the VTEM and ZTEM EM technologies proved to be effective in detecting an anomalous EM response over the Drybones Kimberlite. Inversion modeling and imaging of the VTEM suggests that it mainly defines the thick overburden, overlaying the kimberlite (top 100 m) and poorly resolves the deeper crater facies. In contrast, examination of the ZTEM inversion and imaging results suggest that it defines the lateral resistivity contrasts between the deeper Archean bedrock and target kimberlite.
3D forward modeling confirms that VTEM will not be easily able to differentiate between units of high electrical resistivity, associated with consolidated diatreme facies of the kimberlite and the surrounding granodiorite. Similar 3D modeling of the ZTEM, on the other hand, confirms that the kimberlite will be easily differentiated from the host rock and compare well with the observed data obtained over Drybones.
The observed differences between the two technologies are consistent with relative sensitivities between absolute and relative conductivities, relative source field orientations vs. the target host-rock geometries, as well as relative differences in depth penetration.
EM techniques, in general, are routinely used in kimberlite exploration. However it is widely accepted that they are indirect detection tools that can only assist provided the eroded kimberlites are overlain by an overburden that is sufficiently conductive to be discerned. The recent tests suggest that the newer ZTEM airborne technology should prove to be an effective for the detection and deep geologic mapping of kimberlites, due to its greater sensitivity to electrical resistivity contrasts and greater penetration, relative to other airborne EM methods.
Approximately 30% of kimberlite pipes are non-magnetic (Kaminski, 2000); many of them remain undetected, because they do not have any erosional overburden, crater or pyroclastic facies, which would allow them to be detected by conventional EM methods. Such pipes can provide sufficient electrical contrast for ZTEM airborne surveys to be effective tools. In fact Drybones remains the only kimberlite pipe detected on the Western boundary of Slave Province of the Canadian Shield. Our results strongly suggest ZTEM technology could be more widely applied as a primary or secondary airborne method for kimberlite detection and characterization in resistive environments.
References
De Lugao, P. P., and Wannamaker, P. E., 1996, Calculating the two-dimensional magnetotelluric Jacobian in finite elements using reciprocity: Geophysics Journal. International, 127, 806-810.
Kaminski, V. F., 2000, Application of Airborne Geophysical methods to kimberlite exploration on the Canadian Shield: M.Sc. thesis, Moscow State University, published in Russian, 167 pp.
Karous, M.R., and Hjelt, S. E., 1983, Linear filtering of VLF dip-angle measurements: Geophysical Prospecting, 31, 782-794.
Kretschmar, U., 1995, Drill Report on the Drybones Bay Kimberlite Property, Drybones Bay, Great Slave Lake, District of MacKenzie, Northwest Territories, for Trade Wind Resources Ltd., Vancouver, BC: submitted to NWT Dept. Indian & Northern Affairs Mining Recorder, 36 pp.
Legault, J.M., Kumar, H., Milicevic, B., and Wannamaker, P.E., 2009, ZTEM tipper AFMAG and 2D inversion results over an unconformity uranium target in northern Saskatchewan: SEG Expanded Abstracts, 28, 1277-1281.
Lo, B., Legault, J.M., Kuzmin, P., and Combrinck, M., 2009, Z-TEM (Airborne AFMAG) tests over unconformity uranium deposits: 20TH ASEG International Geophysical Conference & Exhibition, Adelaide, AU, Extended Abstract, 6 pp.
Lo, B., and Zang, M., 2008, Numerical modeling of Z-TEM (airborne AFMAG) responses to guide exploration strategies: SEG Expanded Abstracts, 27, 1098-1101.
Prikhodko, A., 2010, Conductivity Depth Imaging software (TEMRDI.gx): personal communication.
Ward, S. H., 1959, AFMAG – Airborne and Ground: Geophysics, 24, 761-787.
Witherly, K., Irvine, R., and Morrison, E.B., 2004, The Geotech VTEM time domain helicopter EM system: SEG Expanded Abstracts, 23, 1217-1221.