Presented at IV SIMPÓSIO BRASILEIRO DA SBGF – BRASÍLIA 2010
For a PDF of this paper click here
Abstract
An airborne AFMAG demonstration survey was conducted over an EM test range that hosts known magmatic copper-nickel occurrences in western Australia, using the ZTEM™ tipper electromagnetic prospecting system. The test was conducted in late 2009 and was flown to test the system’s capability to detect the highly conductive nickel-bearing massive sulphide bodies in western Australia, below the existing VTEM™ depth of investigation. The ZTEM™ results at Forrestania property define both concordant structures related to lithology, as well as discordant lineaments associated with the known ultramafic intrusive center. 2D inversion results define dyke-like conductive features that partly include the known sulphide bodies but extend to greater depth. These results closely resemble those obtained over Eagles Nest magmatic ni-cu deposit in northern Ontario.
Introduction
An airborne tipper AFMAG (audio frequency magnetics; Ward, 1959; Labson et al., 1985) test survey was carried out over the Forrestania property that is situated 400km east of Perth, Western Australia, in October-December, 2009. The test survey consisted of Tipper AFMAG mea- surements using the ZTEM™ (Z-axis tipper electromagnetic) helicopter system (Lo and Zang, 2008; Lo et al., 2009; Legault et al., 2009a; Legault et al., 2009b), as well as magnetics using a caesium magnetometer. ZTEM™ data consist of in-line (X) and cross-line (Y) tipper transfer functions (In-Phase & Quadrature) at 6 frequencies between 25-600Hz. The survey consisted of 25 North-South flight lines and 47 East-West lines, 12 to 16km long, and totaling 967 line-km, that were obtained at a 100-200m line spacing over an approximately 90 km2 area (Figure 1c).
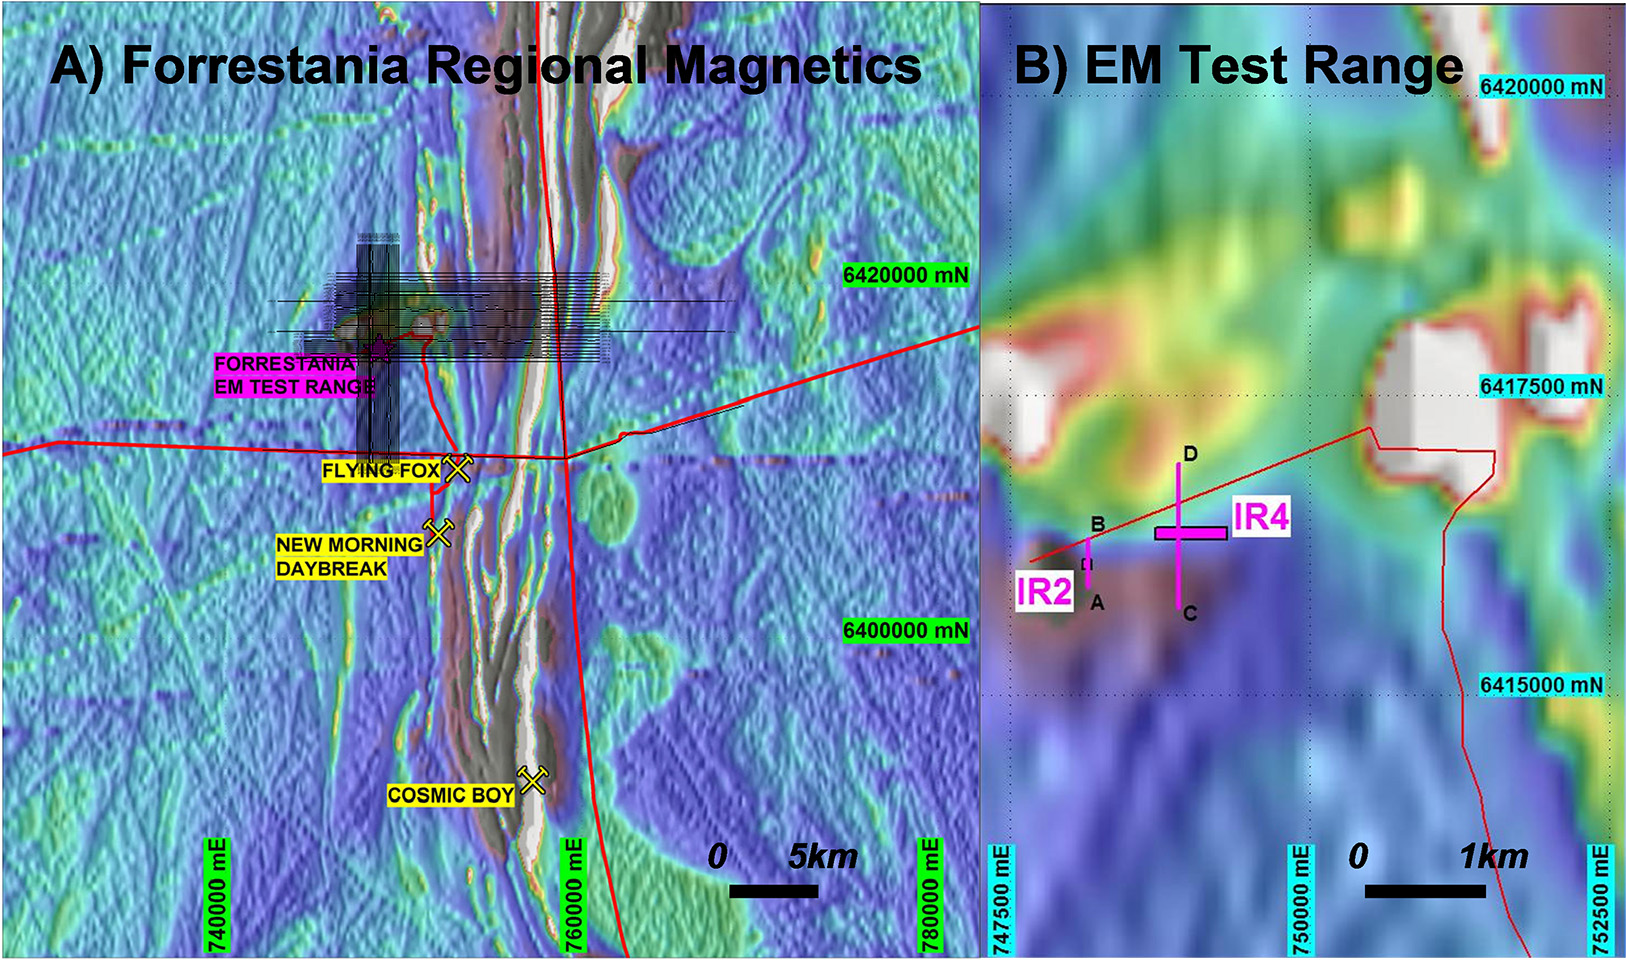
Figure 1: Forrestania EM Testrange a) Local plan with Aeromagnetic Backdrop and ZTEM™ flight lines b) Detail showing known EM conductors c) EM test range and ZTEM™ survey line locations as overlays (modified after www.sgc.com.au/forrestania).
The Forrestania property is approximately 85km by road/track east of Hyden and ~155km by road/track SSE of Southern Cross. The Forrestania property lies 7.5km northwest of the Flying Fox nickel mine (Figure 1ac) that contains some of the highest grade nickel in the world (3.4Mt at 4.7% Ni; www.westernareas.com.au). The property hosts the Forrestania EM Test Range (Figure 1abc) that has been specifically established to test electromagnetic methods (surface, airborne and downhole techniques) over two discrete and varying bedrock massive sulphide conductors defined during previous geophysical exploration programs (www.sgc.com.au/forrestania). The objective of the Forrestania ZTEM™ test survey was to assess its effectiveness in detecting high grade nickel sulphides below the VTEM™ (versatile time-domain electromagnetic; Witherly et al., 2004; Witherly and Irvine, 2006) depth of investigation.
General Geology
The Forrestania Archean Greenstone Belt is dominated by tholeitic basalt and occupies wide zones to the east and west of a core of north-south trending sediments (cherts, siltstones, sandstones). Ultramafic rocks, including komatiites, now altered to chlorite schists, and serpentinized dunites also occur. Some meta-gabbros are associated with the flanking mafic rocks and several BIF units are associated with ultramafic rocks. A series of east-striking lower Proterozoic gabbroic dykes cut across the greenstones (Lintern, 2004).
The Forrestania nickel sulfide occurrences are localized in intrusive dunite bodies at the base of komatiites, which are interlayered with tholeiitic mafic rocks, schists, and sedimentary rocks that include iron-formation and sulfide cherts. The important nickel sulfide occurrences are pentlandite-rich disseminations distributed in the basal portions of metamorphosed intrusive dunites. Massive pyrrhotite-rich sulfides occur within reaction zones between dunite and footwall country rocks and as remobilized veins and stringers in footwall metasediments (Porter and Mckay, 1981).
Previous Geophysics
The Forrestania EM test range has been surveyed using a variety of EM techniques, including Fixed Loop SQUID TEM, Moving Loop Fluxgate TEM, Drillhole Pulse TEM and VTEM™ helicopter TEM (Figure 2a), as well as 200m aeromagnetic (Figure 1ab) and radiometric coverage. The local electrical environment is characterized by the presence of a conductive overburden (~10-20S), highly resistive bedrock units and lack of any other bedrock conductors in the immediate area other than the two bedrock conductors (IR2 & IR4 – Figure 1b) that were defined. These were successfully drill-tested and contain barren, semi-massive to massive pyrrhotitic sulphides (www.sgc.com.au/forrestania).
The western conductor (IR2) is of limited areal size (<75x75m), shallow depth <100m, high conductance >7000S and dips northward ~30-40 degrees (Figures 1b and 2b). This conductor is strongly defined by surface and downhole TEM and makes for an interesting airborne TEM target (Figure 2a).
The eastern conductor (IR4) is extensive in strike/plunge extent (~500-600m+) and reasonably well constrained in depth extent (~100-150m). The conductive source is situated at considerable depth ~300-325m (western side) to ~400m+ (eastern side), is highly conductive ~5000-10000S and dips northward ~30-40 degrees (Figure 1a and 2b). IR4 is a more challenging conductive target for surface TEM methods with smaller transmitter loops. It has not been successfully detected in previous airborne surveys (see Figure 2a).
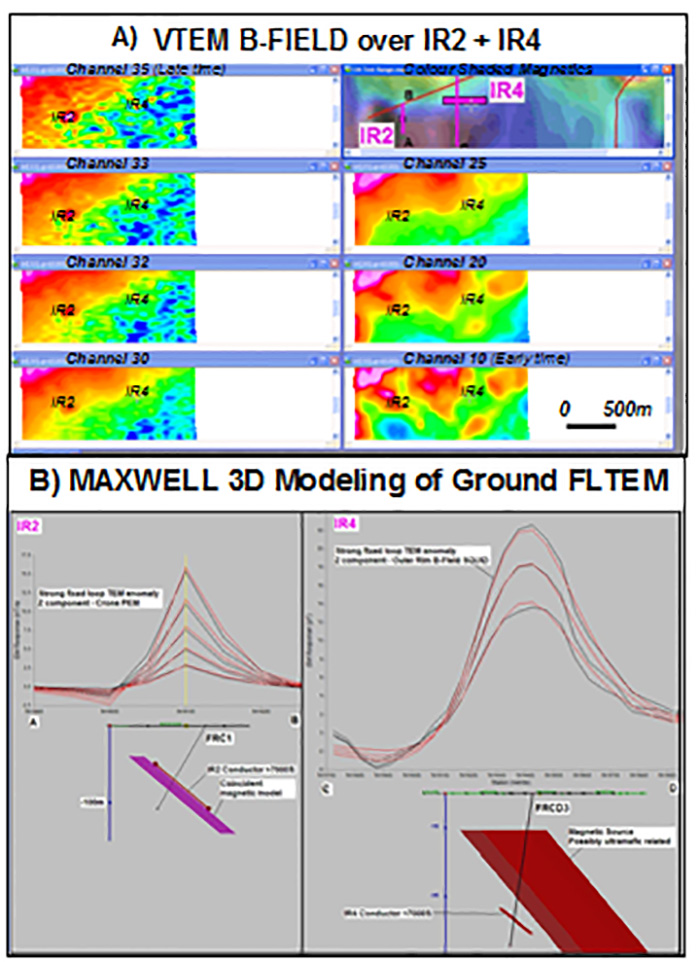
Figure 2: a) VTEM™ late to early channel B-field and magnetic survey results at Forrestania, showing well defined high conductance response on late-channels over IR2 and weak/questionable late-time anomaly over deeper IR4 target (K.Fisk, Geotech Airborne Ltd., pers comm., 24-Feb-2010) b) Maxwell plate-modeling results of ground Fixed Loop TEM data over conductors IR2 (center) and IR4 (right; after www.sgc.com.au/forrestania).
ZTEM™ Survey Analysis
Figure 3 presents the ZTEM™ In-phase Total Divergence (DT) results at high (300Hz) and low frequency (37Hz) that compare the relative shallow and deep resistivity structure across the Forrestania Test Block. The DT results convert the ZTEM™ tipper cross-over data into peak-responses (Lo et al., 2009) which assists their interpretation in plan and are analogous to the Peaker parameter of Pedersen (1998) that is similarly used in airborne VLF. In these DT images, current density peaks (warm colours) correspond to positive cross-over response in the In-Phase profiles, at depth; whereas cooler colours correspond to reversed cross-overs over more resistive rocks. Assuming a 10-100 ohm-m background resistivity, the ZTEM™ skin depth penetration range, between 600Hz and 25Hz likely spans <100m to 1km depths.
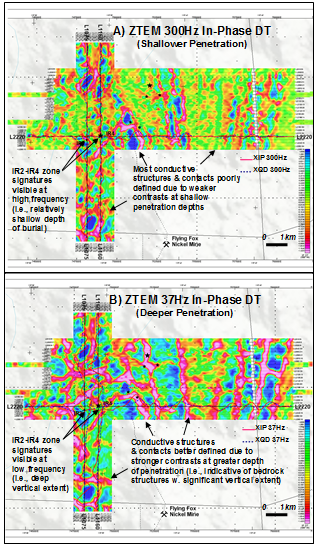
Figure 3: ZTEM™ In Phase Total Divergences (DT) a) high (300 Hz) frequency/shallow penetration and b) low (37 Hz) frequency/greater penetration (right) with XIP & XQD data profiles over targets of interests (IR2 & IR4).
The shallow (300Hz) DT image in Figure 3a is poorly contrasted in comparison with the deep (37Hz) DT results in Figure 3b, and reflects the presence of widespread, thick conductive overburden cover. At progressively lower frequencies, the DT images at greater skin depths further clarify the presence of many conductive lineaments that most likely correspond to bedrock structures, lithologic contacts and alteration zones at depth. Interestingly, the IR2 and IR4 massive sulphide targets correlate with linear, moderately-well defined DT anomalies both at high and low frequencies, which suggests: a) relatively shallow depth of burial, and b) relatively deep vertical depth extent. In general, the close spatial similarity between DT images across the ZTEM™ frequency bands suggests that the geologic units below the Forrestania test Block primarily dip subvertically and extend to depth.
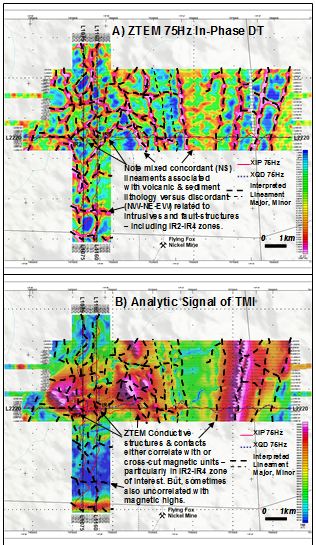
Figure 4: ZTEM™ In Phase Total Divergences (DT) a) 75Hz mid-frequency/moderate penetration and b) Analytic Signal of Total Magnetic Intensity (TMI) plan image, with XIP & XQD data profiles over targets of interest (IR2 & IR4) and interpreted ZTEM™ lineaments overlain.
Figure 4 compares the ZTEM™ 75Hz (mid-frequency) DT image (Figure 4a), as well as interpreted conductive lineaments, and the Analytic Signal of the Total Magnetic Intensity (TMI) that removes the effects of primary field inclination and magnetic remanence (Figure 4b). The DT lineaments are characterized by the fairly equal mix of north-southerly concordant and discordant NW-NE-EW trends; the former which matches the regional strike direction and therefore likely relate to conductive stratigraphies and/or fault-contacts within the volcanic and sedimentary lithologies; whereas the latter most likely relates to intrusive features and cross-cutting fault-fracture zones, as well as possible mineralized or alteration zones. Interestingly, the IR2 and IR4 zones both occur at the southeast tip of NW-SE trending DT lineaments. Similarly, the ZTEM™ conductive trends appear to either correlate well with magnetic units, indicating either magnetite-rich conductive ultramafic host rocks, possibly sulphide mineralized, particularly in the eastern half of the survey area. Alternatively, DT highs cross-cut magnetic highs, suggesting porous or clay-altered fault zones. This mix of concordance and discordance is particularly evident within the IR2-IR4 zones of interest, which both lie along the southern edge of a large, intrusive-like magnetic high that is deformed/displaced locally (Figure 5).
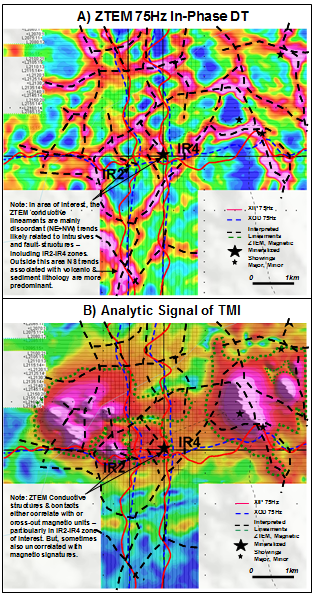
Figure 5: Close up of figure 4 over IR2-IR4 zone of interest, showing ZTEM™ In Phase Total Divergences (DT) a) 75Hz mid-frequency/moderate penetration and b) Analytic Signal of Total Magnetic intensity (TMI) plan image, with ZTEM™ profiles and interpreted lineaments overlain
In marked contrast, some areas feature little or no correlation between magnetic and DT conductive lineaments – most notably, to the north and south of the main intrusive magnetic feature that hosts IR2 and IR4. In these outer areas, the DT lineaments either correspond to fault zones or possibly occur in either more felsic volcanics or metasediments.
Figure 5 presents a close-up of the ZTEM™ DT and Analytic Signal images shown in Figure 4, highlighting the variations in conductive and corresponding magnetic susceptibility contrasts in the central zone of interest surrounding the IR2 and IR4 showings. In this area, the ZTEM™ conductive lineaments are primarily NE and NW discordant and closely associated to the magnetic high but not themselves always magnetic. The DT highs appear to both a) mark the intrusive contact between the surround bedrock and likely an ultramafic pluton that is conductive possibly because of variable talc-alteration or else is multi-phased; and b) define cross-cutting structures – possibly altered and/or mineralized ultramafic dykes and/or fault zones that extend into and away from the main intrusive body. As clearly shown, the IR2 and IR4 massive sulphide zones occur within DT conductive lineaments yet clearly these are part of a larger more extensive, variably conductive complex that is also present.. Indeed, the Forrestania ZTEM™ and magnetic results closely resemble those obtained over other magmatic nickel deposit settings, notably the Axis Lake deposit (Legault et al., 2009) and particularly Eagle’s Nest (Greenough and Palmer, 2010), where ZTEM highs occur directly over the massive sulphides but also map the altered mafic-ultramafic systems and controlling structures that host the deposits.
Two-Dimensional (2D) Inversion
In order to study the spatial relationship between the known geology and the ZTEM™ signatures, two dimensional (2d) inversions have been performed over selected lines across the survey area and are presented in Figures 6-8. The 2D inversions were performed on the In-line (Z/X) component, In-Phase & Quadrature data – spanning 30Hz to 720Hz – using the Zvert2d code developed for Geotech (Legault et al., 2009b) that is based on the 2D inversion code with Jacobians of de Lugao and Wannamaker (1996), the 2D forward code of Wannamaker et al (1987), and the Gauss-Newton parameter step equations of Tarantola (1987). The start model for the inversions was a 100 ohm-m half-space. Using an error floor of 1.0-3.0%, on average, the inversions numerically converged to <1.0 RMS in 3-5 iterations.
Figure 6 presents the resistivity cross-sections derived from the 2D ZTEM™ inversion across the known IR2 massive sulphide occurrences, along two north-south flight lines. Superimposed on the 2D ZTEM™ inversion image is the outlines of the IR2 conductive plate-model presented earlier in Figures 2b. The line 1075 inversion section (Fig. 6) indicates that the IR2 conductive plate-model occurs along the south edge of a larger (200m width) conductive body (10-30 ohm-m) that subcrops and strengthens as it extends to 400-500m depths downdip. The IR2 ZTEM™ anomaly lies south of a much larger (2.5km width) and more variably conductive body that extends to greater depth (>1-1.5km) and also correlates with the larger magnetic high. This large conductive magnetic high is interpreted to represent an ultramafic intrusive that is likely layered or multi-phased and/or variably talc-altered. The IR2 ZTEM™ anomaly is interpreted to represent a possible dyke-like ultramafic body that hosts the IR2 massive sulphide deposit, which due to its small size and shallow depth, is likely not well resolved in the ZTEM™ data or in the 2D model – the latter requires confirmation using 3D synthetic modeling. A similar, conductive dyke-like signature centred near 6419000N, north of the main ultramafic intrusive, resembles the IR2 response and also extends to >500m depth. It therefore represents a follow-up target, in addition to the deeper anomaly below IR2. Similar inversion results were obtained for survey data obtained over the IR4 showing.
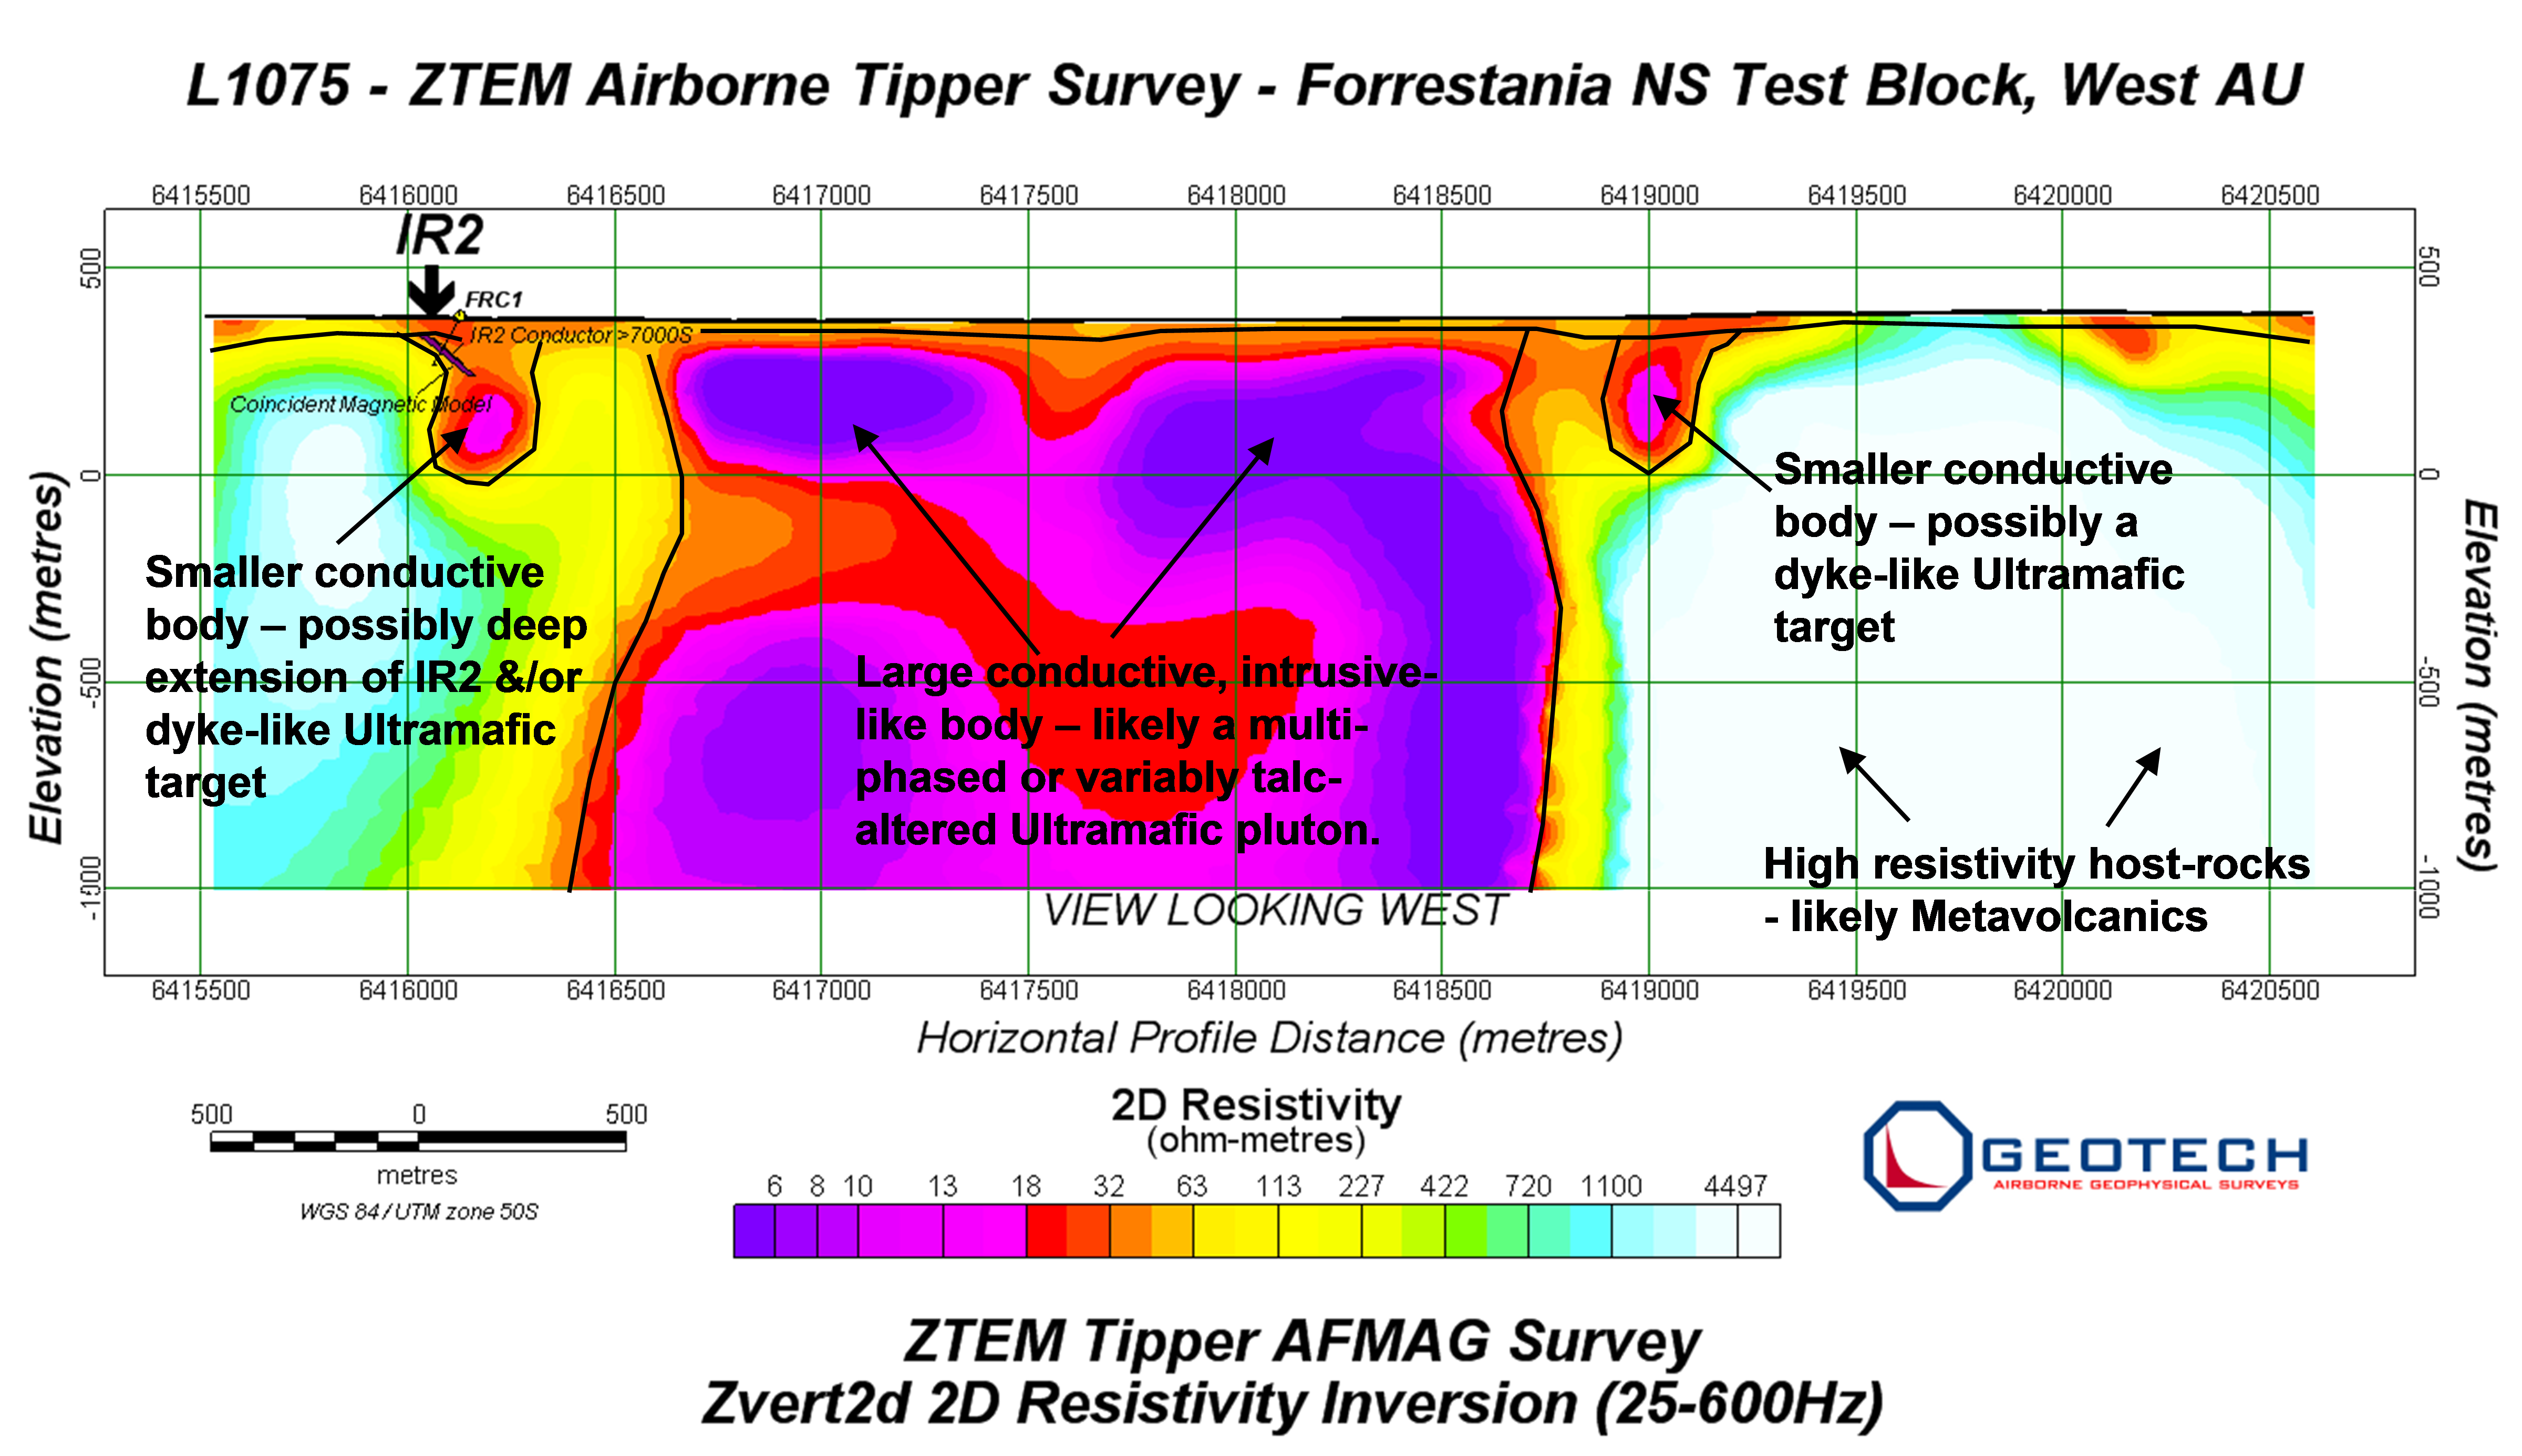
Figure 6: ZTEM™ 2D resistivity cross-section for north-south profile L1075 across IR2 conductor, using Zvert2d inversion of in-line tipper (X) component, In-Phase and Quadrature (25-600Hz) data.
Figures 7 and 8 give examples of 3D representation of the 2D inversion results across the IR2 and IR4 area of interest in the central part of the survey area. Figure 7a presents a series of north-south 2D inversions shown as vertical resistivity cross-sections using the 3D viewer in Oasis Montaj. They highlight the fact that the IR2 and IR4 showings lie along a laterally continuous, steeply south dipping, sinuously EW-linear conductive structure that lies south of the main magnetic and conductive intrusive center. Figure 7b presents a 3D Voxel (volume) obtained by gridding the 2D inversions in 3-dimensional space. As shown, the spatial relationship between the IR2 and IR4 dyke-like system and the main intrusive center is further highlighted by showing the -150m to -1000m depth level. In addition to the main IR2-IR4 conductive dyke system, another similar dyke system that lies north of the main conductive ultramafic intrusive is also defined in this 3D image.
Figure 8 presents an overhead plan view of the 2D inversion results, over the IR2-IR4 area of interest, shown in 3D Voxel form above the 75Hz In-phase DT and corresponding Analytic Signal, similar to that shown in Figure 5. These superimposed images demonstrate how well correlated both the DT lineaments and Analytic Signal are with the outline of the conductive ultramafic intrusive, as well as its inner layering/phases, based on the 2D inversion results.
Conclusion
The ZTEM™ results over the Forrestania Test area have defined a mix of concordant, north-southerly conductive axes that correlate with the regional geologic strike, as well as discordant NE, NW and east-westerly lineaments that likely correspond to cross-cutting fault-fracture zones, as well as possible mineralized and/or talc-altered ultramafic intrusives and dykes. Along with the magnetic evidence, these discordant ZTEM™ signatures appear to correlate with the ultramafic intrusive complex found in the central area of interest that also hosts the IR2 and IR4 massive sulphide showings. ZTEM™ conductive lineaments appear to define the intrusive contacts, as well as phases within the ultramafic itself and also thinner dyke-like conductive zones that relate to the mineralized showings. 2D ZTEM™ inversions results define anomalous conductive bodies that correlate, in part, with the known massive sulphide occurrences, but are much larger and extend to greater depth, which supports the presence of deeper, mineralized ultramafic intrusive root systems, similar to those observed in other magmatic nickel settings.
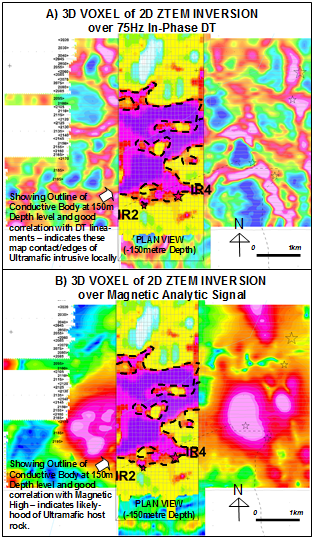
Figure 7: ZTEM™ 2D inversion results for north-south line segments over area of interest a) 2D resistivity cross-sections shown as 3D Grid views above 75Hz IP DT and b) 3D Voxel of 2D inversion results from -150m to 1km depth level.
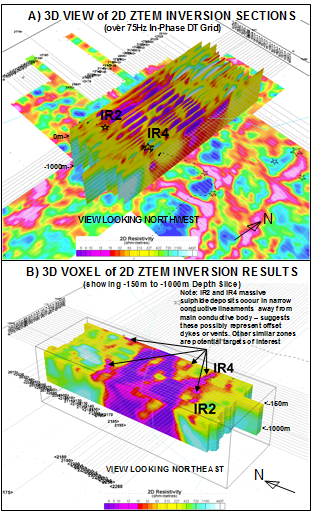
Figure 8: Plan view of ZTEM™ 2D inversion results compared to survey data a) 3D Voxel of 2D Resistivity over 75Hz In-Phase DT grid (left) and b) over Analytic Signal of TMI (right), showing interpreted geoelectric contrasts from 2D inversions at 150m depth level in the IR2-IR4 area of interest.
Of interest is the fact that similar ZTEM™ signatures have been obtained over other magmatic copper-nickel deposits, such as Axis Lake, northern Saskatchewan (Legault et al., 2009a) and particularly the Eagle’s Nest deposit in northwestern Ontario (see Figure 9-10) that contains an indicated resource of 6.9Mt at 3.6% Ni, 0.95% Cu, 1.3g/t PT (Greenough and Palmer, NI 43-101, 2010). Indeed a comparison of the Forrestania 2D inversion results, in Figures 6, with the ZTEM™ inversion over Eagle’s Nest of Figure 11, demonstrates a close resemblance between the deposit signatures over these two magmatic intrusive complexes, where small massive sulphide lenses, detected at surface using time-domain EM methods, occur above a much larger, more important conductive and variably mineralized ultramafic dyke system that extends to greater depth (Figure 10). Hence, this evidence suggests that deeper exploration potential exists at greater depth below IR2 at Forrestania, based on similar, favourable ZTEM™ survey and inversion results.
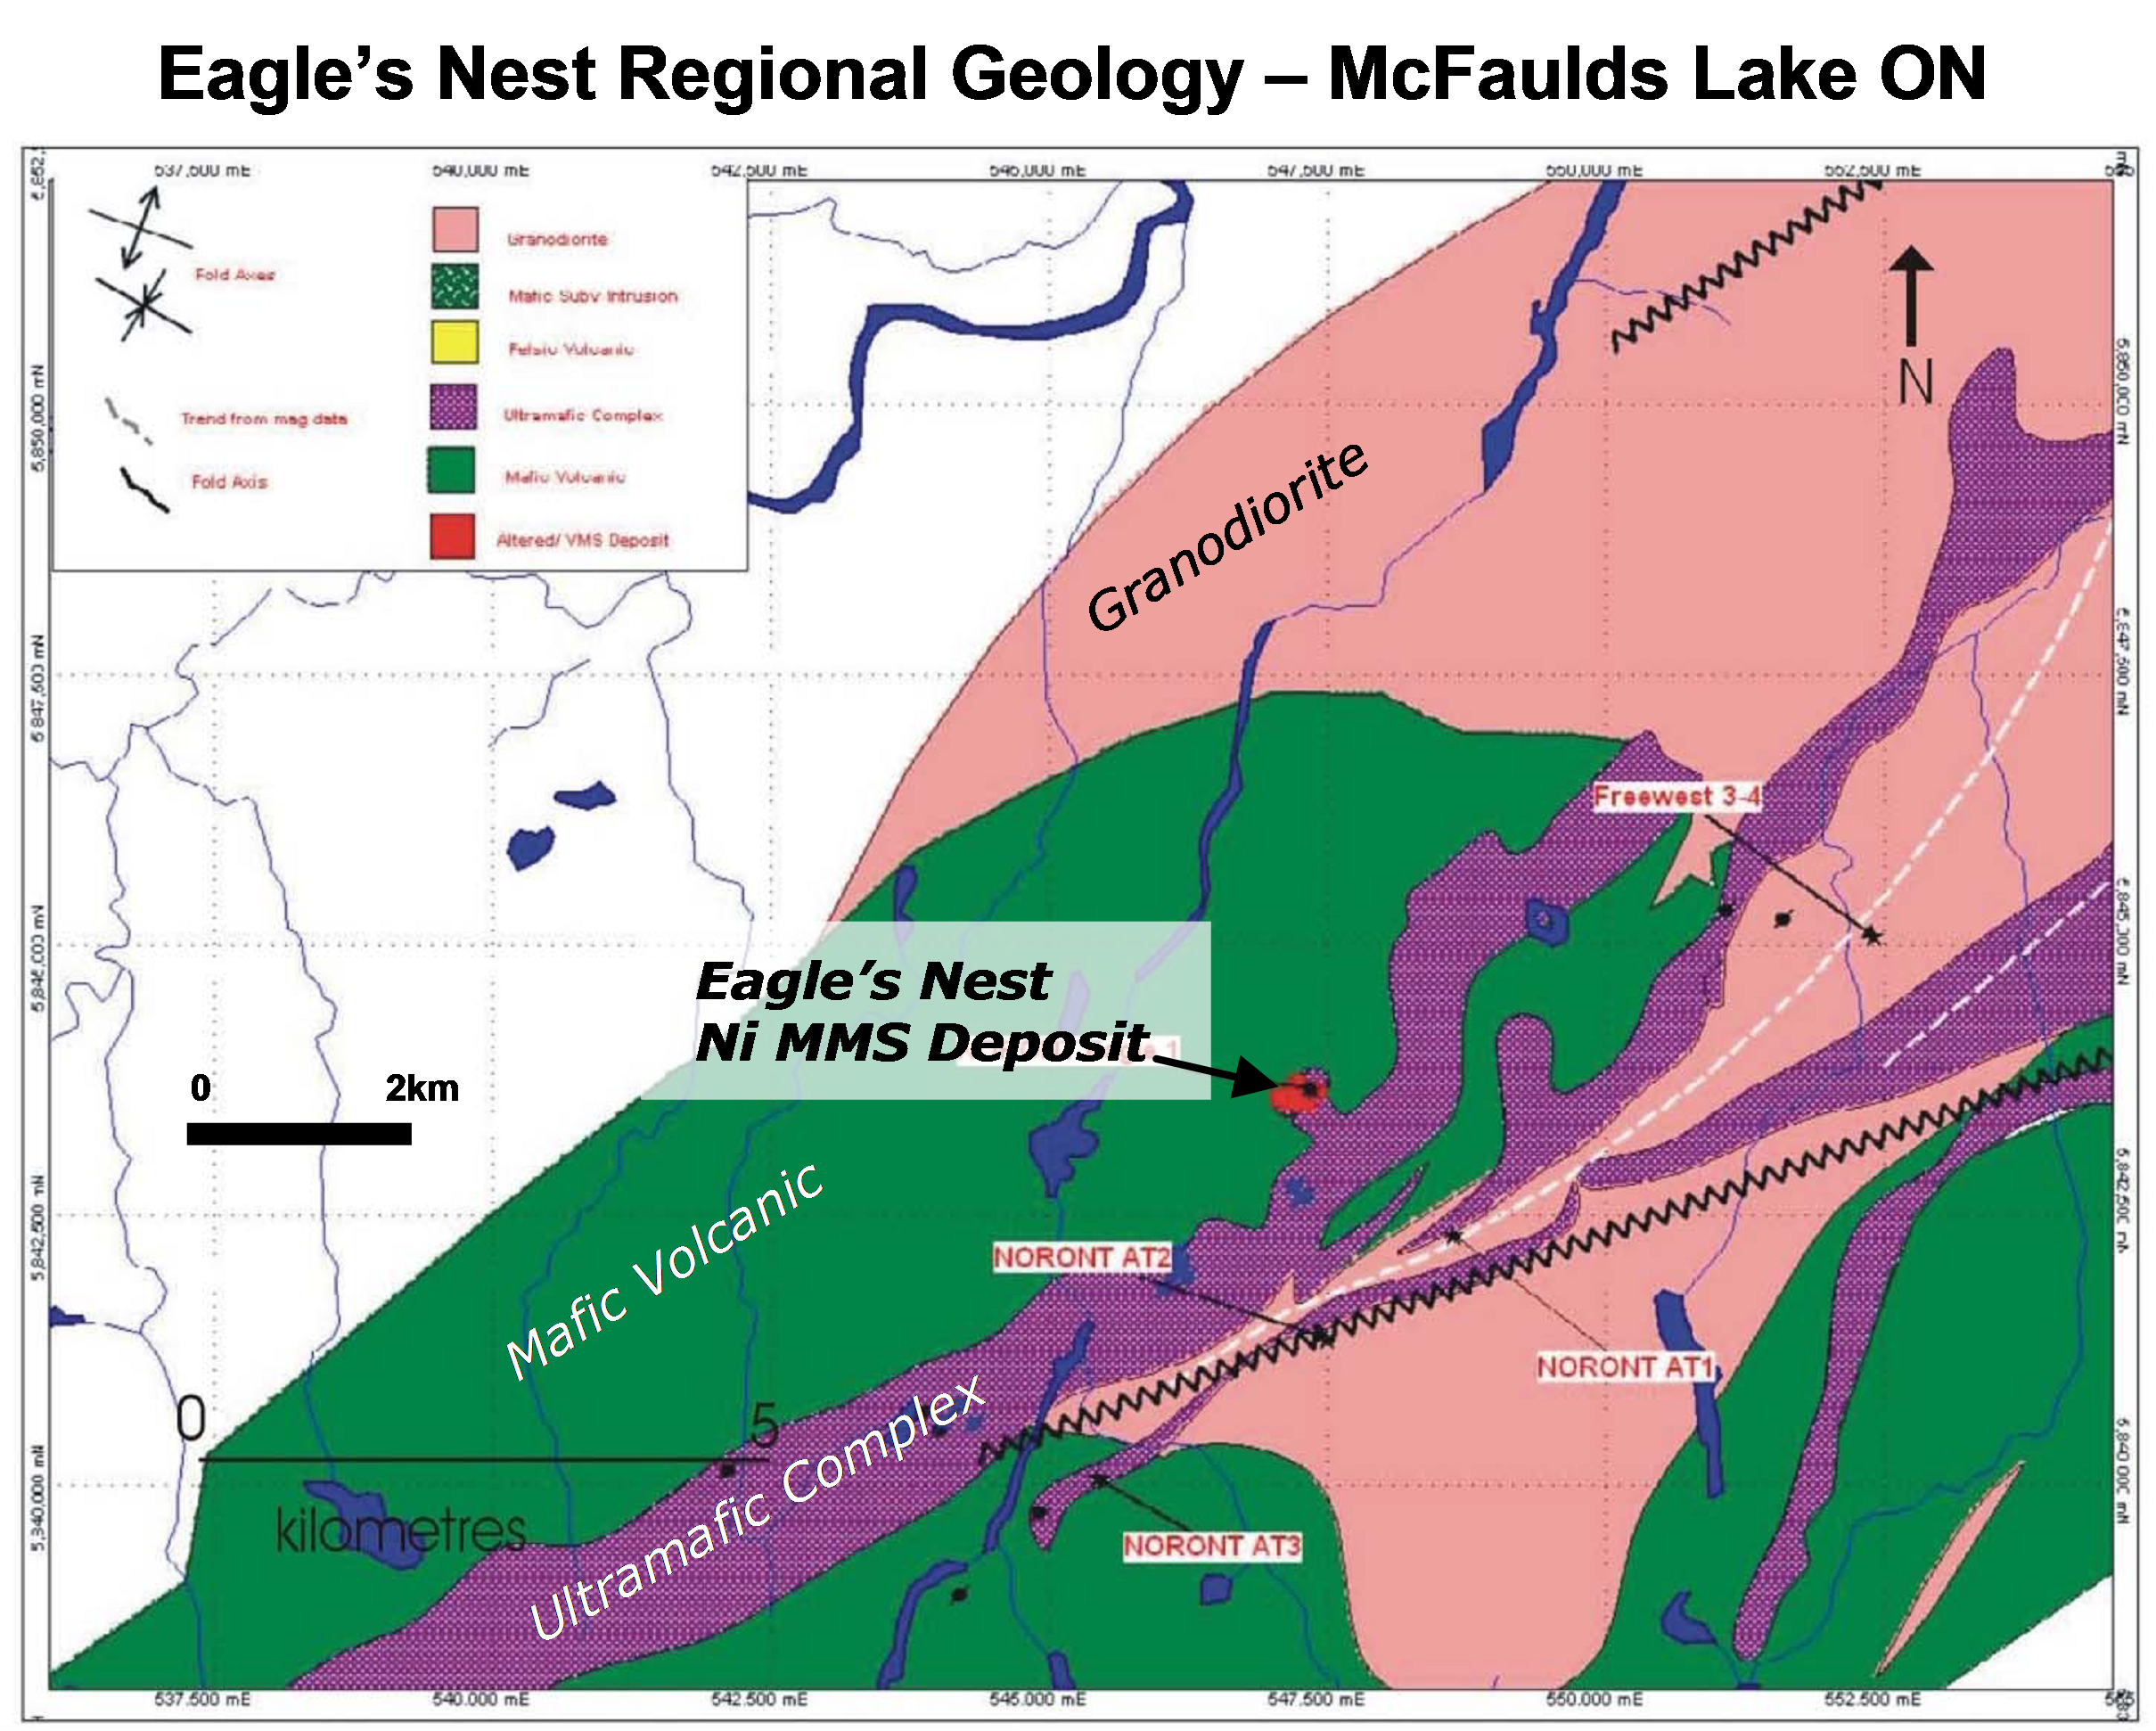
Figure 9: Eagle’s Nest magmatic nickel-cooper deposit, McFaulds Lake region, northwestern Ontario a) General geology (after Greenough and Palmer, 2010).
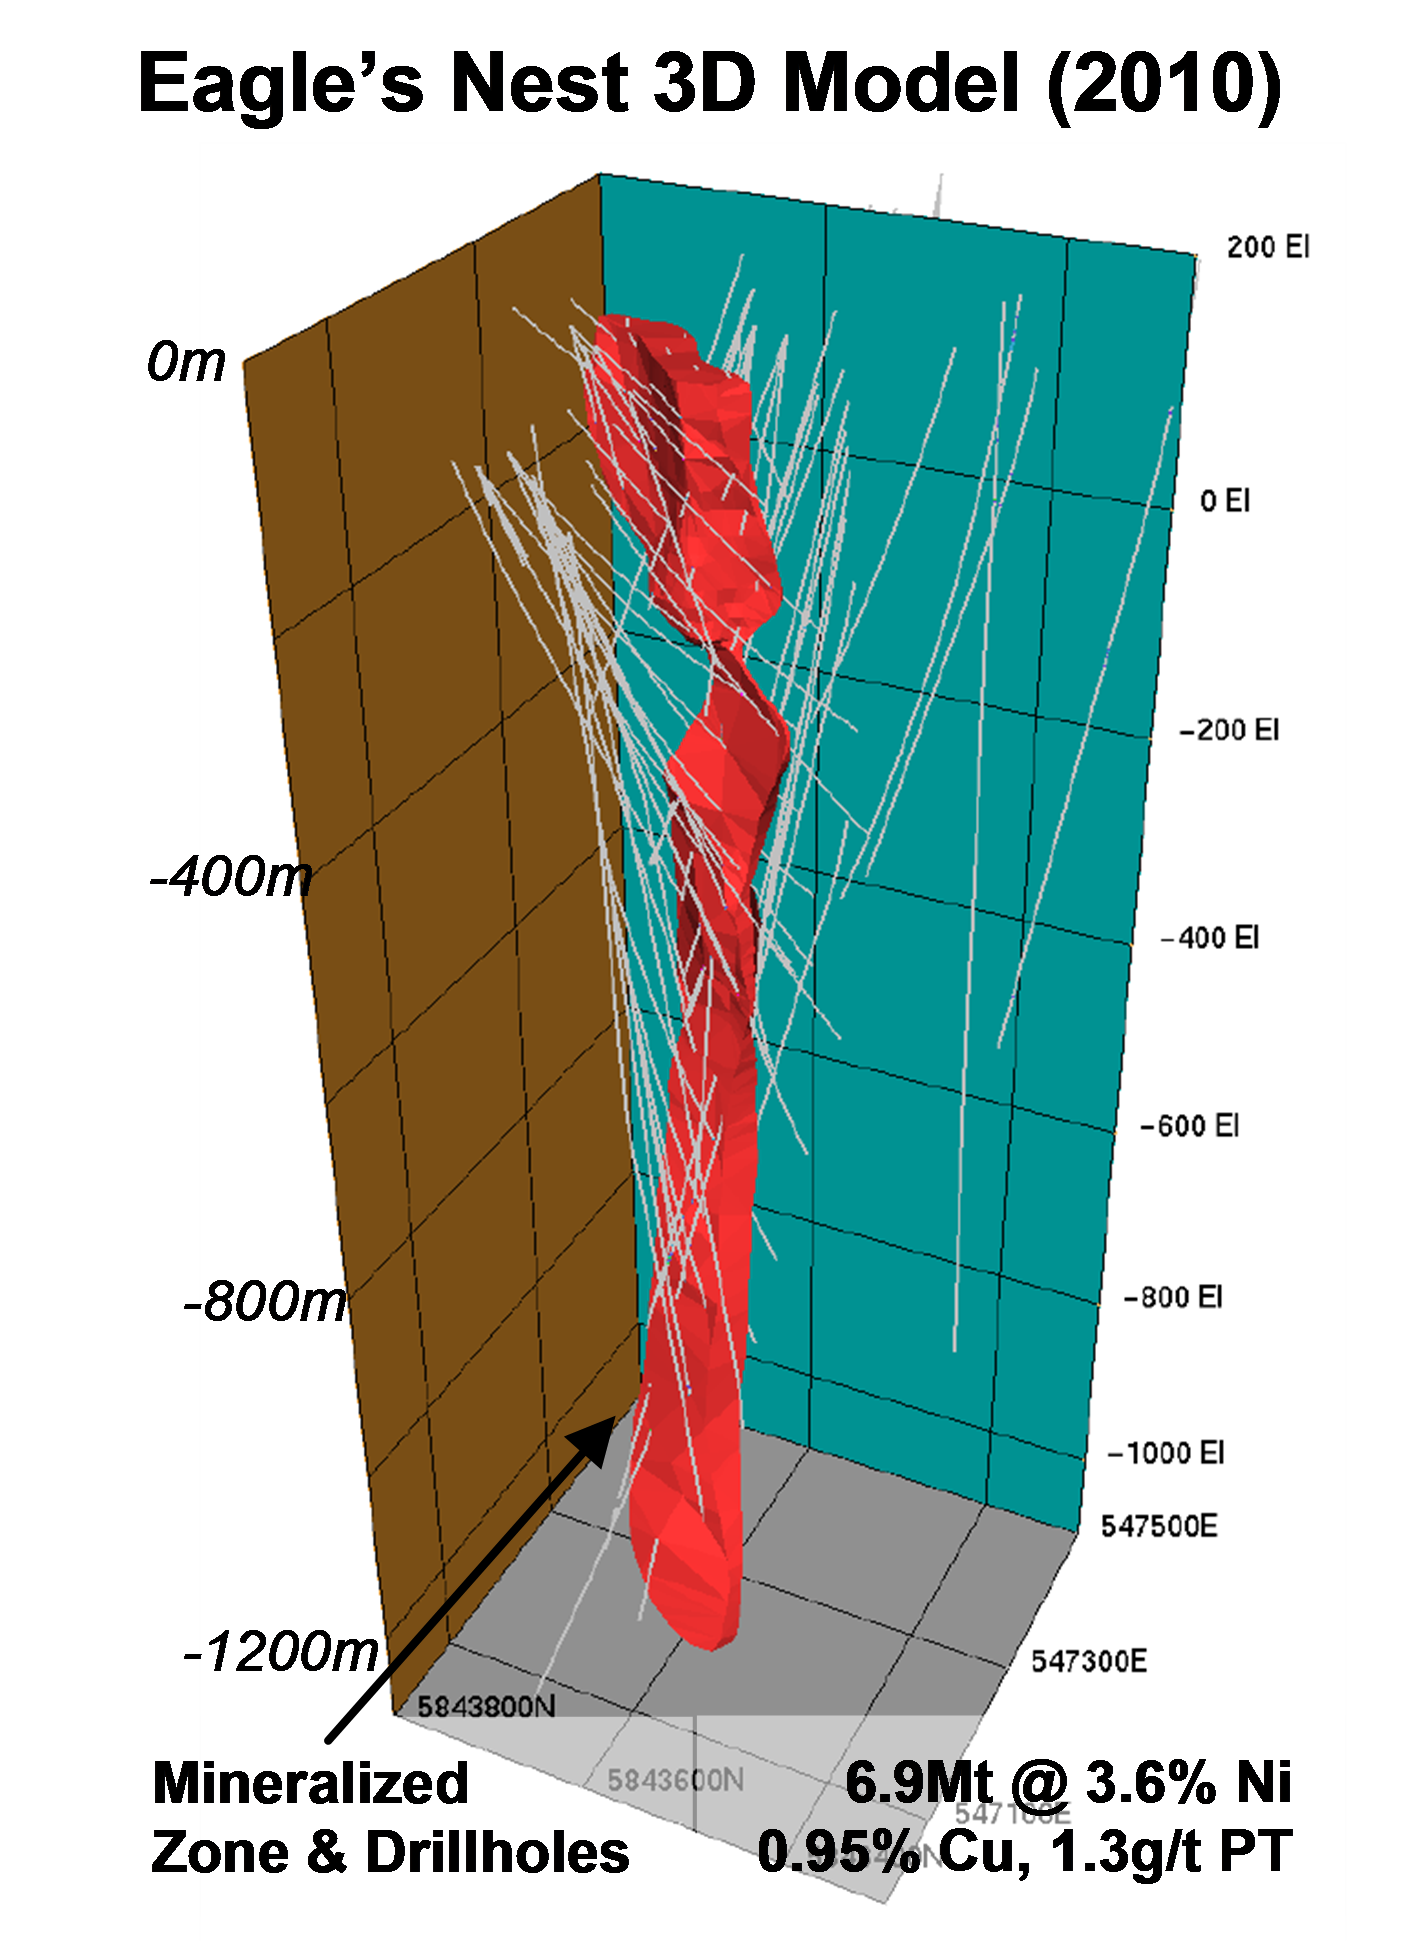
Figure 10: Eagle’s Nest 3D isometric view of mineralized zone and diamond drill-coverage, in 2010 (after Greenough and Palmer, 2010).
Acknowledgements
The authors wish to thank Geotech, Geotech Airborne and Noront Resources for allowing us to present these results. We also wish to thank Southern Geoscience Consultants for their assistance in this study.
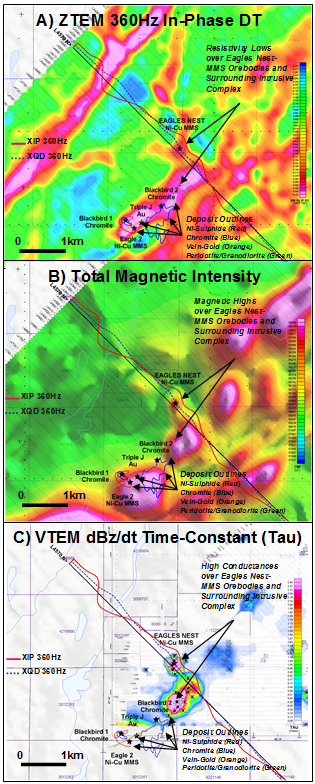
Figure 10: Helicopter EM results over Eagle’s Nest a) ZTEM™360Hz (shallow penetration) In-Phase Total Divergence (DT) image; b) Total magnetic intensity (TMI) shadowed image; c) VTEM dBZ/dt (late-channel) EM time-constant (Tau) image and EM anomaly picks, with selected ZTEM™ In-line (X) profile data and deposit outlines (courtesy Noront Resources Ltd.).
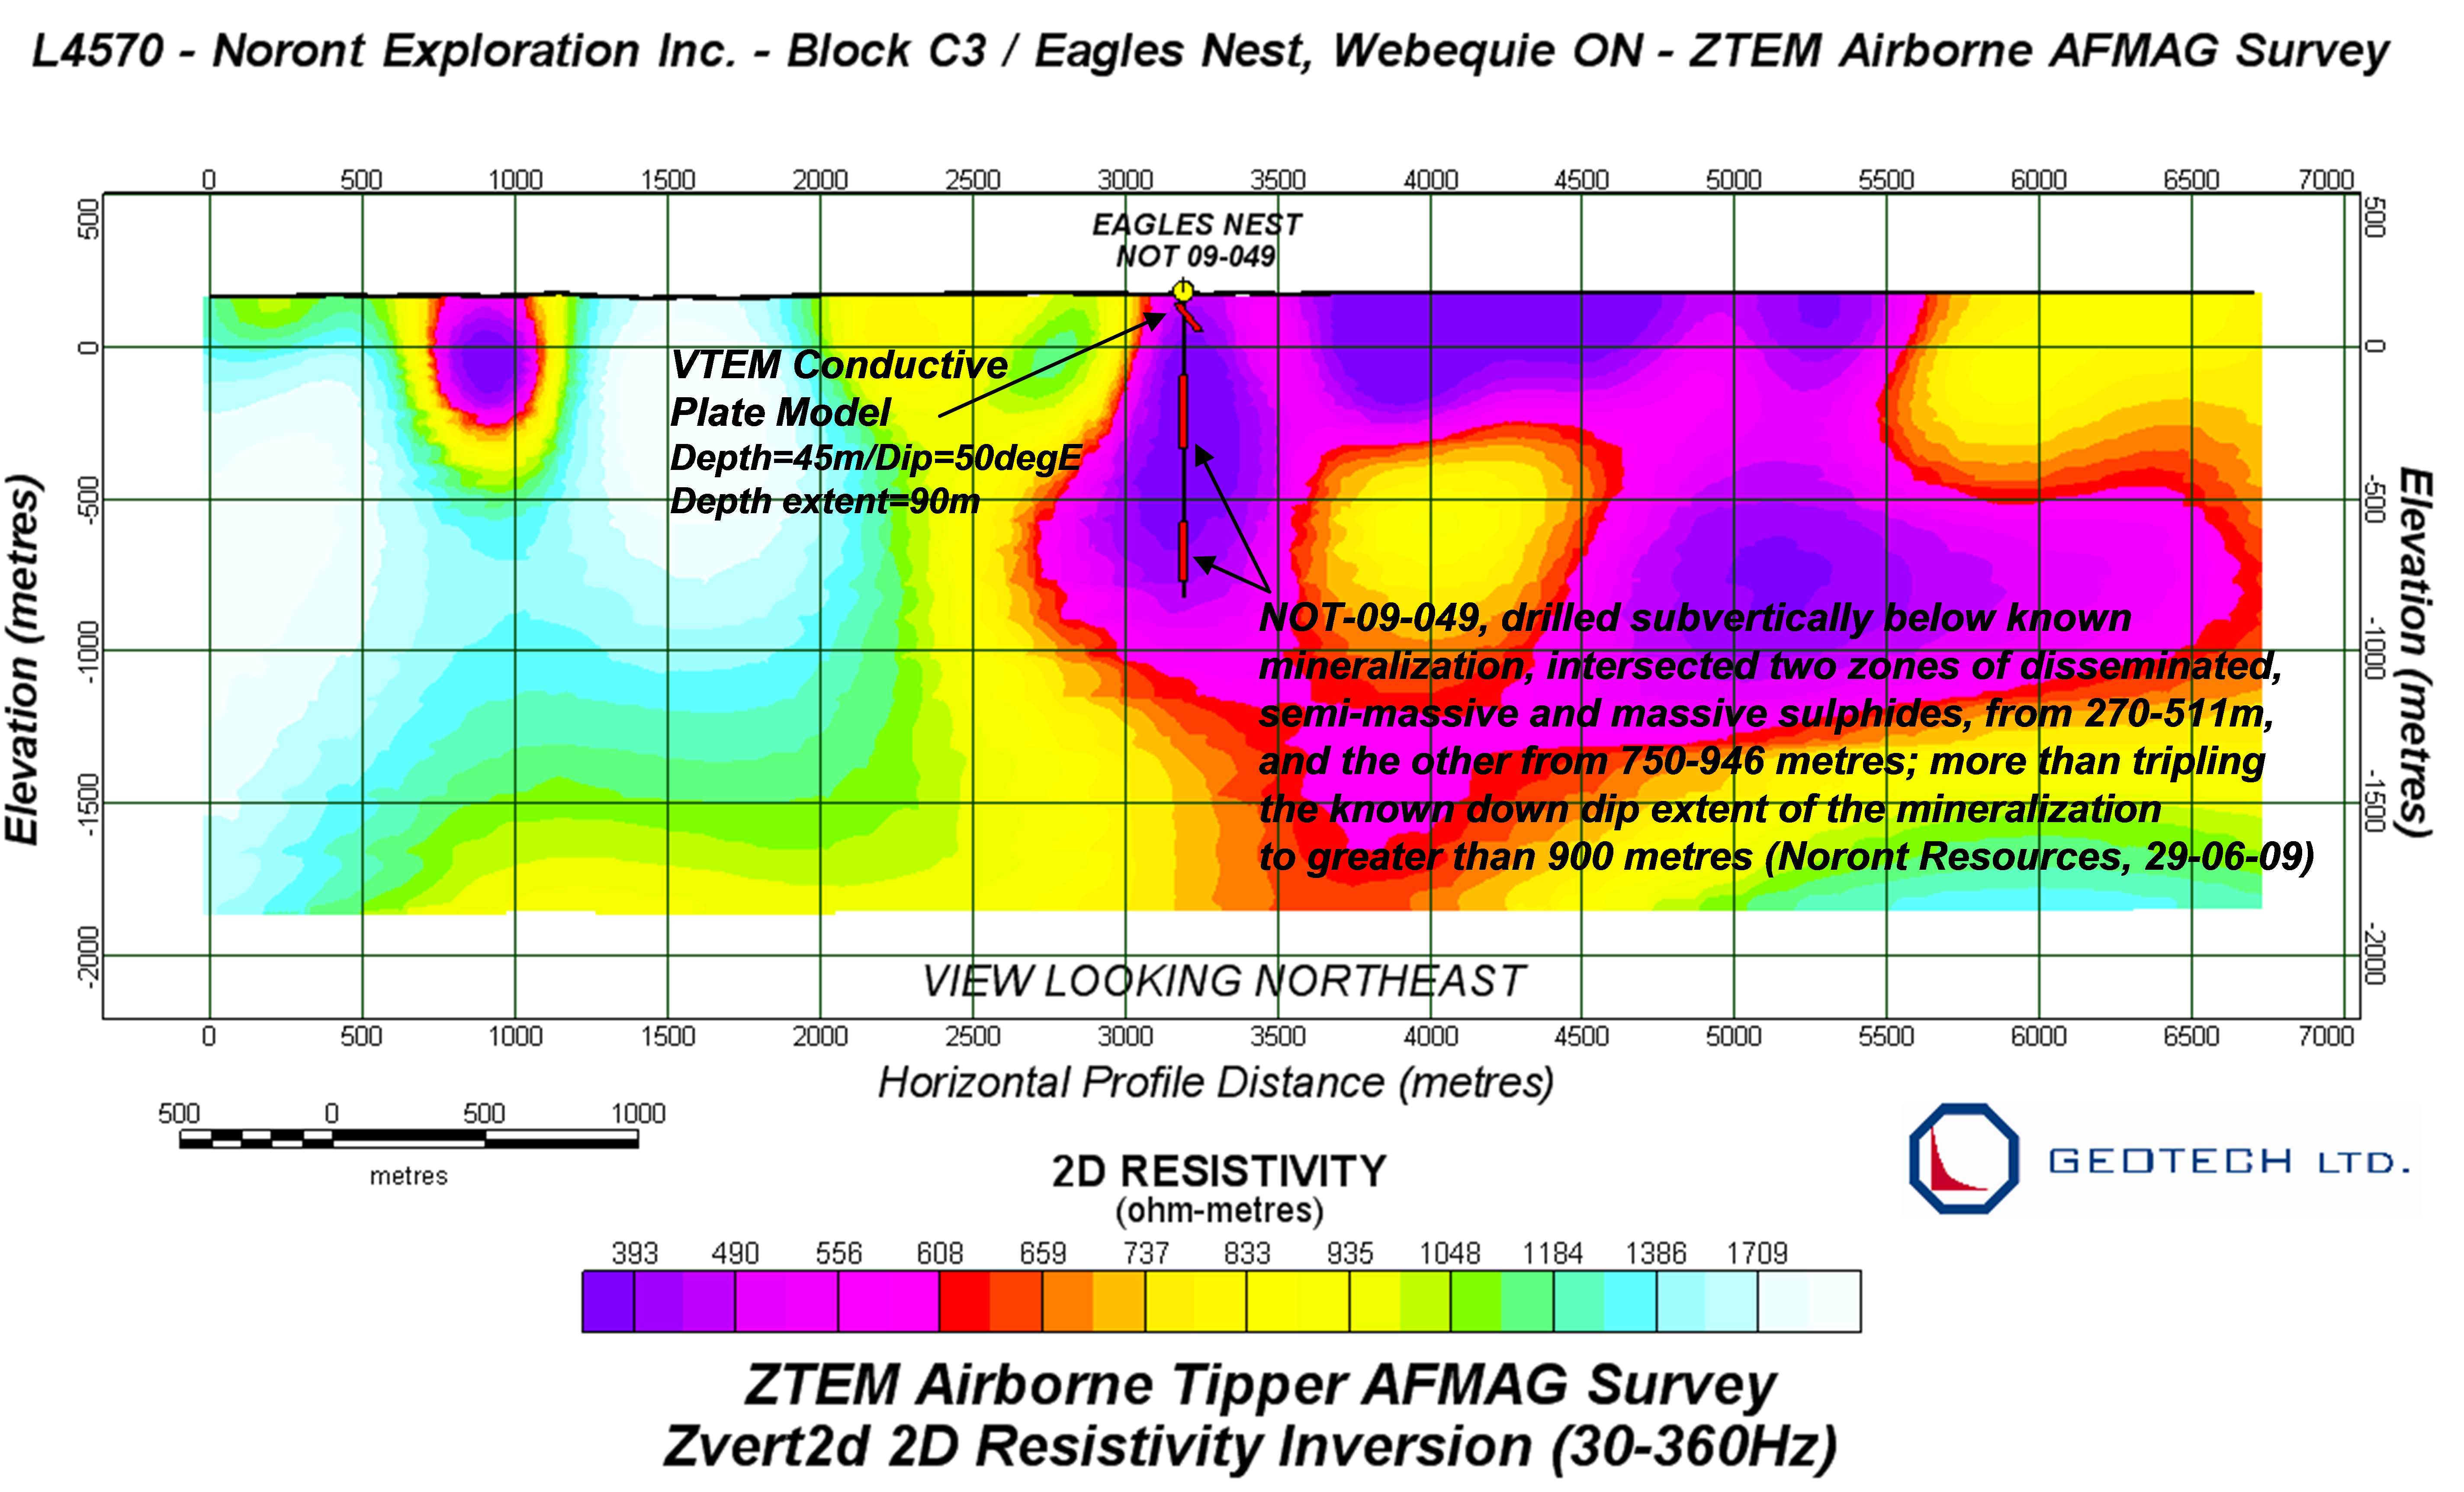
Figure 11: ZTEM™ 2D resistivity cross-section across L4570 over eagle’s Nest deposit, using Zvert2d inversion of in-lineReferences
References
De Lugao, P. P., & Wannamaker, P. E., 1996: Calculating the two-dimensional magnetotelluric Jacobian in finite elements using reciprocity: Geophysical Journal International, 127, 806–810.
Greenough, G., & Palmer, P., 2010. Technical report and resource estimate: McFaulds Lake Project, James Bay Lowlands, Ontario, Canada, NI 43-101 report by Golder Associates for Noront Resources Ltd., 241 p.
Labson, V. F., Becker, A., Morrison, H. F., & Conti, U. 1985. Geophysical exploration with audio-frequency natural magnetic fields: Geophysics, 50, 656–664.
Legault, J.M., Kumar, H., Milicevic, B., & Hulbert, L., 2009a ZTEM airborne tipper AFMAG test survey over a magmatic copper-nickel target at Axis Lake in northern Saskatchewan, SEG Expanded Abstracts, 28, 1272-1276.
Legault, J.M., Kumar, H., Milicevic, B. & Wannamaker, P., 2009b ZTEM tipper AFMAG and 2D inversion results over an unconformity uranium target in northern Saskatchewan, SEG Expanded Abstracts, 28, 1277-1281.
Lintern, M.J., 2004. Bounty Gold Deposit, Forrestania Greenstone Belt, Western Australia, CRC LEME, 3 p., http://crcleme.org.au.
Lo, B., & Zang, M., 2008. Numerical modeling of ZTEM (airborne AFMAG) responses to guide exploration strategies, SEG Expanded Abstracts, 27, 1098–1101.
Lo, B., Legault, J. M., Kuzmin, P., & Combrinck, M., 2009. ZTEM (Airborne AFMAG) tests over unconformity uranium deposits: 20TH ASEG International Geophysical Conference and Exhibition, Australian Society of Exploration Geophysicists, Extended Abstracts, 4p.
Pedersen, L.B., 1998. Tensor VLF measurements: Our first experiences, Exploration Geophysics, 29, 52-57.
Porter, D.J., & Mckay, K.G., 1981. The nickel sulfide mineralization and metamorphic setting of the Forrestania area, Western Australia, Economic Geology, 76, 1524-1549.
Tarantola, A., 1987. Inverse problem theory, Elsevier, New York, 613 pp.
Wannamaker, P. E., Stodt, J. A., and Rijo, L., 1987. A stable finite element solution for two dimensional magnetotelluric modeling: Geophy. J. Roy. Astr. Soc., 88, 277-296.
Ward, S. H., 1959, AFMAG: Airborne and ground: Geophysics, 24, 761–787.
Witherly, K., & Irvine, R., 2006. The VTEM airborne electromagnetic system – benchmarking continuous improvement via repeat surveys over time, SEG Expanded Abstracts, 25, 1273-1277
Witherly, K., Irvine, R., & Morrison, E.B., 2004. The Geotech VTEM time domain helicopter EM system, SEG Expanded Abstracts, 23, 1217-1221.