Presented at ASEG 2013, SEG 2013, KEGS 2013 and SAGA-AEM 2013
For a PDF of this paper click here
Summary
Heli-borne AeroTEM, VTEM and ZTEM surveys were flown over the 501 zone in the McFauld’s Lake area, northern Ontario. The 501 zone is a relatively small VMS deposit that appears to respond well to all three active and passive airborne EM systems that have surveyed the property. This aspect is explored further in this case-study using comparisons between these data sets and the geology, which are showcased using 1D-2D-3D EM inversion modeling.
Key Words: Airborne, EM, AFMAG, Inversion, VMS
Introduction
The 501 project, belonging to joint-venture partners Metalex Ventures Ltd. and White Pine Resources Ltd. is a high grade Zn-Cu-Pb-Ag mineralized, Mattagami-Noranda style volcanogenic massive sulphide (VMS) deposit that is situated in the northern extension of the Ring of Fire region of McFauld’s Lake, northern Ontario (Figure 1a). It hosts significant intersections of massive and semi-massive sulphide which have been delineated over a 200m NS strike length and to a vertical depth of 275m from surface.
The 501 zone was discovered and announced in 2008 (www.whitepineresources.ca) following drilling of AeroTEM airborne time-domain electromagnetic and follow-up ground magnetic and horizontal loop HLEM survey program in 2007. In fall 2008, as part of a larger, more regional survey, the deposit and surrounding area was flown with the VTEM helicopter time-domain EM system. And in summer 2009, the area was flown with the ZTEM helicopter passive EM system. The objectives of the VTEM survey was to provide greater depth of investigation, below the conductive alluvial and sedimentary cover, and for the ZTEM survey to provide indications of possible extensions of mineralized zones at depth.
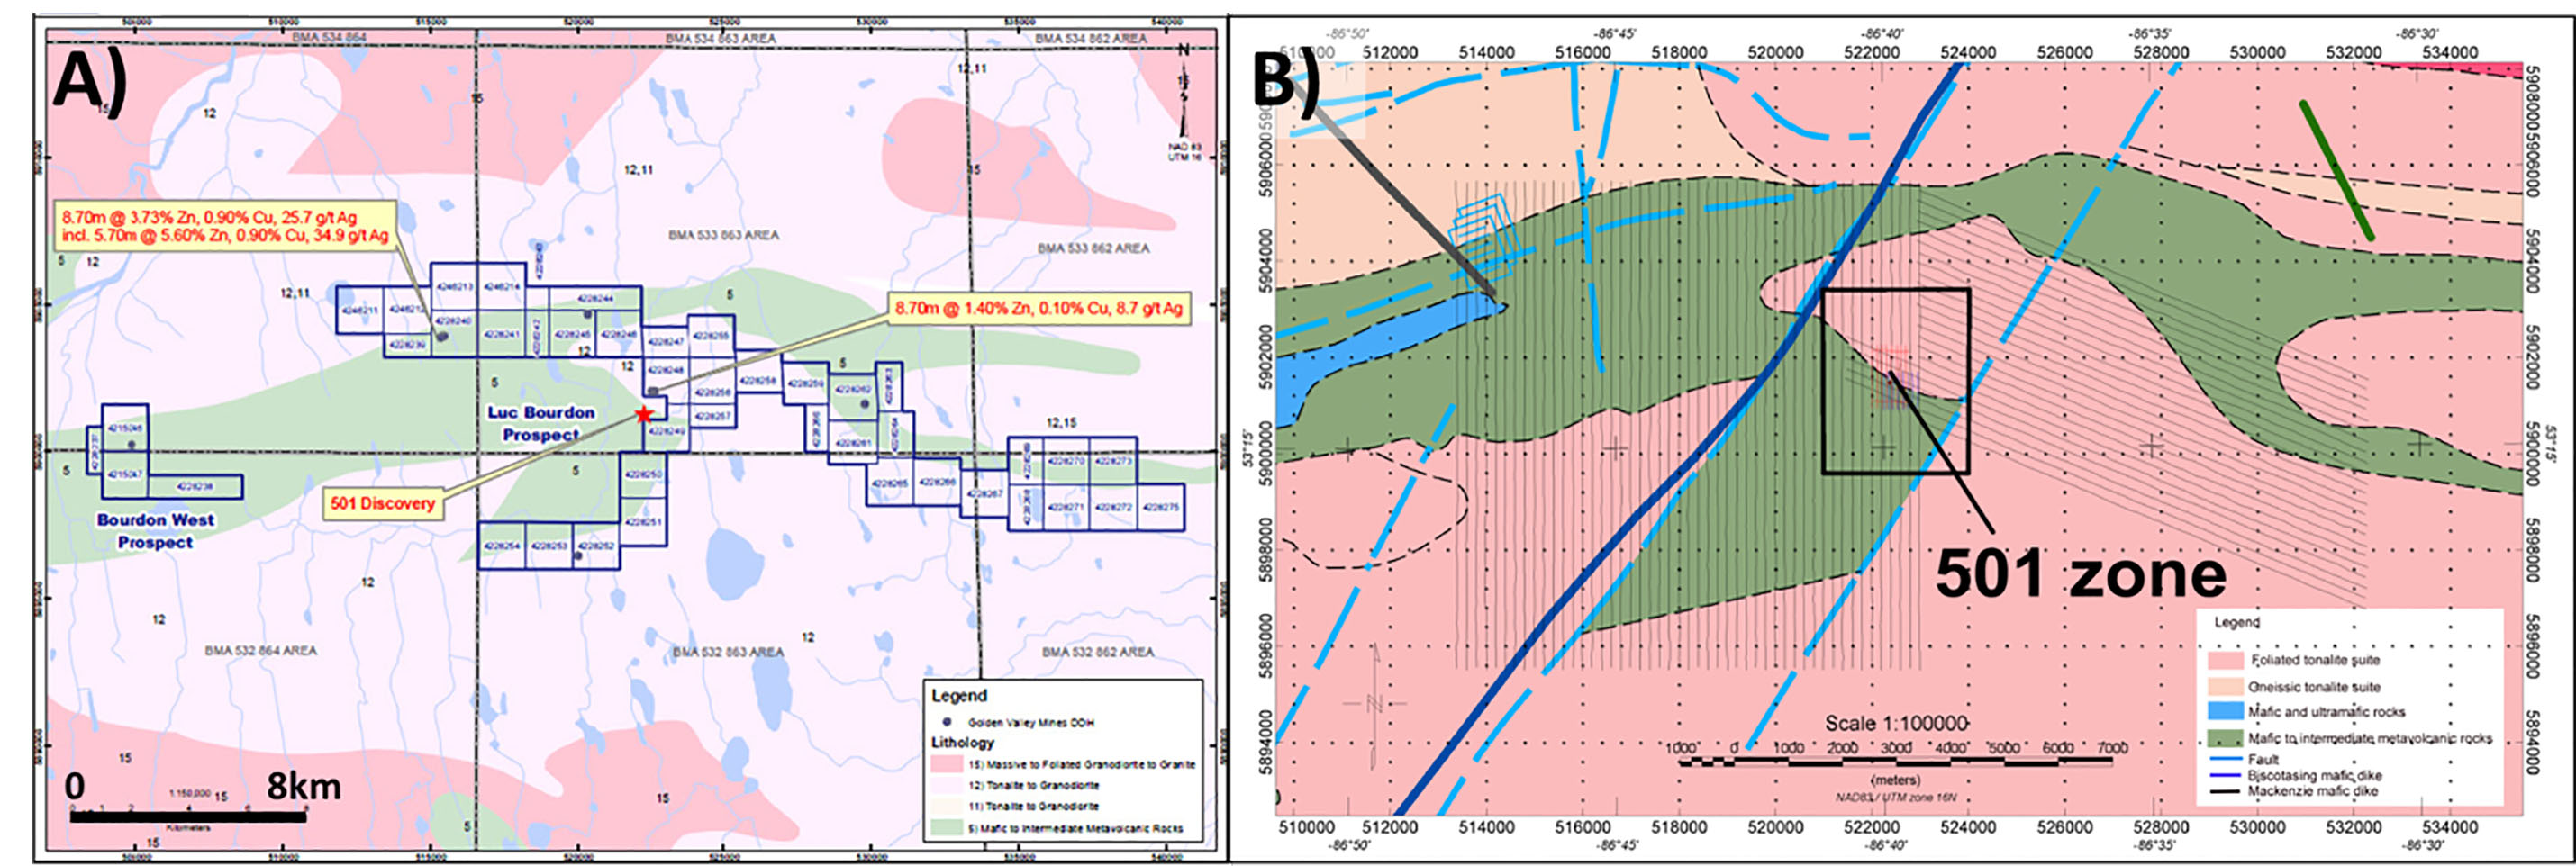
Figure 1: A) Location of the 501 zone in the “Ring of Fire” region of McFauld’s Lake, northern Ontario, overlaying regional geology (after Lahti et al., 2010); B) Flight path of airborne surveys overlain onto bedrock geology and highlighting detailed area surrounding the 501 zone (after Ontario Geological Survey, 2006).
Airborne EM methods, both passive and active, are known to be very useful tools for copper exploration – albeit, respectively, for disseminated copper porphyries and Cu-bearing volcanogenic & magmatic massive sulphide deposits. Although, in exploration settings, it is rare but not uncommon for two AEM systems to be flown over the same property, it is even more rate for a passive and also two different active AEM surveys to be flown over the same property, yet this is the case for 501 Zone.
Several joint ZTEM-VTEM test case studies for massive sulphides have already been presented, notably the Axis Lake (Legault et al., 2009), Eagle’s Nest (Legault et al, 2010), Nebo-Babel (Legault et al., 2012), and Mayville (Orta et al., 2012) magmatic Cu-Ni deposits. However, in nearly all instances these have all been relatively large/long strike-length orebodies, which are well-suited to ZTEM’s large footprint and large depth of penetration. Smaller massive sulphide (MS) deposits, such as East Bull Lake (Legault et al., 2011) and Forrestania (Sattel et al., 2010), have not responded as well to ZTEM, as noted by Smith, (2012).
However, the 501 zone is a relatively small VMS deposit that appears to respond well to all three active and passive airborne EM systems that have surveyed the property. As a result, this aspect is explored further in this case-study.
Property Geology
The 501 zone survey area lies within the Precambrian rocks of the Superior province, Neo-to-Meso-Archean (Ontario Geological Survey, 2006). In general, the geology is poorly known due to extensive swamps and deep overburden (10 to 20 m deep) that severely limit any outcrop exposure. Figure 1b shows the locations of recent airborne surveys over the bedrock geology map. The 501 zone occurs along a NW-SE trending geologic contact between steeply dipping, foliated tonalite intrusive rocks to the north and mafic to intermediate metavolcanics to the south.
The 501 zone massive sulphide lense dips steeply at 75 degrees to the east and has a steep 65 degree plunge to the south. Horizontal widths of the mineralized zone can reach up to 22m. Drill intersections average 7.6% Zn, 0.35% Cu, 0.26 Pb and 4.6 g/t Ag (www.whitepine resources.ca).
Airborne Geophysical Surveys
During January-February, 2008, Billiken Management Services Inc., on behalf of Metalex Ventures Ltd. and other partners contracted Aeroquest Ltd to fly AeroTEM time- domain helicopter EM (Balch et al, 2002; Huang and Rudd, 2008) survey over multiple blocks that included the 501 zone. A few months later between June-August, 2008, Geotech Ltd was contracted to fly VTEM (versatile time-domain electromagnetic; Witherly et al., 2004; Prikhodko et al., 2010) survey also over multi blocks, including the 501 zone. This was subsequently followed by a ZTEM (z-axis tipper electromagnetic; Lo and Zang, 2008) helicopter AFMAG (Ward, 1959; Labson et al., 1985) survey in August, 2009.
The objectives of the VTEM survey was to provide greater depth of investigation, below the conductive alluvial and sedimentary cover, than the previous AeroTEM survey and for the ZTEM survey to provide indications of possible extensions of mineralized zones at depth.
Aeromagnetic Survey Results
Figure 2 presents a color-shadow image of the total magnetic intensity (TMI) from the ZTEM survey, with flight paths of the three survey coverages. Lithologies, geologic contacts and NW to NW trending structures are highlighted in these images. The 501 zone occurs along the south contact between higher magnetic susceptibility rocks (mafic-intermediate volcanics) and a prominent region of lower magnetic susceptibility, mapped as felsic intrusives, to the north (see Fig. 1). The 501 VMS is highlighted as a magnetic high anomaly centred in the detailed survey area and is aligned along a NS to NNE trending magnetic lineament. The peak magnetic high of about 800nT over the magnetic background is attributed to the presence of magnetite mineralization in the VMS orebody.
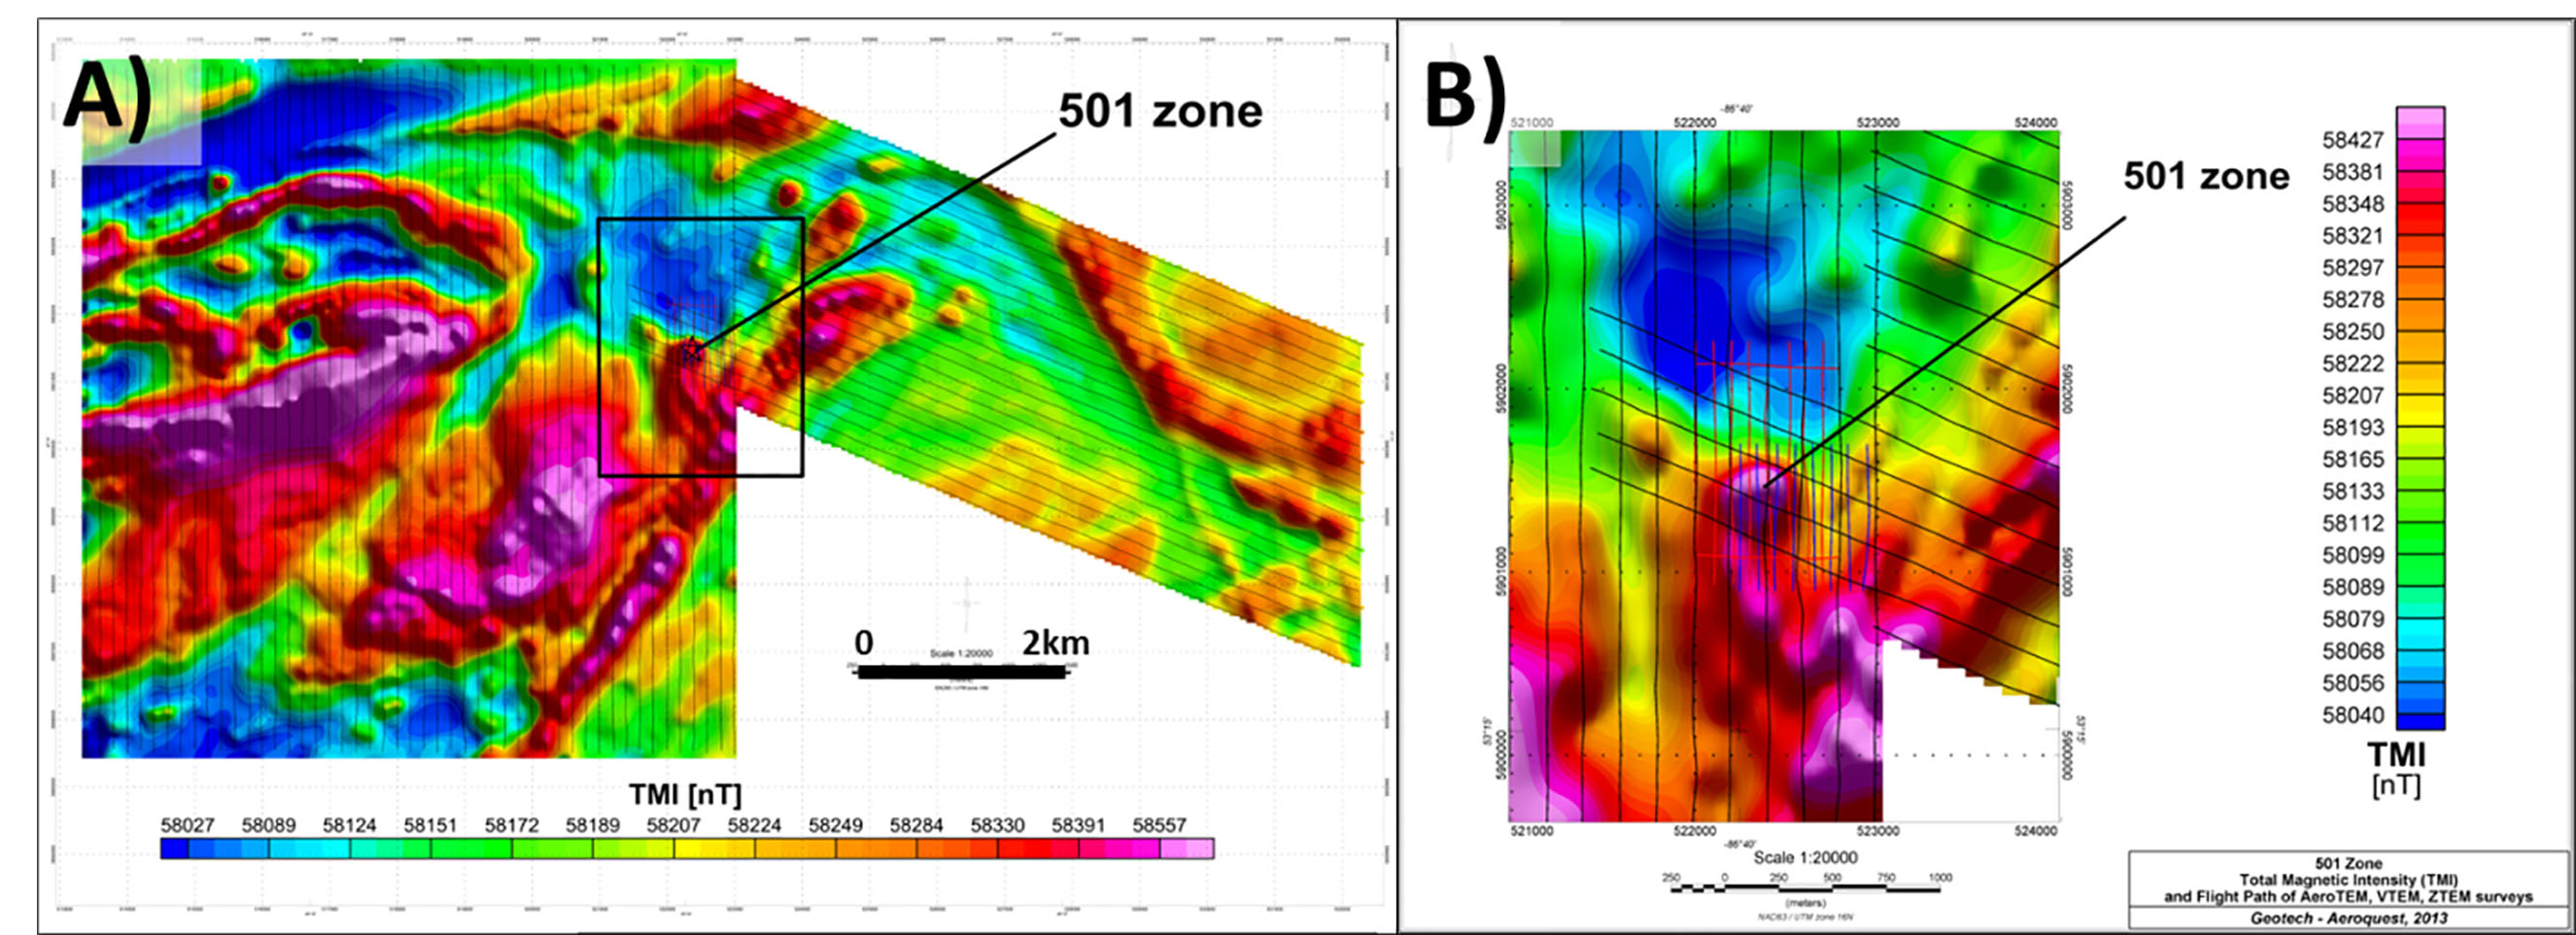
Figure 2: A) Color-shadow image of TMI over the survey area, highlighting the detailed area surrounding the 501 mineralized zone; B) Detailed view of color-shadow TMI image, showing AeroTEM (red), VTEM (blue) and ZTEM (black) flight paths over the 501 mineralized zone.
AeroTEM Survey Results
The 2008 AeroTEM III survey consisted of 4102 line-km over multiple blocks, including 11 km over the 501 zone claim block, shown in Figures 2b and 3a. The survey was flown along 100m spaced NS lines, with EM and magnetic sensors at 26m and 50m average elevation AGL, respectively, using a 90Hz base-repetition rate.
The AeroTEM Time-constant (Tau) image and contours of the calculated vertical magnetic gradient (CVG) over the 501 zone are presented in Figure 3a (top). The EM Time-constant (Tau) was obtained from the Z-coil, off-time dB/dt response. The “sliding Tau” method that was used calculates the slope of the EM decay at the latest possible time-channels above the chosen EM noise threshold level (I. Johnson, pers. comm., 2008). The Tau image clearly identifies the 501 zone response in Figure 3b (top).
The RDI resistivity depth imaging technique is used to rapidly convert AeroTEM vertical component EM decay profile data into equivalent resistivity versus depth cross-sections. The RDI algorithm for resistivity-depth transformation is based on the apparent resistivity transform of Meju (1998) and the TEM response from conductive half-space. The RDI transform is depth calibrated based on forward plate modeling for AEM system configurations (A. Prikhodko, pers. comm., 2009).
Figure 3a (bottom) represents the RDI for AeroTEM line L20360 directly over the 501 zone, highlighting the top of the anomaly at 85 metres depth, reaching a 7 ohm-m minimum resistivity, with an estimated depth of investigation of approx. 120m within the zone.
MaxwellTM (Electromagnetic Imaging Technology, Midland, WA, Australia) computes the EM response of conductive 2.5D plates in free-space and was used for modeling the EM anomalies of interest. Figure 4a presents the results of EM plate modeling for the AeroTEM response along L20360 that intersects the mineralized 501 zone. A south-dipping, 150x150m conductive plate is modeled at 85m depth with a conductance of 38 Siemens.
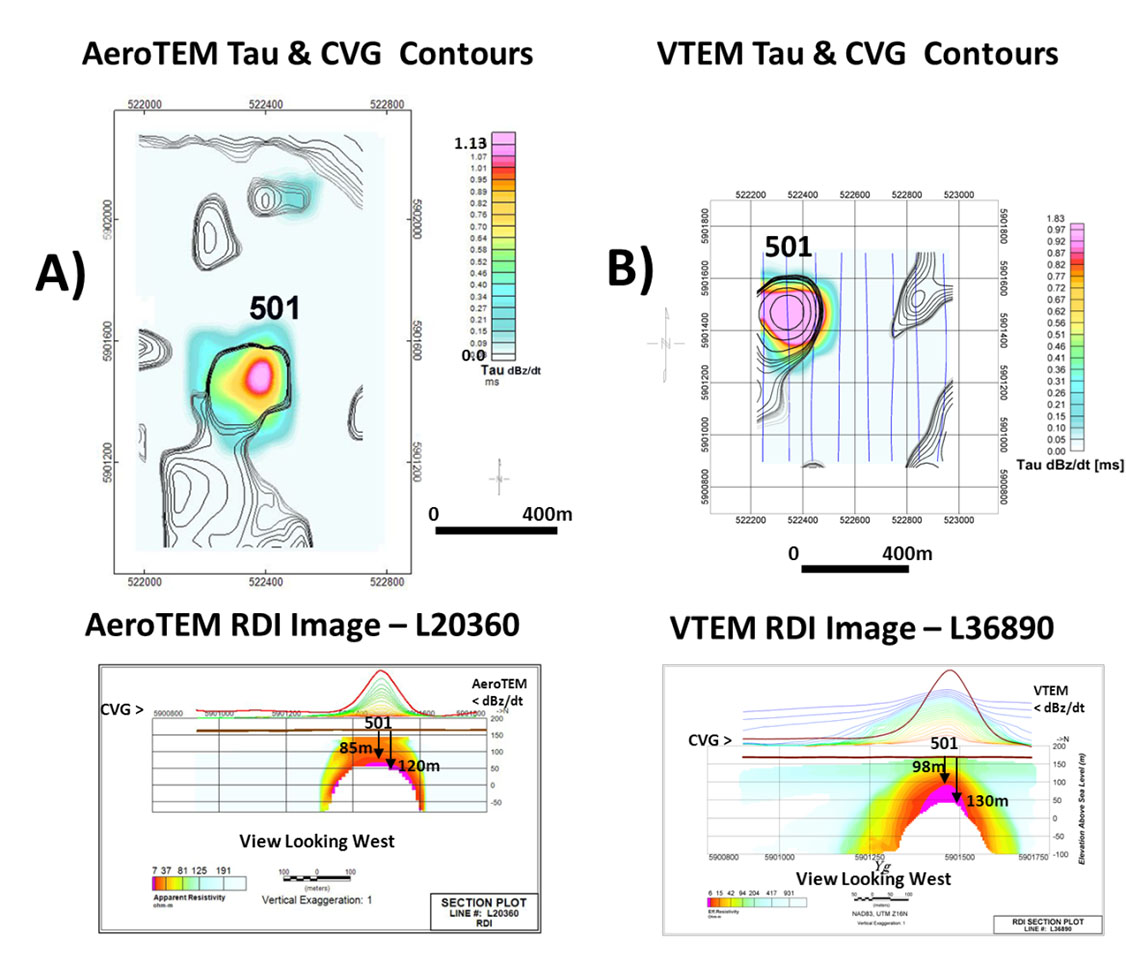
Figure 3: A) AeroTEM results over the 501 zone: above) Tau image and CVG contours; below) Resistivity-depth image for L20360; B) VTEM results over the 501 zone: above) Tau image and CVG contours; below) Resistivity-depth image for L36890.
VTEM Survey Results
The 2008 VTEM survey consisted of 801 line-km over multiple blocks, including 7 km over the 501 zone claim block, shown in Figures 2b and 3b. VTEM was flown along 100m spaced traverse lines and 1km spaced tie-lines, oriented in different direction to meet geological specifications of the survey area. EM and magnetic sensors were positioned at 42m and 57m mean elevation AGL, respectively. The VTEM survey measured off-time data in the 0.12-6.58msec range, using a 30Hz base-repetition rate.
The VTEM Time-constant (Tau) image for the off-time dBz/dt response and contours of the calculated vertical magnetic gradient (CVG) over the 501 zone are presented in Figure 3b (top). Over the 501 zone, the low values of Tau (1.9ms on L36890) are consistent with a mod-weakly mineralized conductor closer to surface. Figure 3b (bottom) represents the RDI of VTEM line L36890 highlighting the top of the anomaly at 98 metres depth, reaching a 6 ohm-m minimum resistivity, and an estimated depth of investigation of 130m below the 501 zone.
Maxwell EM plate modeling for the VTEM response along L36890 over the 501 zone (Fig. 4b) gives a south-dipping, 150x150m conductive plate at 98m depth, with a conductance of 150 Siemens – slightly deeper than the AeroTEM model and with 4x greater conductance. This is attributed to the lower base-repetition rate (30 vs. 90Hz), the longer on-time pulse length (7.5 vs. 1.83ms) and pulse shape (trapezoidal vs. triangular) of VTEM relative to AeroTEM, according to the Liu factor (Liu, 1998).
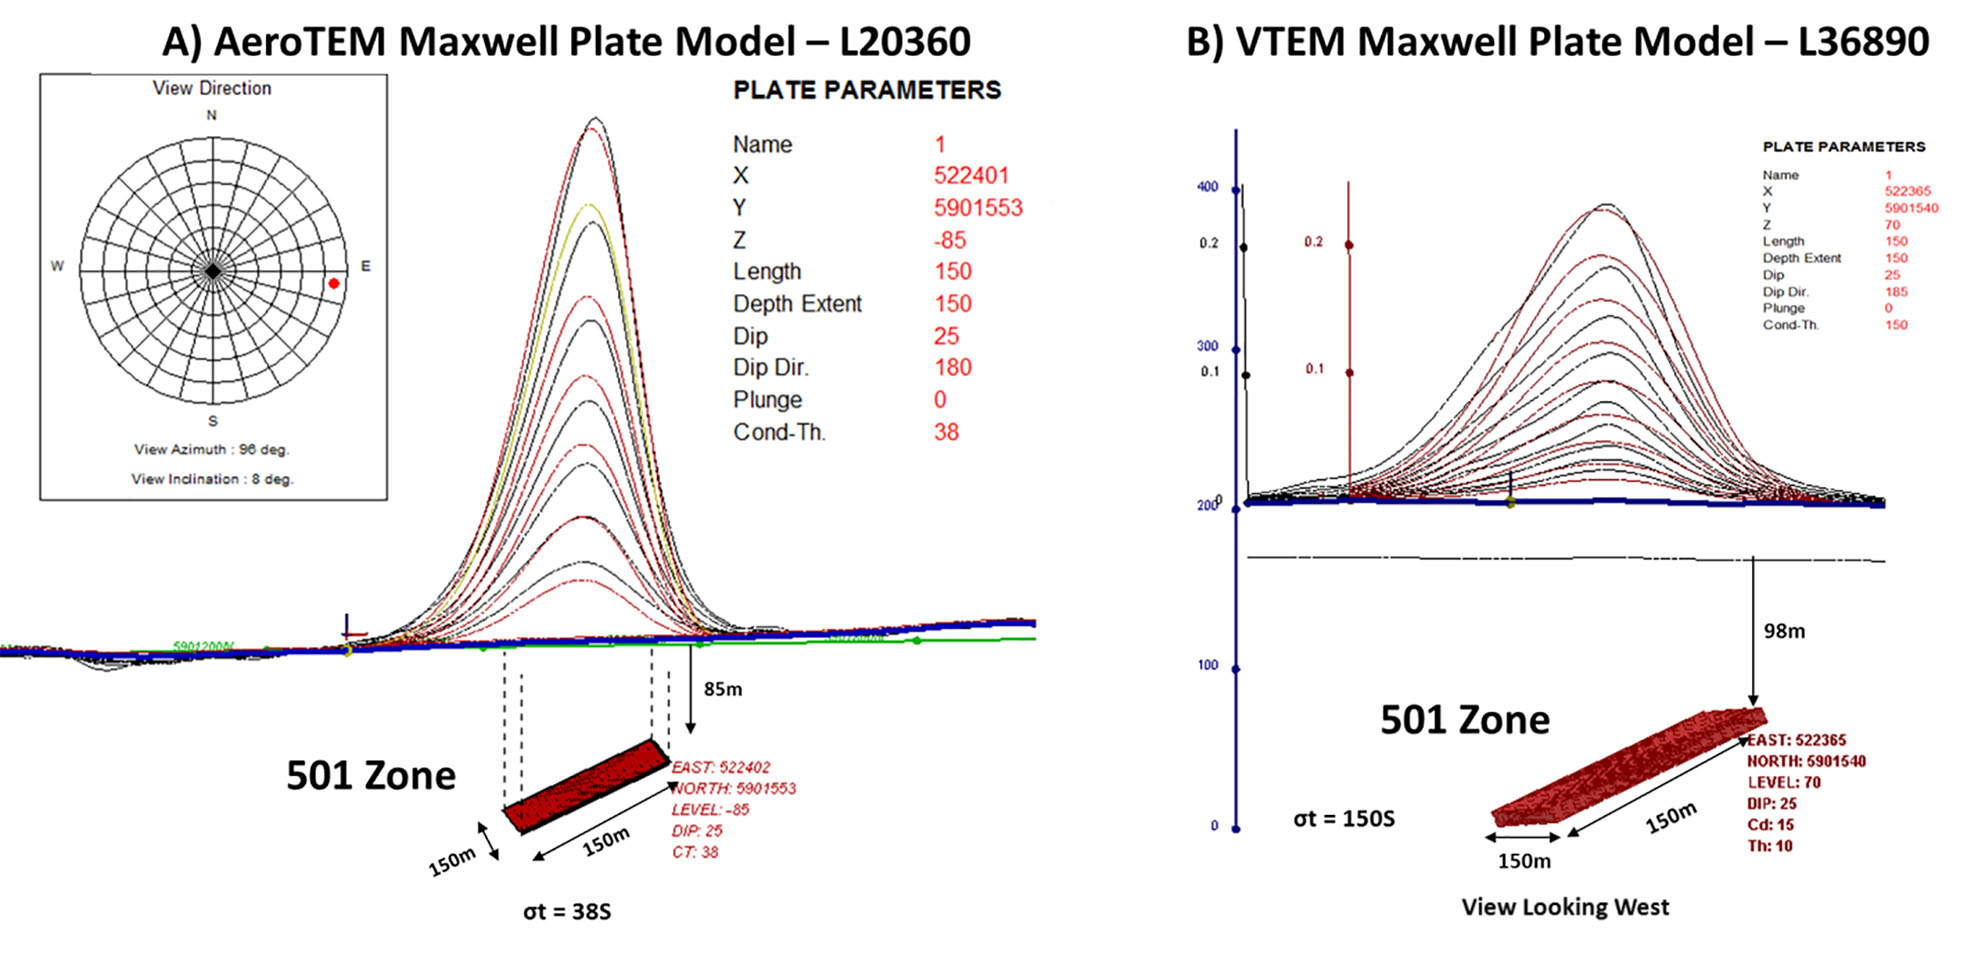
Figure 4: Maxwell 2.5D EM plate modeling for 501 Zone: A) AeroTEM L20360 and B) VTEM L36890, using late time-gates of dBz/dt responses.
ZTEM Survey Results
The 2009 ZTEM survey consisted on 730 line-km flown over two blocks spaced at 200m. ZTEM lines were orientated NS and NW-SE with the purpose of intersecting the mineralized 501 zone and other anomalies of interest. The EM and magnetic sensors were at 81m and 94m mean elevations AGL, respectively. The ZTEM survey measured In-line and Cross-line tippers between 30-360Hz. The ZTEM survey results (30-360Hz) are shown in Figure 5.
ZTEM is an airborne variant of the AFMAG natural field EM technique where a single vertical-dipole air-core receiver coil is flown over the survey area in a grid pattern, similar to regional airborne EM surveys. Two orthogonal, air-core horizontal axis coils are placed at a base station close to the survey area to measure the horizontal EM reference fields. Data from the three coils are used to obtain the Tzx In-line and Tzy Cross-line tippers (Vozoff, 1972) at 5-6 frequencies in the 30 to 720 Hz band, according to the following formula, where r is the location for the vertical field site and r0 is the location of the ground based reference station (Holtham and Oldenburg, 2008):
Hz(r) = Tzx(r, r0) Hx(r0) + Tzy(r, r0) Hy(r0)
Figure 5 presents the ZTEM tipper results in plan shown as Total Phase Rotation (TPR) images that convert the tipper cross-overs into peak responses while preserving long waveform information (Lo et al., 2009). Shown are the In-Phase TPR at the high (360Hz) and low (30Hz) frequency, for depth-comparison purposes, based on relative skin EM depths.
The circular elongated shape of the anomaly is well defined at high frequencies (Figure 5a, 360Hz), suggesting a near surface source-depth and corroborating the previous AeroTEM and VTEM results. At lower frequencies, the anomaly, although diminishing in strength and size, is still well defined (Figure 9b, 30Hz) potentially suggesting good vertical depth extent. The 501 anomaly also lies on a NE-aligned conductive trend that cross-cuts the apparent geologic strike and is unexplained, but nevertheless subparallels the known aeromagnetic and geologic structural lineaments (see Figures 1-2). The increase in apparent conductivity that is indicated in the TPR results to the northeast of 501 zone is also unexplained and not detected/resolved in the VTEM or AeroTEM, but is likely lithologically-related.
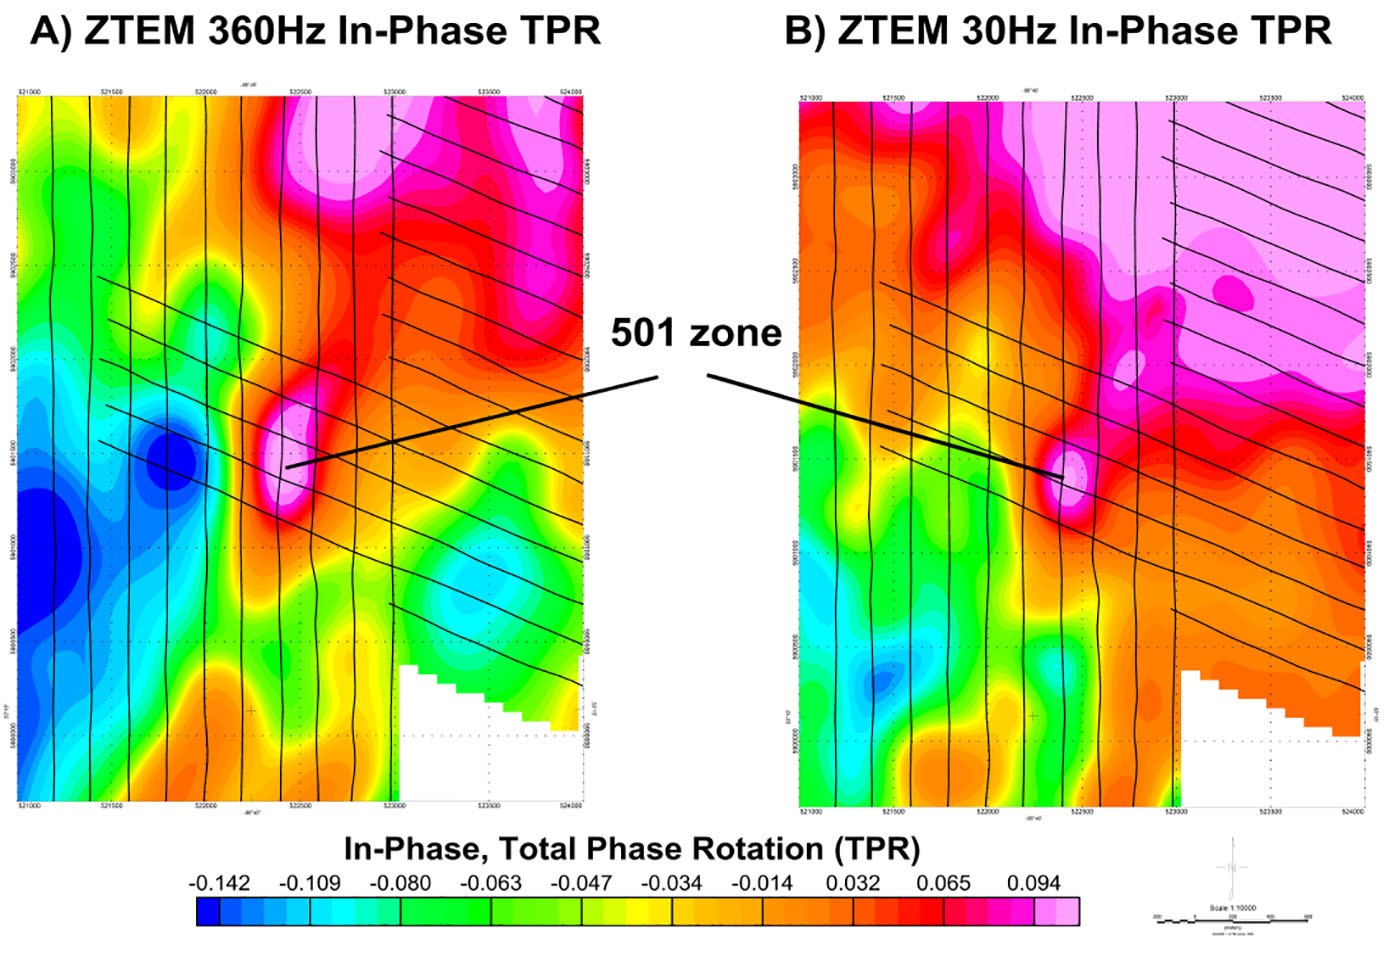
Figure 5: ZTEM Total Phase Rotation (TPR) of In-Phase Tipper at; A) 360Hz (shallower) and B) 30Hz (deeper), highlighting the 501 mineralized zone.
ZTEM 2D and 3D Inversion Results
Two-dimensional (2D) inversions of the ZTEM data were calculated using the Geotech Av2dTopo code. The 2D inversions convert the In-Phase and Quadrature ZTEM tipper data into equivalent resistivity vs. depth cross-sections. The algorithm is based on the 2D inversion code of De Lugao and Wannamaker (1996), the 2D forward code of Wannamaker et al (1987), and the Gauss-Newton parameter step equations of Tarantola (1987). Av2dTopo accounts for the 2D topography and the bird terrain clearance, by imposing a variable “air layer” below the receiver. The inversion used the in-line (Tzx) component, in-phase and quadrature data for all five frequency (30, 45, 90,180, 360 Hz) data in the calculation. A 1,000 ohm-m homogeneous half-space apriori model was chosen based on model-misfit testing (Holtham and Oldenburg, 2010).
Figure 6 presents 2D inversion results for the north-south lines (left) and the NW-SE lines (right) that pass directly over the 501 zone. As shown, the line flown in NW-SE orientation displays the more conductive response, suggesting that target main orientation is more NS; whereas the ZTEM response is weaker for the NS orientated line, suggesting a shorter EW dimension. This is also reflected in the survey data profiles, with better defined cross-overs in the NW-SE lines, relative to the NS lines. More importantly, as shown in Figure 6ab, in addition to defining the subcropping 501 zone to 350-500m depths, both 2D inversions give indications of potentially deeper conductivity, at >750m depths below the deposit response. Clearly, though, the 3D geometry of the 501 requires that these features be validated using more advanced 3D inversion instead of 2D.
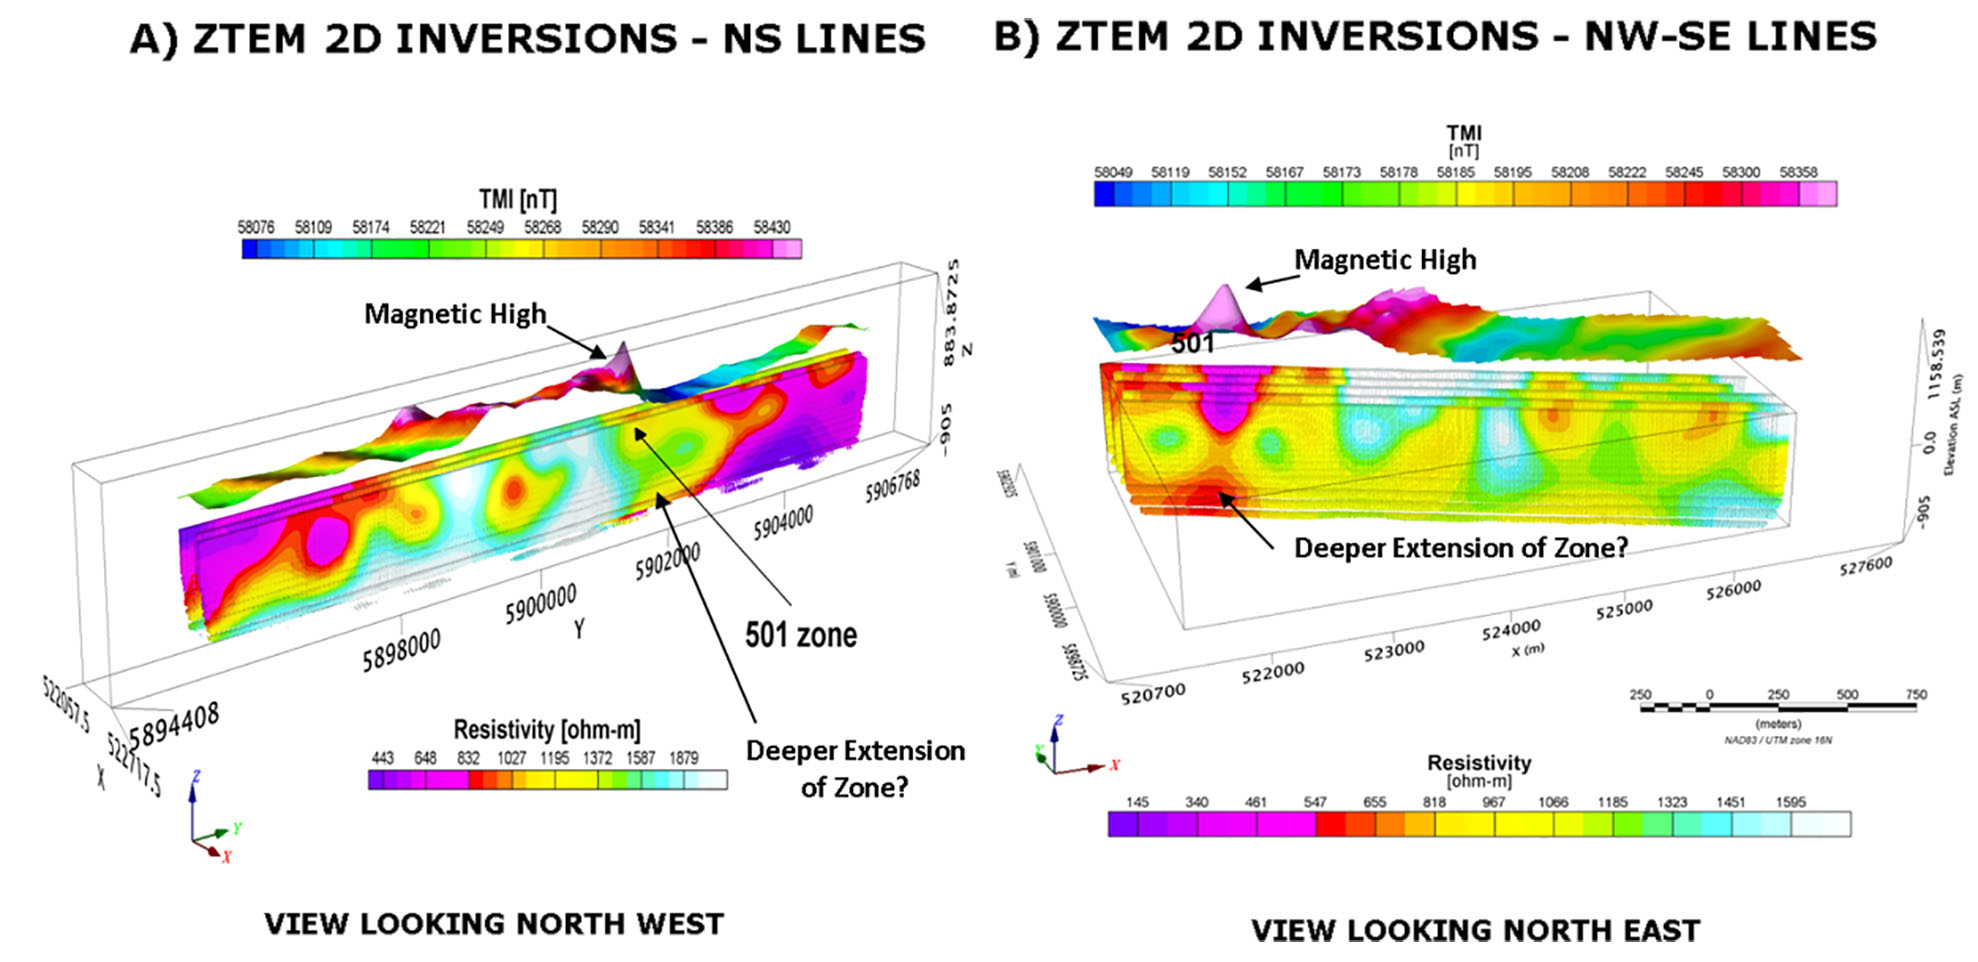
Figure 6: 3D views of ZTEM 2D inversions highlighting the 501 mineralized zone; A) along North-South lines; B) NW-SE lines.
A three-dimensional (3D) inversion of ZTEM data was performed using the UBC MT3Dinv software. The 3D inversion code is the Gauss-Newton algorithm developed by Holtham and Oldenburg (2008) and utilizes the multi-frequency In-phase and Quadrature data for both the Tzx in-line and Tzy cross-line components.
Figure 7ab presents 3D voxel and cross-sectional views generated by the 3D inversion and that was performed with 46x54x50 cells with dimensions 100x100x100m and 1,000 ohm homogeneous half-space starting model. The 100 ohm-m iso-surface, shown in Figure 7a, that roughly conforms to the 501 zone conductivity anomaly, has approximate dimensions of 500m NS x 200m EW x 300 m vertical (Figure 7b). Hence, although, the 3D ZTEM model exceeds the VTEM-AeroTEM NS and EW dimensions, its vertical depth extent approximates the known 501 sulphide orebody. Equally important, unlike the 2D inversion models, additional zones of increased conductivity are not particularly well defined the 3D model at greater depth below the known 501 zone. However, the 3D ZTEM inversion also suggests that the 501 zone is hosted along a prominent NE-trending, subvertical but weakly conductive (~1k Ω-m) structure. Thus the 3D inversion corroborates the same feature, possibly the volcanic exhalite host or stringer zone, also identified in the ZTEM data and 2D inversion results.
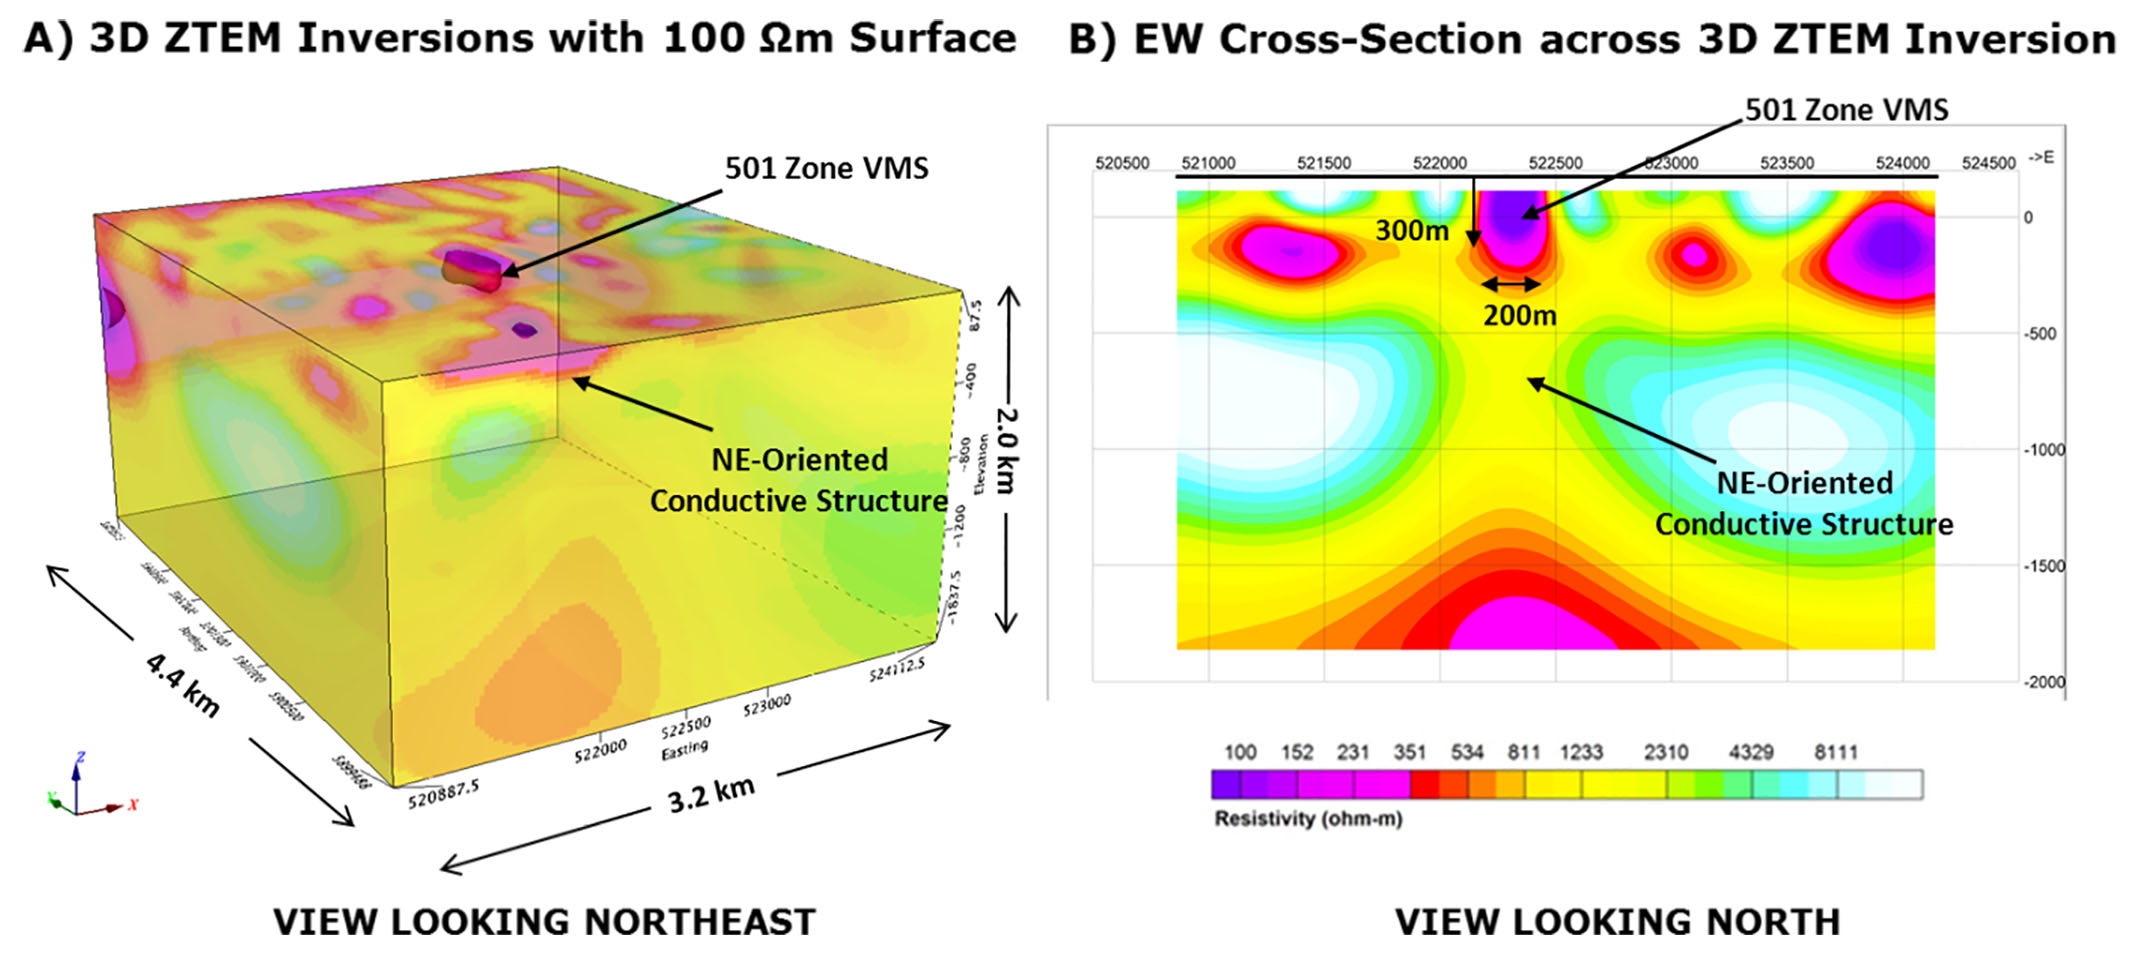
Figure 7: 3D ZTEM inversion results; A) voxel view of the complete range of resistivity values; B) view of the 100 ohm-m isosurface, highlighting the 501 zone in the near-surface.
Conclusions
Helicopter-borne active source AeroTEM and VTEM surveys and passive natural field ZTEM survey results over the 501 project have identified conductive signatures associated with the known VMS type Zn-Cu-Pb-Ag 501 mineralized zone, located in the northern extension of the Ring of Fire region of McFauld’s Lake, northern Ontario. The 501 zone is distinguished by the fact that, in spite of its relatively small size and near-surface depth, in addition to AeroTEM and VTEM, this VMS deposit appears to respond well to ZTEM.
2.5D-3D inversion modeling have shown that each system identifies the same target, with markedly higher conductances obtained from VTEM relative to AeroTEM, attributed to differences in base-repetition rate, pulse width/shape and decay sampling interval. The ZTEM 3D inversion improves the discrimination of 501 zone over the ZTEM 2D inversion and field results also. However, while the ZTEM 3D model has overall dimensions which are larger than VTEM and AeroTEM and it also extends to greater depth, similar to the known vertical extent for 501 zone. The results also indicate that 501 zone ZTEM anomaly occurs along a prominent NE trending, weakly conductive structure, unresolved in the VTEM and AeroTEM results, that extends from surface to great depths and that might possibly represent an exhalite or stringer zone feature related to the 501 zone volcanogenic massive sulphide orebody.
Acknowledgements
The authors wish to thank Metalex Ventures Ltd., White Pine Resources Ltd. and Geotech Ltd. for allowing us to show these results and for sponsoring the study.
References
Balch, S.J., W.P. Boyko, G. Black, and R.N. Pedersen, 2002, Mineral exploration with the AeroTEM system, SEG Expanded Abstracts, 9-12.
De Lugao, P.P., and Wannamaker P., 1996, Calculating the two-dimensional magnetotelluric Jacobian in finite elements using reciprocity, Geophysical Journal International, 127, 806-810.
Holtham, E., and D.W. Oldenburg, 2008, Three-dimensional forward modelling and inversion of Z-TEM data, SEG Expanded Abstracts, 27, 564-568.
Holtham, E., and D.W. Oldenburg, 2010, Three-dimensional inversion of ZTEM data, Geophysical Journal International, 182, 168-182.
Huang, H. and Rudd, J., 2008, Conductivity-depth imaging of helicopter-borne TEM data based on a pseudolayer half-space model, Geophysics, 73, 115-120.
Lahti, H., Yarie, Q., and Singh, R., 2010, NI 43-101 Technical Report on the Bourdon prospects, James Bay Lowlands, Ontario, Canada, 77 p.
Labson, V. F., Becker A., Morrison, H. F., and Conti, U. , 1985, Geophysical exploration with audio frequency natural magnetic fields, Geophysics, 50, 656-664.
Legault, J.M., Fisk, K., and Fontura, C., 2010, Case study of ZTEM airborne tipper AFMAG results over a magmatic nickel deposit at Forrestania, West Australia, 4th Brazilian Geophysics Symposium, SBGF Expanded abstracts, 8 p.
Legault, J.M., Kumar, H, Milicevic, B, and Hulbert, L., 2009, ZTEM airborne tipper AFMAG test survey over a magmatic copper-nickel target at Axis Lake in northern Saskatchewan, SEG Expanded Abstracts, 28, 1272-1276.
Legault, J.M., Orta, M., Kumar, H., and Zhao, S., 2011, ZTEM and VTEM airborne EM survey results over PGM-Cu-Ni targets at East Bull Lake anorthositic complex, Massey, Ontario, SEG Expanded Abstracts, 30, 629-634.
Legault, J.M., Wilson, G.A., Gribenko, A.V., Zhdanov, M.S., Zhao, S., and Fisk, K., 2012, An overview of the ZTEM and AirMt systems – A case study from the Nebo-Babel Ni-Cu-PGE deposit, West Musgrave, Western Australia, In RJL Lane (editor), Natural Fields EM Forum 2012: Abstracts from the ASEG Natural Fields EM Forum 2012: Published by Geoscience Australia, Geoscience Australia Record 2012/04, 101-121.
Liu, G., 1998, Effect of transmitter current waveform on airborne TEM response, Exploration Geophysics, 29, 35-41.
Lo, B., J. M. Legault, P. Kuzmin, and M. Combrinck, 2009, Z-TEM (Airborne AFMAG) tests over unconformity uranium deposits, ASEG Extended Abstracts 2009, 1-6.
Lo, B., and Zang, M., 2008, Numerical modeling of Z-TEM (airborne AFMAG) responses to guide exploration strategies, SEG Expanded Abstracts, 27, 1098-1101.
Meju, M.A., 1998, Short Note: A simple method of transient electromagnetic data analysis, Geophysics, 63, 405–410.
Ontario Geological Survey, 2006, 1:250,000 scale bedrock geology of Ontario; Ontario Geological Survey, Miscellaneous release data 126 – revised.
Orta, M., Legault, J.M., Zhao, S., Izarra, C., Eadie, T., and Galeschuk, C., 2012, ZTEM and VTEM airborne EM survey results over the Mayville Cu-Ni-PGM intrusive system, southeastern Manitoba, SEG Expanded Abstracts, 31, 1-5.
Prikhodko, A., Morrison, E., Bagrianski, A., Kuzmin, P., Tishin, P., and Legault, J.M., 2010, Evolution of VTEM – technical solutions for effective exploration, ASEG Extended Abstracts 2010, 1-4.
Sattel, D., Witherly, K. and Becken, M., 2010, A brief analysis of ZTEM data from the Forrestania test site, WA, ASEG Extended Abstracts 2010, 1-4.
Smith, R.S., 2013, Electromagnetic methods in mining geophysics from 2008 to 2012, paper presented at the 21st Workshop on Electromagnetic Induction in the Earth, Darwin Australia, 61 p.
Tarantola, A., 1987, Inverse Problem Theory, Elsevier, New York, 613 p.
Vozoff, K., 1972, The magnetotelluric method in the exploration of sedimentary basins: Geophysics, 37, 98–141.
Wannamaker, P. E., Stodt, J. A., and Rijo, L., 1987, A stable finite element solution for two dimensional magnetotelluric modeling: Geophysical Journal of Royal Astronomical Society, 88, 277-296.
Ward, S. H., 1959, AFMAG – Airborne and Ground: Geophysics, 24, 761-787.
Witherly, K., Irvine, R., and Morrison, E.B., 2004, The Geotech VTEM time domain helicopter EM system: SEG Expanded Abstracts, 23, 1217-1221.