For a PDF of this paper click here.
PRESENTED AT SEG 2018
SUMMARY
Helicopter ZTEM natural field EM and VTEM helicopter time-domain EM system results are compared over the McArthur River Project in northwestern Saskatchewan. The ZTEM survey data were complicated by the fact that they were obtained in low signal winter conditions and with a major powerline present. The ZTEM results from 30 to 90 Hz were generally of good quality to within ~1-1.5 km from the powerline; however the higher frequency (>180 Hz) tipper data are clearly affected by powerline noise as far as 5 km away. The ZTEM signatures agree well with those from the VTEM Max system; however source depths from 2D inversion indicate that the bedrock sources are shallower than expected (<250 m), possibly due to limited frequency bandwidth or else an improper (low) apriori resistivity model. 3D ZTEM inversion results appear much improved over 2D. In nearly all cases, depths of investigation estimates exceed 2 km for the ZTEM inversions. The VTEM Max system 30 Hz TDEM results were of a comparatively good quality, with powerline affecting the data to within less than <1 kilometre. Depths to basement range from 250-300 m and imaged the location of the basement graphitic pelites. Depths of investigation from RDI resistivity-depth imaging are estimated to reach and exceed 600 m in some areas. Both EM surveys and magnetics assisted in understanding basement geology.
INTRODUCTION
The McArthur River uranium mine is located in the Athabasca Basin in northern Saskatchewan, Canada (Figure 1), and is the world’s largest high grade uranium mine, co-owned by majority partner Cameco in joint-venture with Orano. The McArthur River mine region has been previously studied with airborne electromagnetics,, with Fixed-wing and VTEM (Witherly et al., 2004) helicopter time-domain EM from nearby West McArthur project compared by Irvine and Witherly (2008) and with ZTEM (Lo and Zang, 2008) natural field helicopter EM test results by Witherly (2009).
In late 2015, system availability prevented a planned VTEM helicopter time-domain electromagnetic survey from being flown over an area within the McArthur River project, situated 14 km along strike to the northeast from McArthur River mine site and 15 km southwest of Cigar Lake mine. As a substitute, a ZTEM natural field helicopter EM test survey was flown in winter conditions in late December, 2015 to early January, 2016. As a further complication, a major powerline extends across the property. The property was subsequently reflown with the VTEM Max system (Prikhodko et al., 2010) in September, 2016.
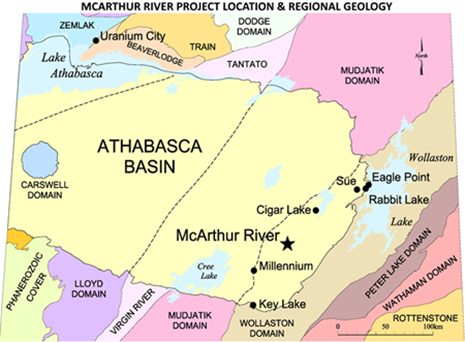
Figure 1: Location of McArthur River Project in Athabasca Basin, northwest Saskatchewan, over regional geology (yellow = Athabasca sandstone, other colours = Basement Domains; courtesy Cameco Corp.).
As result, these surveys provide a relatively unique opportunity to learn from comparisons between the two different airborne EM technologies directly over a relatively deep unconformity uranium setting, and to also assess the ability to acquire natural field ZTEM data during the low natural field signal Winter Solstice, and in the presence of man-made culture.
GEOLOGY
The McArthur River project is situated in the south-eastern portion of the Athabasca Basin within the northeast to east trending Churchill Structural province, of the Canadian Shield. The area is covered by ~550 m of late Paleoproterozoic Athabasca Group sedimentary rocks, which unconformably overlie Paleoproterozoic and Archean rocks of the Wollaston Lithostructural Domain (Figure 1). The Wollaston Domain is comprised of meta-sedimentary and granitoid gneisses. The metasedimentary sequence includes graphitic and non-graphitic pelitic and semi-pelitic gneisses, felsic and quartz-feldspathic gneisses, metaquartzite and calcsilicate gneisses. Magnetic Archean granitoid gneisses flank these metasedimentary rocks (McGill et al., 1993).
AIRBORNE SURVEY RESULTS
ZTEM Natural Field EM Survey
The 2015 ZTEM survey consisted of 1064 line-km flown along 200 m spaced lines over the McArthur River survey block. ZTEM lines were oriented N 165°E to perpendicularly cross-cut the geology. The EM and magnetic sensors were situated at ~85 m and 100 m avg. elevations, respectively. The ZTEM survey results over the McArthur River study area are presented in Figure 2.
ZTEM is an airborne variant of the AFMAG (Ward, 1959) natural field EM technique where a single vertical-dipole air-core receiver coil is flown over the survey area in a grid pattern, similar to regional airborne EM surveys. Two orthogonal, air-core horizontal axis coils, placed close to the survey site, measure the horizontal EM reference fields. Data from the two sets of coils (receiver r & base r0) are used to obtain the TZX In-line and TZY Cross-line tippers (Vozoff, 1972) at 6-7 frequencies in the 22 to 720 Hz band, according to the following formula (Holtham and Oldenburg, 2008):
HZ(r) = TZX(r, r0) HX(r0) + TZY(r, r0) HY(r0)
Figure 2 presents the ZTEM tipper results in plan shown as Total Divergence (DT) images that convert the characteristic tipper cross-overs into peak responses using a horizontal derivative approach for easier interpretation/visualization (Lo et al., 2009). Shown are the In-Phase DT’s from high too low (720 to 30 Hz) frequencies, for depth-comparison purposes, based on relative EM skin depth (Vozoff, 1972; Spies, 1989). The ZTEM results appear to define complexly shaped conductive lineaments, related to basement graphitic pelite units below the Athabasca sandstone cover, particularly in the south-eastern survey area. These become better defined at progressively lower frequencies and greater skin depths below the sandstone cover and into the Archean basement.
But also evident is the variable effect and lateral extent of noise on the ZTEM results from the major powerline, located to the northwest. The noise corridor is also notably wider (>10 km) particularly at frequencies >180 Hz (Figure 2ab), whereas its effect is less widespread (~3 km) at frequencies <90 Hz (Figure 2cd). This is presumably due to lower signal/noise at the higher end of the frequency spectrum, exacerbated by weak natural field signal during the December-January period. These are nevertheless noteworthy examples of reasonably good quality ZTEM data that can be obtained in mid-Winter signal conditions and at northern latitudes.
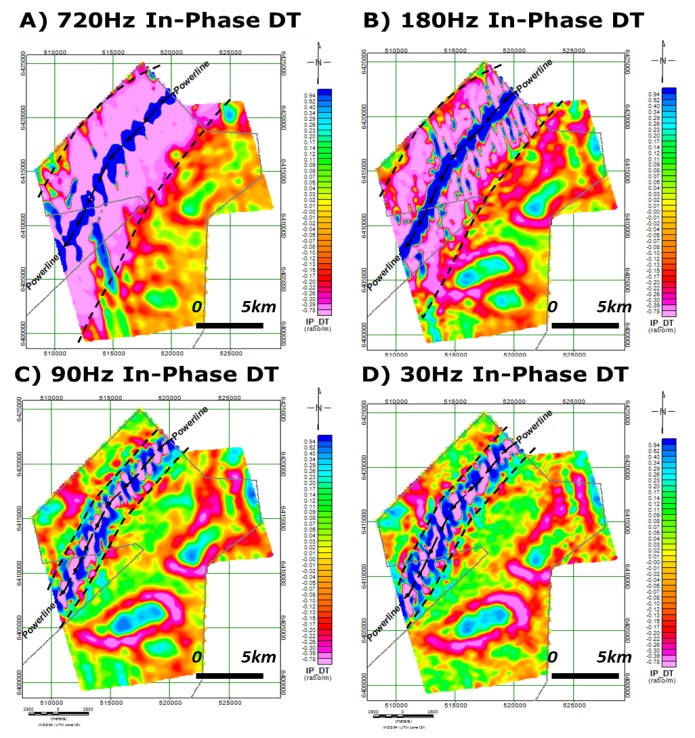
Figure 2: ZTEM multi-frequency DT results at: a) 720 Hz, b) 180 Hz, c) 90 Hz and d) 30 Hz, showing effect & variable extent (dashed lines) of powerline noise, with outline of McArthur property boundary (grey polyline).
VTEM Time-Domain EM Survey
The 2016 VTEM survey consisted of 543 line-km flown along the 200 m spaced, northwest-southeast lines used for ZTEM, as well as several northeast tie-lines. The EM and magnetic sensor heights were at 40 m and 65 m on average above ground level, respectively. The VTEM and magnetic results at McArthur River are presented in Figure 3. The EM Time Constant (Tau) in Figure 3a was obtained from the Z-coil, off-time dB/dt response. The “sliding Tau” method that was used calculates the slope of the EM decay at the latest possible time-channels above the chosen EM noise threshold level (A. Prikhodko, pers. comm.).
The VTEM images in Figure 3 appear to also define the same complexly shaped basement graphitic conductors that were resolved in the ZTEM results. Similarly, comparing Figure 3abc, these become better defined at progressively lower later decay times and greater skin depths (Spies, 1989). The Tau late-time decay constant image in Figure 3d bears a very close resemblance to the ZTEM images in Figure 2 – albeit in some areas the VTEM conductors are perhaps not as continuous or well defined, possibly an effect of greater depth of burial or greater late-time noise in closer proximity to the powerline.
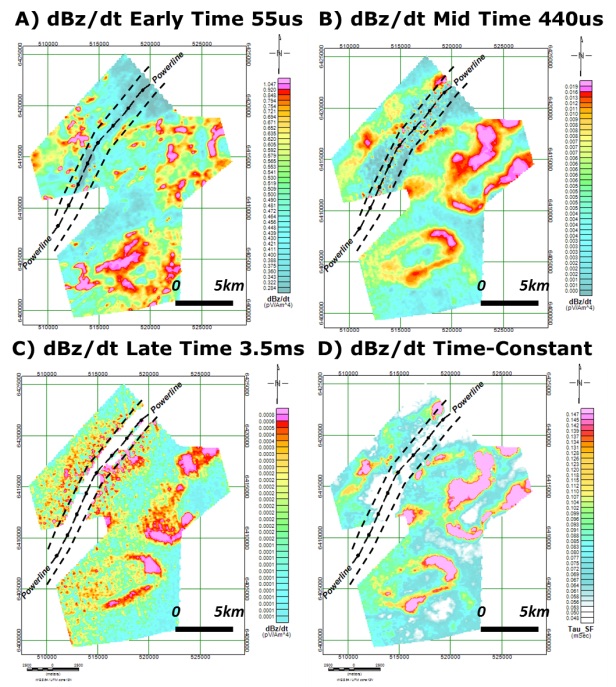
Figure 3: VTEM multi-channel dBz/dt results: a) Early-time decay (ch10 = 55 usec), b) Mid-time (ch25 = 440 usec, c) Late-time (ch40 = 3.5 msec) and d) Late-time constant (Tau), showing effect & extent of powerline noise.
As seen previously, also evident is the powerline effect and lateral extent of noise on the VTEM results from the major powerline noise, to the northwest. However, the noise effect is visibly less for VTEM relative to ZTEM and the noise corridor is also notably narrower (<2 km vs. >3 km) which is testament to higher signal/noise from active-source systems relative to natural field systems. Clearly the VTEM results are better able to map geology in the vicinity of the powerline than the ZTEM survey data.
VTEM 1D Imaging and ZTEM 2D-3D Inversion
RDI 1D resistivity depth imaging was used to rapidly convert the VTEM vertical component EM decay profile data into equivalent apparent resistivity versus depth cross-sections. The RDI algorithm for resistivity-depth transformation is based on the apparent resistivity transform of Meju (1998) and the TEM response from conductive half-space. The RDI transform is depth calibrated based on forward plate modelling for AEM system configurations (A. Prikhodko, pers. comm.).
Figure 4 represents the RDI apparent resistivity depth slices from -100 m below surface to -600 m, with an estimated maximum depth of investigation (DOI) of approx. 600 m within the McArthur River project area. The RDI depth-slices define the same complexly shaped basement graphitic conductors that were resolved in the VTEM and ZTEM raw data. However, the relative depths of conductive sources are obviously better resolved, with the shallow (100 m depth) results. Also noteworthy is the imaging of conductive units across the powerline corridor. However, as shown, the quality of the RDI image progressively degrades below 400 m, with the 600 m image in Figure 4d revealing little about the basement geology, due to its nearing the maximum DOI range.
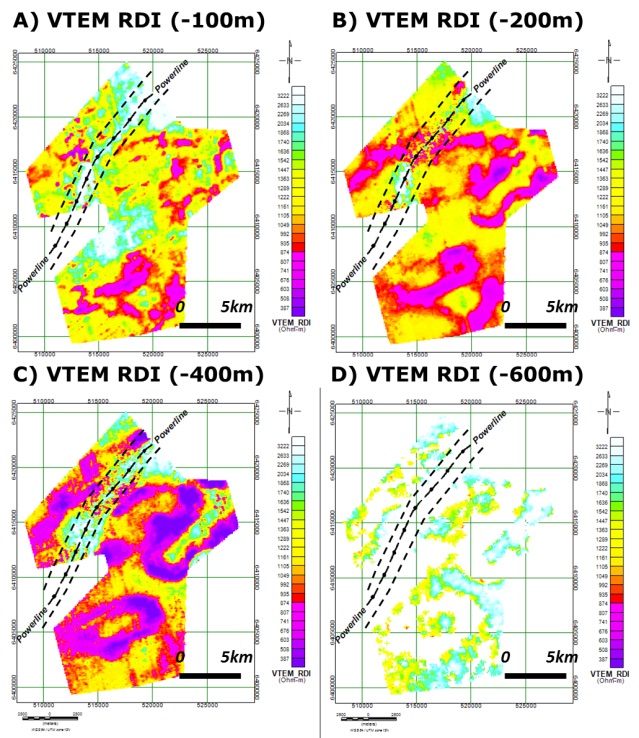
Figure 4: VTEM resistivity-depth imaging (RDI) results at: a) -100 m depth, b) -200 m, c) -400 m, and d) -600 m, showing effect & extent of powerline noise.
At the onset of the ZTEM data analysis, two-dimensional (2D) inversions of the ZTEM data used Geotech’s proprietary Av2dTopo (Legault et al., 2012) that is based on the code of de Lugao and Wannamaker (1996).). The inversion utilized the in-line (TZX) component, in phase and quadrature data for three to six frequencies (30, 45, 90, +/- 180, 360, 720 Hz) depending on effect/influence of the powerline (Figure 2).
The 2D ZTEM resistivity depth-slices were found to define similar basement graphitic conductors that were resolved in the previous VTEM dBz/dt and RDI results and also the ZTEM field results. However, it was found that at shallow depths, the ZTEM inversions revealed resistivity features that clearly relate to the basement and not the Athabasca sandstone. This was interpreted to be due to lack of sufficiently high frequencies (due to PL noise) for proper resolution or else the choice of half-space resistivity (2k ohm-m), which, if too low, would underestimate the source depth (Legault et al., 2009). And at depth, the resistivity depth slices did not contain as much detail as revealed in the ZTEM DT data, which is of course related to the limits of 2D inversions in 3D geology. As a result, a 3D ZTEM inversion was performed to help resolve these issues.
The multi-frequency (30-720 Hz) ZTEM data in both TZX and TZY components were subsequently inverted using the UBC ZTEM_MT3Dinv code of Holtham and Oldenburg (2008). Resistivity depth-slices for the 3D inversion (Figure 5), similar to those presented earlier, at depth (800 m) define similar basement graphitic conductors that were resolved in the previous VTEM and 2D ZTEM results. However, as shown in Figure 5ab, at shallow depths (<200 m), the 3D ZTEM inversions reveal no indication of conductors within the Athabasca sandstone depth intervals, unlike the previous 1D VTEM and particularly 2D ZTEM. Furthermore, at 400 m (Figure 5c) the 3D inversion results better reflect the resistive sandstone thicknesses that are known to progressively increase from approx. 250 m to 400 m from southeast to northwest (C. Keller, pers. comm.). The extent of powerline influence also appears to be less for 3D relative to the previous 2D inversions.
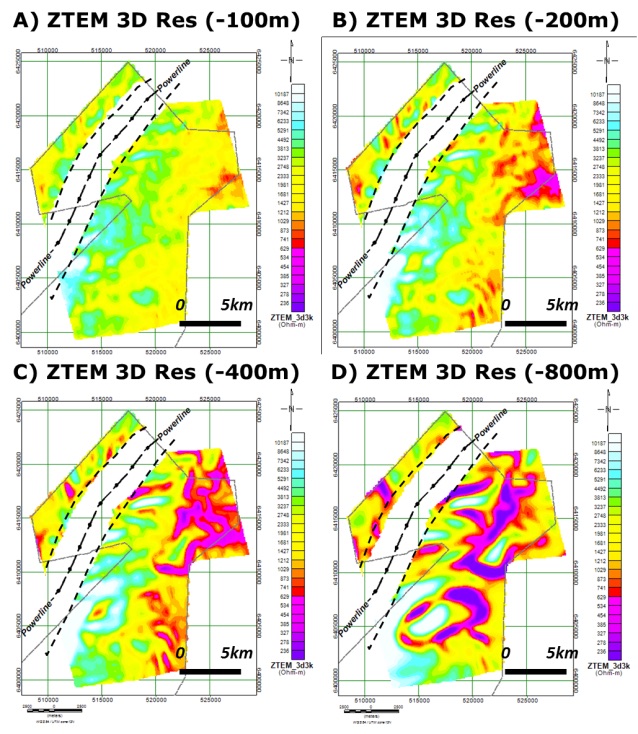
Figure 5: ZTEM 2D resistivity inversion results at: a) -100 metre depth, b) -200 m, c) -400 m, and d) -800 m, showing estimated extent of powerline noise.
As a testament to the results of the airborne surveys performed at McArthur River study area, a geological interpretation was created shortly after the surveys, and was based on the aeromagnetics and the ZTEM and VTEM survey results. Figure 6 shows the resulting basement geology map at the unconformity, interpreted by Cameco from airborne geophysics and limited drilling.
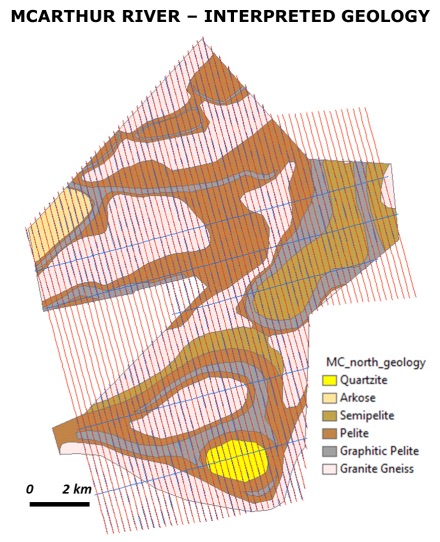
Figure 6: McArthur River interpreted basement geology, below sandstone cover, based on airborne EM & magnetic results and limited drilling (courtesy Cameco Corp.).
CONCLUSIONS
The lesson learned from the surveys was firstly that reasonably good low to mid frequency (30-90 Hz) ZTEM can be obtained in winter conditions, even in the presence of powerlines, but higher frequencies (180-720 Hz) are more strongly impacted, due to weak primary field strengths in northern latitudes. Secondly, good spatial correlation could be observed between the ZTEM and VTEM conductors but poorer depth control from the ZTEM models reinforces the fact that a reasonably appropriate starting model is critical for accurate inversion results. 3D ZTEM inversions seemed to provide far more reliable geology and depth control than 2D. Finally, we also learned that good imaging of the upper basement geology could be obtained at these depths from the VTEM Max system using 1D imaging approach. The combined VTEM and ZTEM airborne EM and aeromagnetic results, combined with imaging, 1D-2D-3D inversion and limited drilling, were helpful in producing a reasonably satisfactory geologic model of the McArthur River study area.
ACKNOWLEDGEMENTS
The authors thank McArthur River project partners Cameco and Orano Canada for allowing us to present these results.
REFERENCES
De Lugao, P. P., and P. E. Wannamaker, 1996, Calculating the two-dimensional magnetotelluric Jacobian in finite elements using reciprocity: Geophysical Journal International, 127, 806–810.
Holtham, E., and D. W. Oldenburg, 2008, Three-dimensional forward modelling and inversion of Z-TEM data: SEG, Expanded Abstracts, 27, 564–568.
Irvine, R., and Witherly, K., 2008, Reconciling airborne and ground geophysical outcomes in the Athabasca Basin, Saskatchewan, Canada: ASEG, Extended abstracts, 5 p.
Legault, J. M., H. Kumar, B. Milicevic, and P. Wannamaker, 2009, ZTEM tipper AFMAG and 2D Inversion results over an unconformity uranium target in northern Saskatchewan: SEG, Expanded Abstracts, 1277–1281.
Legault, J.M., S. Zhao, and R. Fitch, 2012, ZTEM airborne AFMAG survey results over low sulphidation epithermal gold-silver vein systems at Gold Springs, south eastern Nevada: ASEG, Extended Abstracts, 4 p.
Lo, B., J. M. Legault, P. Kuzmin, and M. Combrinck, 2009, Z-TEM (Airborne AFMAG) tests over unconformity uranium deposits: ASEG, Extended Abstracts 2009, 1-6.
Lo, B., and Zang, M., 2008, Numerical modeling of Z-TEM (airborne AFMAG) responses to guide exploration strategies: SEG, Expanded abstracts, 1098-1102.
McGill, B.D., Marlatt, J.L., Matthews, R.B., Sopuck, V.J., Homeniuk, L.A., and Hubregtse, J.J., 1993: The P2 North Uranium deposit, Saskatchewan, Canada: Exploration and Mining Geology, 2, 321–331.
Meju, M.A., 1998, Short Note: A simple method of transient electromagnetic data analysis: Geophysics, 63, 405–410.
Prikhodko, A., Morrison, E., Bagrianski, A., Kuzmin, P., Tishin, P., and Legault, J., 2010, Evolution of VTEM – technical solutions for effective exploration: ASEG, Extended abstracts, 4 p.
Spies, B., 1989, Depth of investigation in electromagnetic sounding methods: Geophysics, 54, 872–888.
Ward, S., 1959, AFMAG – airborne and ground: Geophysics, 24, 761-787.
Witherly, K., 2009, The search for uranium deposits using airborne EM in the Athabasca Basin, Saskatchewan Canada; experience of the last five years: SEG-Beijing, Expanded abstracts, 4 p.
Witherly, K., Irvine, R. and Morrison, E., (2004), The Geotech VTEM time domain helicopter EM system, SEG, Expanded Abstracts, 4 p.
Vozoff, K., 1972, The magnetotelluric method in the exploration of sedimentary basins: Geophysics, 37, 98–141.