For a PDF of this paper click here
In September, 2009, Geotech Ltd. carried out a helicopter-borne geophysical survey for Pebble Partnership over the Pebble Property situated in the Bristol Bay region of southwest Alaska, approximately 320 km southwest of Anchorage. Principal geophysical sensors included the Z-axis Tipper Electromagnetic (ZTEM) system and caesium magnetometer. A total of 250 km were flown at a nominal line-spacing of 200m over a 60 km2 area. The objective of the ZTEM survey was test its ability to map the Pebble porphyry deposit from surface to depth, based on resistivity contrasts.
The ZTEM survey instrumentation consists of a single vertical-dipole receiver coil (7.4m dia.) that is towed roughly 75m below the helicopter, at a 100m nominal flight height, and is flown over the survey area in a grid pattern, similar to other regional airborne surveys.Two orthogonal air-core horizontal axis coils (3.5m dia.) are placed close to the survey site to measure the horizontal EM reference fields. Data from the three coils are used to obtain the Z/X (In-line) and Z/Y (cross-line) AFMAG tippers, whose transfer functions (In-Phase & Quadrature) are derived at six frequencies in the 30 to 720 Hz band. ZTEM tipper AFMAG is recognized for its unique ability to map resistivity contrasts associated with structure and alteration that are typically associated with porphyry coppers and other similar deposits to great depths, exceeding 1-2km.
Property Geology
The Pebble property is underlain by Jura-Cretaceous to Eocene igneous and sedimentary rocks. The Pebble deposit is a calc-alkalic copper-gold-molybdenum porphyry deposit which formed in association with granodiorite intrusions emplaced at roughly 90 Ma. The deposit comprises the contiguous Pebble West and Pebble East Zones, discovered in 1986 and in 2005, respectively. Mineralization at Pebble West occurs around small granodioritic stocks that intrude the country rocks. The Pebble East mineralization occurs within a granodioritic stock and in sills that cut the country rocks. Pebble West extends to surface and Pebble East is overlain by eastthickening, younger volcano-sedimentary cover. Pebble is bounded to the SE by the major ZG1 dip-slip fault, east of which the deeper Far East Zone (Figure 1) has been recently identified at >1.5km depths (ref. www.pebblepartnership.com).
The deposit hosts K-silicate alteration and associated quartz-sulphide veins, overprinted by phyllo-silicate alteration. Sulphides mainly consist of hypogene pyrite, chalcopyrite, molybdenite and bornite; supergene and thin oxide zones also occur at Pebble West. High grade mineralization at Pebble East is associated with advanced argillic alteration. The Cu-Au-Mo mineralization, as it is currently known, extends over an east-elongated area of 4.9 by 3.3 km, and to a depth of 610m at Pebble West and at least 1525m at Pebble East. The deposit is open to the east, south, NW and SE; a larger zone of strong alteration and low grade mineralization extends to the north, south and west. The Pebble Deposit mineral resource, at a 0.30% copper equivalent cut-off, consist of 5.1 billion tonnes of measured and indicated resources grading 0.43% Cu, 0.35 g/t Au and 256 ppm Mo – making it the 1ST largest gold and 6TH largest copper deposit in the world.
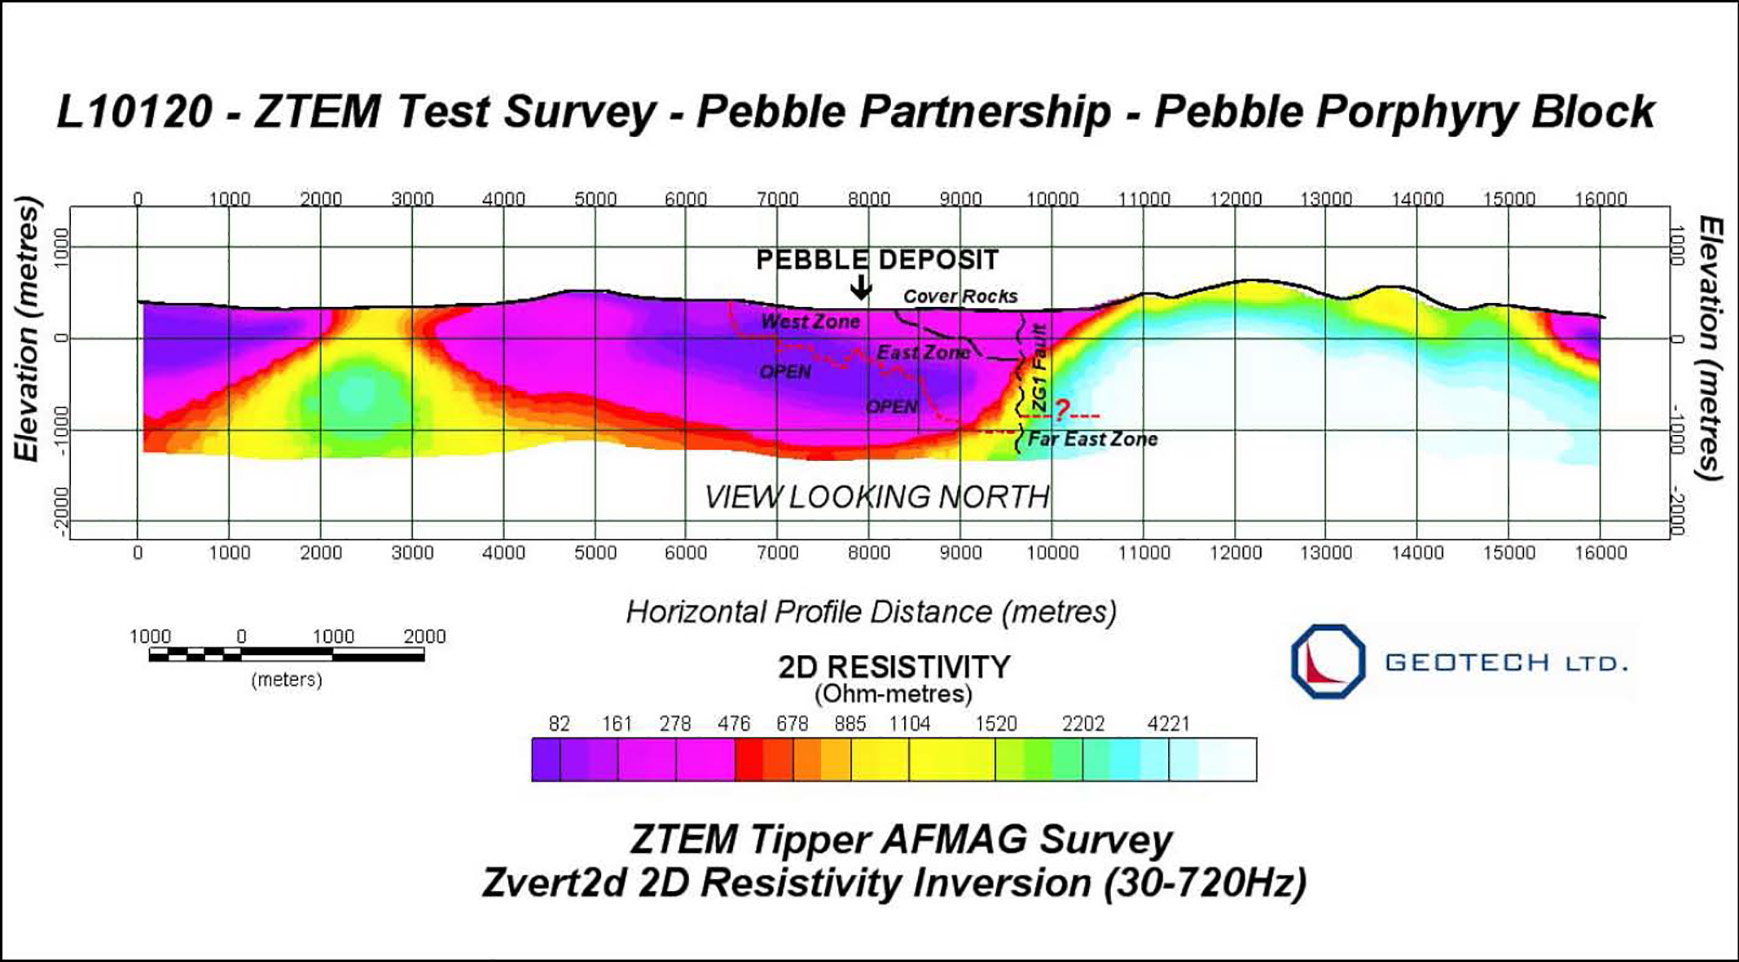
Figure 1: 2D Resistivity cross-section over center of Pebble porphyry deposit from Zvert2d inversion of ZTEM In-line (Z/X) tipper data.
ZTEM Tipper AFMAG Results
Figure 2 presents the ZTEM tipper results in plan shown as Total Phase Rotated (TPR) images (that convert the tipper cross-overs into peaks) of the In-Phase component with the outline of the Pebble East and West Zones overlain. In the TPR image, warm colours represent conductive structures and contacts; cool colours represent more resistive units. The Pebble deposit appears nearly invisible in the 360Hz high frequency data likely due to its limited penetration and poor relative contrasts in this depth range; whereas in the deeper, lowest frequency 30Hz image, the Pebble deposit is better contrasted with the surrounding rocks – the Fig 2b images indicates more resistive rocks in the center that likely coincide with the mineralized potassic-altered core; whereas the lower resistivities outside the deposit are consistent with the surrounding clay-altered pyrite halo. Figures 1 and 3 present the 2D cross-sectional resistivity data results obtained from the 2D inversion of the In-Line (Z/X) ZTEM tipper data using Geotech’s proprietary Zvert2d code. Figure 1 presents the 2D resistivity image for L10120 directly over the Pebble West and Pebble East deposits, from surface to 1.5km depths. Pebble West is defined as a shallower, more resistive body surrounded by lower resistivity rocks at depth and further west, which is consistent with the K-silicate alteration and surrounding lower grade pyritic clay-altered halo. Pebble East is defined as a deeper resistivity low that is consistent with its stronger argillization, which lies below more resistive metasedimentary cap-rocks. East Zone appears to extend below 1km. 2D sections for lines further north suggest even deeper vertical extents to Pebble East and West. The 3D views shown in Figure 3 highlight the Pebble Porphyry based on its resistivity contrasts with the surrounding country rocks.
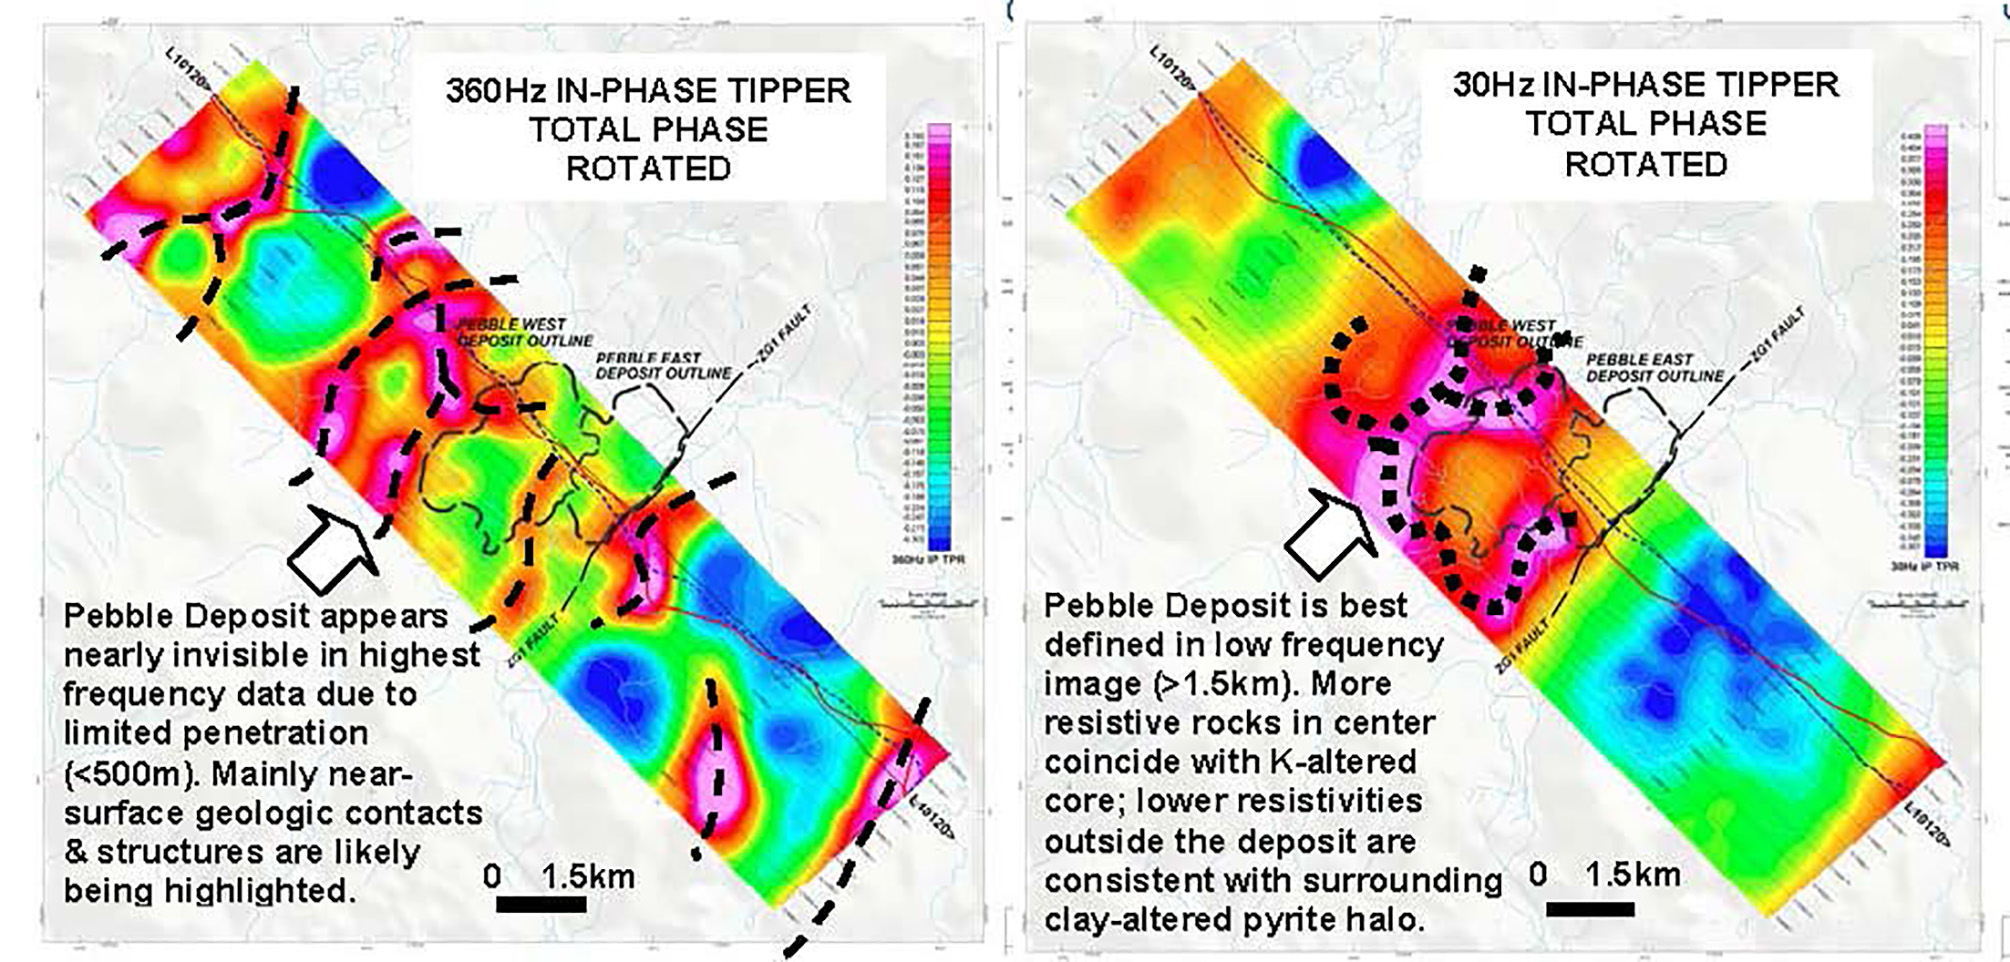
Figure 2: ZTEM Tipper AFMAG field results shown in plan as grid contours of 90-degree Total Phase-Rotated (TPR) In-Phase component at: a) 360 Hz high frequency showing shallower penetration (left) and b) 30Hz low frequency showing deeper penetration (right).
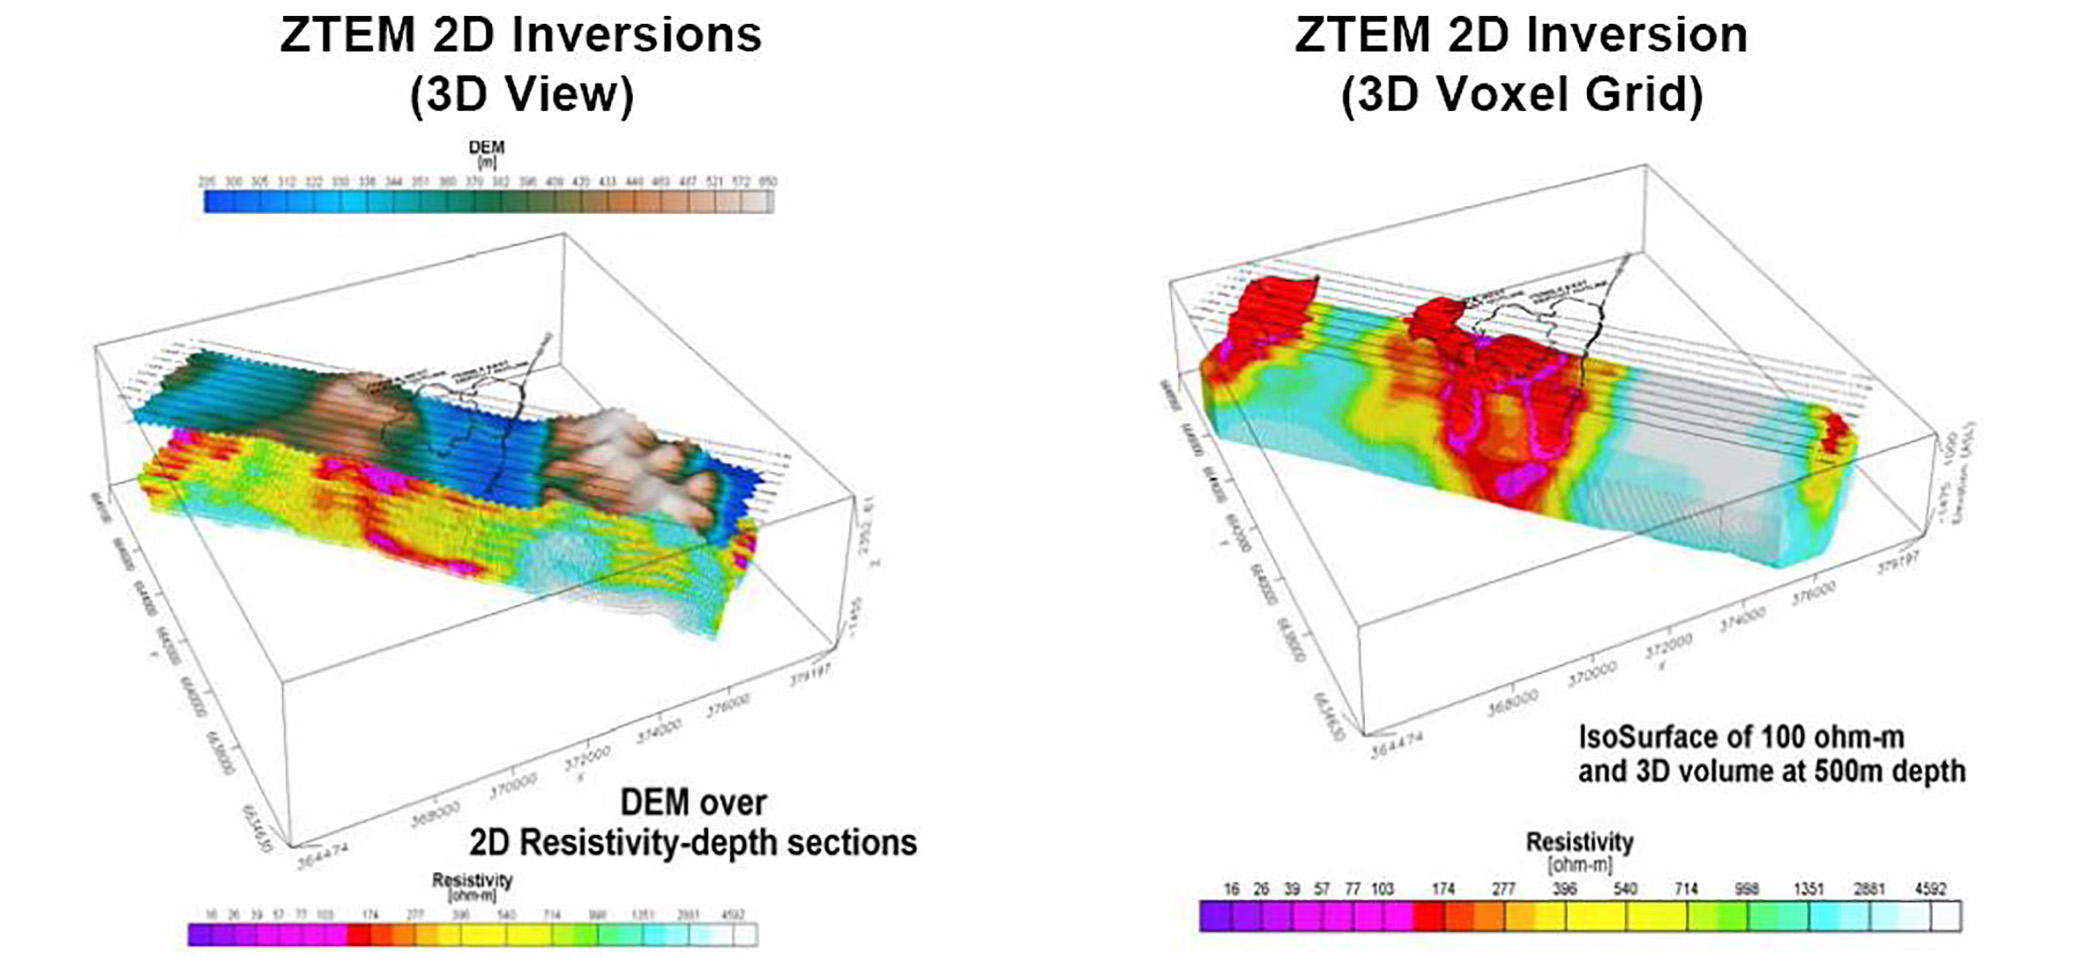
Figure 3: 2D Resistivity inversion of ZTEM results over Pebble porphyry deposit showing: a) 2D cross-sections arranged in 3D view with DEM elevation model (left) and b) 2D results combined in 3D voxel grid volume showing 100 ohm-m iso-surface (right).