For a PDF of this paper click here
Introduction
In April 2009, a ZTEM™ (Z-Axis Tipper Electromagnetic) survey was conducted, on behalf of AREVA Resources Canada Ltd. (Saskatoon, SK) and UEX Corporation (Vancouver, BC), over the Shea Creek Test Block that is situated in the Cluff Lake region of the western Athabasca Basin (Figure 1a). The ZTEM survey consists of airborne Tipper AFMAG (audio frequency magnetic) measurements, as well as aeromagnetics using a caesium magnetometer. The survey consisted of twenty four (24) 18km long, NE-SW oriented (N-060OE) flight lines, totaling 432 line-km, that were obtained at 400m nominal line spacings over an approximately 9 x 18km area a (Figure 1c). The area was chosen because it hosts the well known Shea Creek uranium deposits, that include the Colette, Anne, 58B and Kianna Areas (Figure 1b), it is overlain by a significant thicknesses of Athabasca sandstone (700+ metres) cover, it hosts a major graphitic horizon at depth and alteration zone in the overlying sandstone, and has been the focus of extensive airborne and ground geophysical coverage (Nimeck and Koch, 2008).
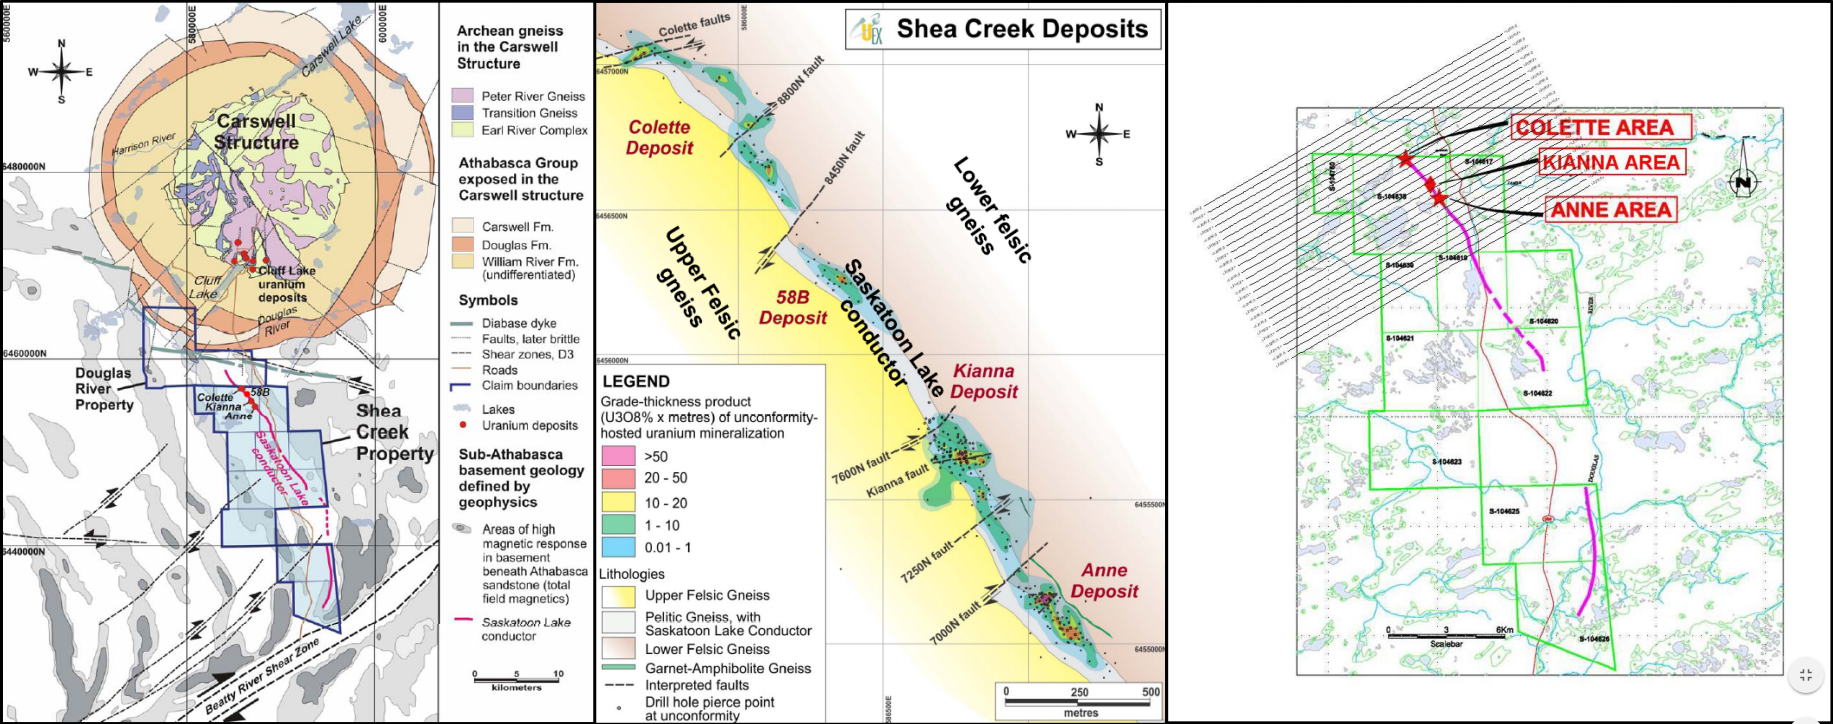
1 a) Shea Creek location and geologic setting (left) and b) Shea Creek geology (center; both after Rhys et al., 2010); and c) ZTEM test survey flight lines relative to Shea Creek uranium deposits (right; courtesy AREVA Resources (Canada) Ltd.)
Deposit Geology and Previous Geophysics
The Shea Creek deposit lies within the Carswell Structure (Fig. 1a). The deposit consists of up to four mineralized uranium zones (Anne, Kianna, 58B and Colette; Fig. 1b), with mineralization found either: perched within the Athabasca sandstone, at the unconformity between the sandstone and underlying crystalline basement, and also below the unconformity within the basement units. At Shea Creek, the unconformity depth varies between 710m and 750 m below ground level. The surface topography is quite variable with parkland areas intermingled with numerous lakes, streams, and low-lying, swampy areas. In the Shea Creek region, the Athabasca basement comprises a granulite facies metamorphic succession of upper felsic quartzo-feldspathic gneiss, middle aluminous (pelitic) gneiss, and lower felsic gneiss. The Athabasca Group cover rocks are dominated by fine- to coarse-grained, variously pebbly quartz arenites. The Shea Creek structural trend is defined by the Saskatoon Lake conductor (SLC), a northwest-southeast, graphitic zone which is interpreted to be a large-scale reverse (thrust) structure. Regional airborne geophysics (Fig. 2ab) indicate that the Shea Creek mineralized zones occur in a magnetic low adjacent to a linear EM response interpreted to represent conductive Aphebian metasedimentary basement rocks. Ground geophysics show that DC resistivity and AMT (Fig. 2cd) are effective at mapping structural zones and alteration haloes in the sandstone to depths between 700-1km+ (Nimeck and Koch, 2008).
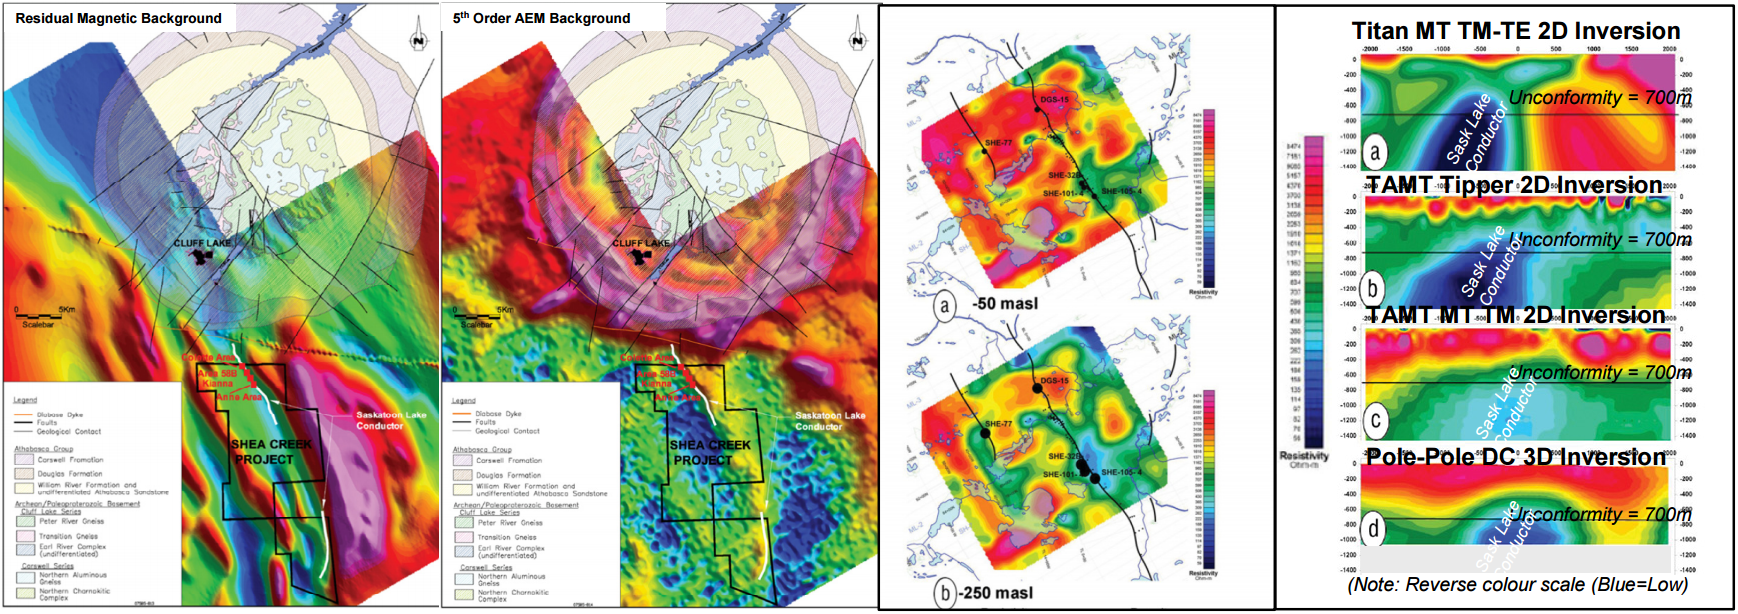
2 a) Shea Creek regional residual airborne magnetics, b) Apparent conductance derived B field airborne EM, c) Elevation slides of 3D pole-pole resistivity model at -50 masl, and -250 masl, and d) Resistivity cross-sections (note reversed colour-scale relative to ZTEM) for line 80+00 N obtained from (a) Titan 24 RLM TM, (b) TAMT Tipper, (c)TAMT TM, (d) DC resistivity inversion (modified after Nimeck and Koch, 2008).
ZTEM Tipper AFMAG Results
The In-line (Tzx) component of the In-Phase Tipper data are shown as 90-degree Phase-Rotated grids in Figures 3, with the high (360Hz) and low-frequency (30Hz) spectrum shown together, for depth-comparison purposes. The Tzx (In-Line) component results shown in Figure 3 are most sensitive to structures orientated perpendicular to the In-Line direction. Geologic and geophysical features of interest from Figure 1d are also shown as overlays. The Shea Creek test area ZTEM results, in particular, showcase the relatively good data quality, in terms of high signal/noise and well defined anomaly resolution. Particularly given the fact that a) the data were obtained in early April, and therefore not at the peak season of sferic activity – hence moderate field signal levels; b) the data were obtained using aircraft flying at ~80km/hr, and receiver clearance approximately 70m above ground level – hence without additional stacking or significant processing applied, and c) the strength of response obtained from geologic targets at >650-700+ metre depths.
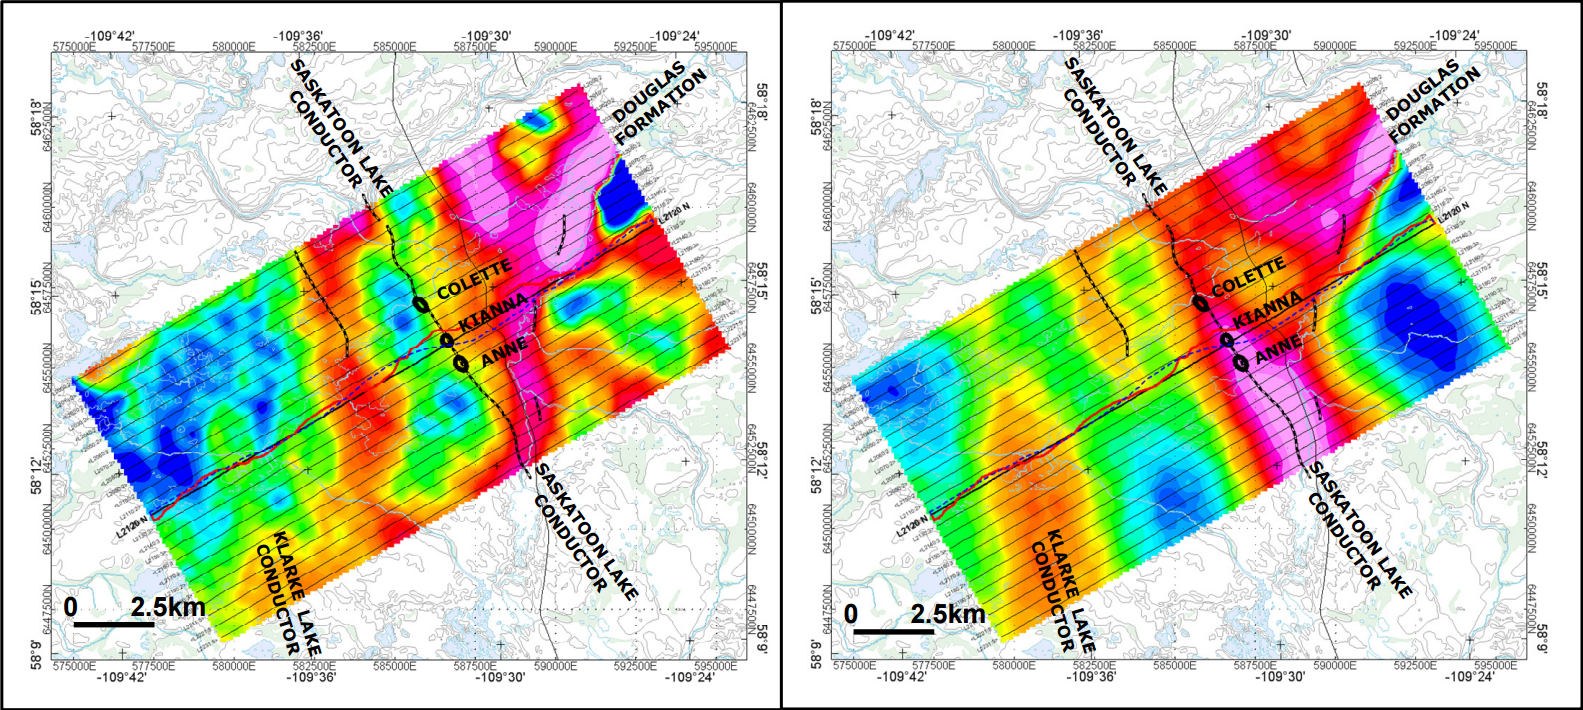
3) ZTEM Tipper AFMAG field results shown in plan as grid contours the Phase Rotated (PR) In-Phase ZTEM tipper data with Shea Creek deposit outlines: a) 360Hz high frequency IP PR (left) and b) 90Hz mid-frequency IP PR (right) showing resistivity contrasts (warm colours = resistivity lows; cool colours = resistivity highs) surrounding the Saskatoon Lake conductor (courtesy AREVA Resources (Canada) and UEX Corporation (2009).
The higher frequency Tzx results (Fig. 3 left) appear to be more strongly influenced by north-south drainage patterns, which reflects their shallower penetration (<1km); whereas the lower frequency Tzx results (Fig. 3 right) appear to most influenced by more NW-SE trending basement stratigraphies that occur at >650-700m depths. In particular, the strongest ZTEM response corresponds to the Shea Creek graphitic horizon that occurs in the center of the block, which agrees with the known geology. As well, to the northeast, a Vshaped low resistivity zone that is also observed in the high frequency data corresponds to an inlier of Douglas Formation mudstones, that lie at relatively shallow depth (<500m); the weakening response in the lower frequency ZTEM results appears to confirm that these Douglas mudstones are depth-limited, in comparison to the Shea Creek graphitic response. Figure 4 presents the resistivity crosssections derived from the 2D ZTEM inversion for L2120 across the known Kianna Zone uranium occurrence, which also roughly matches the location (L80+00N) of the inversion images obtained from ground data shown in Figure 2d. Comparisons between these sections shows the general agreement between the depth, dip of the Saskatoon Lake Conductor, including the overlying clay-alteration zone, and the presence of adjacent Douglas Formation mudstones rocks. The Klarke Lake conductor is also easily defined further west.
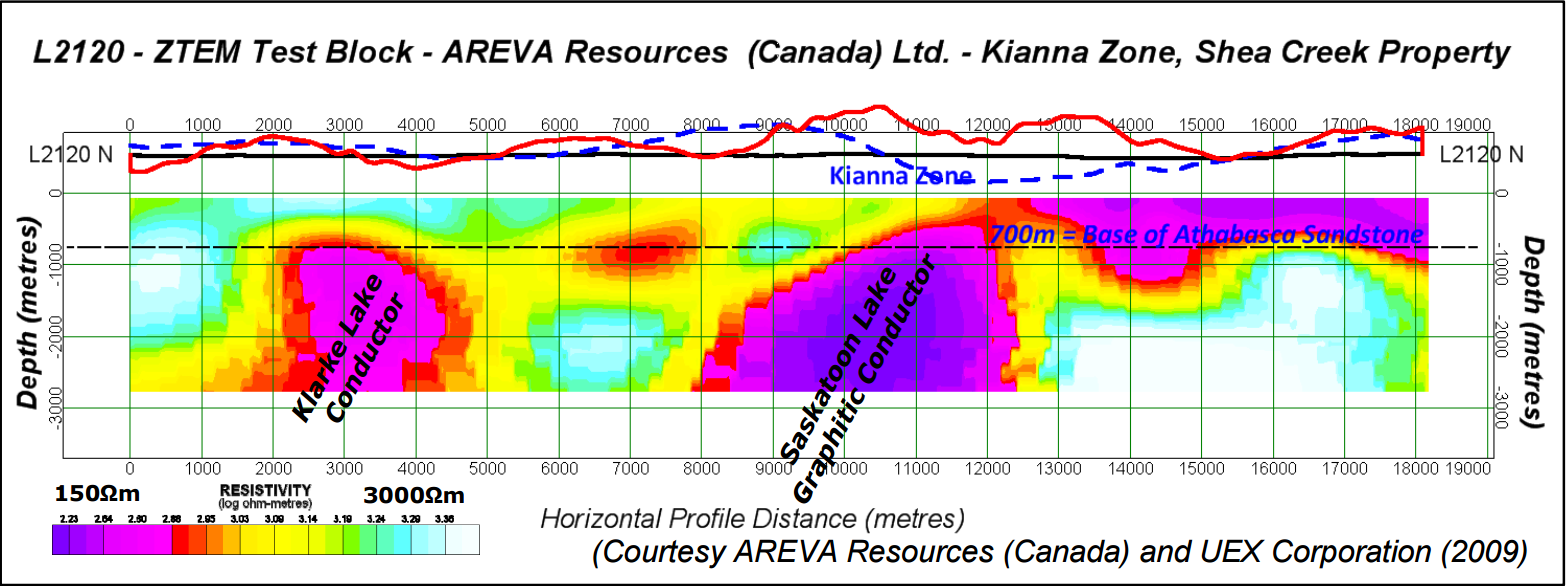
4) 2D Resistivity cross-section for L2120 (L80+00N) over centre of Kianna Zone deposit from 2D inversion of ZTEM In-line (Tzx) tipper data.