For a PDF of this paper click here
Summary
In November, 2009, Geotech Ltd. carried out a helicopter-borne geophysical survey for Hudbay Minerals Ltd. over the Lalor Lake polymetallic copper-zinc-gold volcanogenic massive sulphide deposit situated near Snow Lake, central Manitoba (Figure 1b), approximately 3km northwest of the Chisel North Mine. Principal geophysical sensors included the Z-axis Tipper Electromagnetic (ZTEM™) system and caesium magnetometer (Figure 1a). A total of 370 km were flown at a nominal line-spacing of 100-200m over a 66 km2 area. The objective of the ZTEM survey was test its ability to map the Lalor Lake VMS deposit, lying below 550m of volcanic cover, which has escaped detection in previous airborne geophysical surveys.
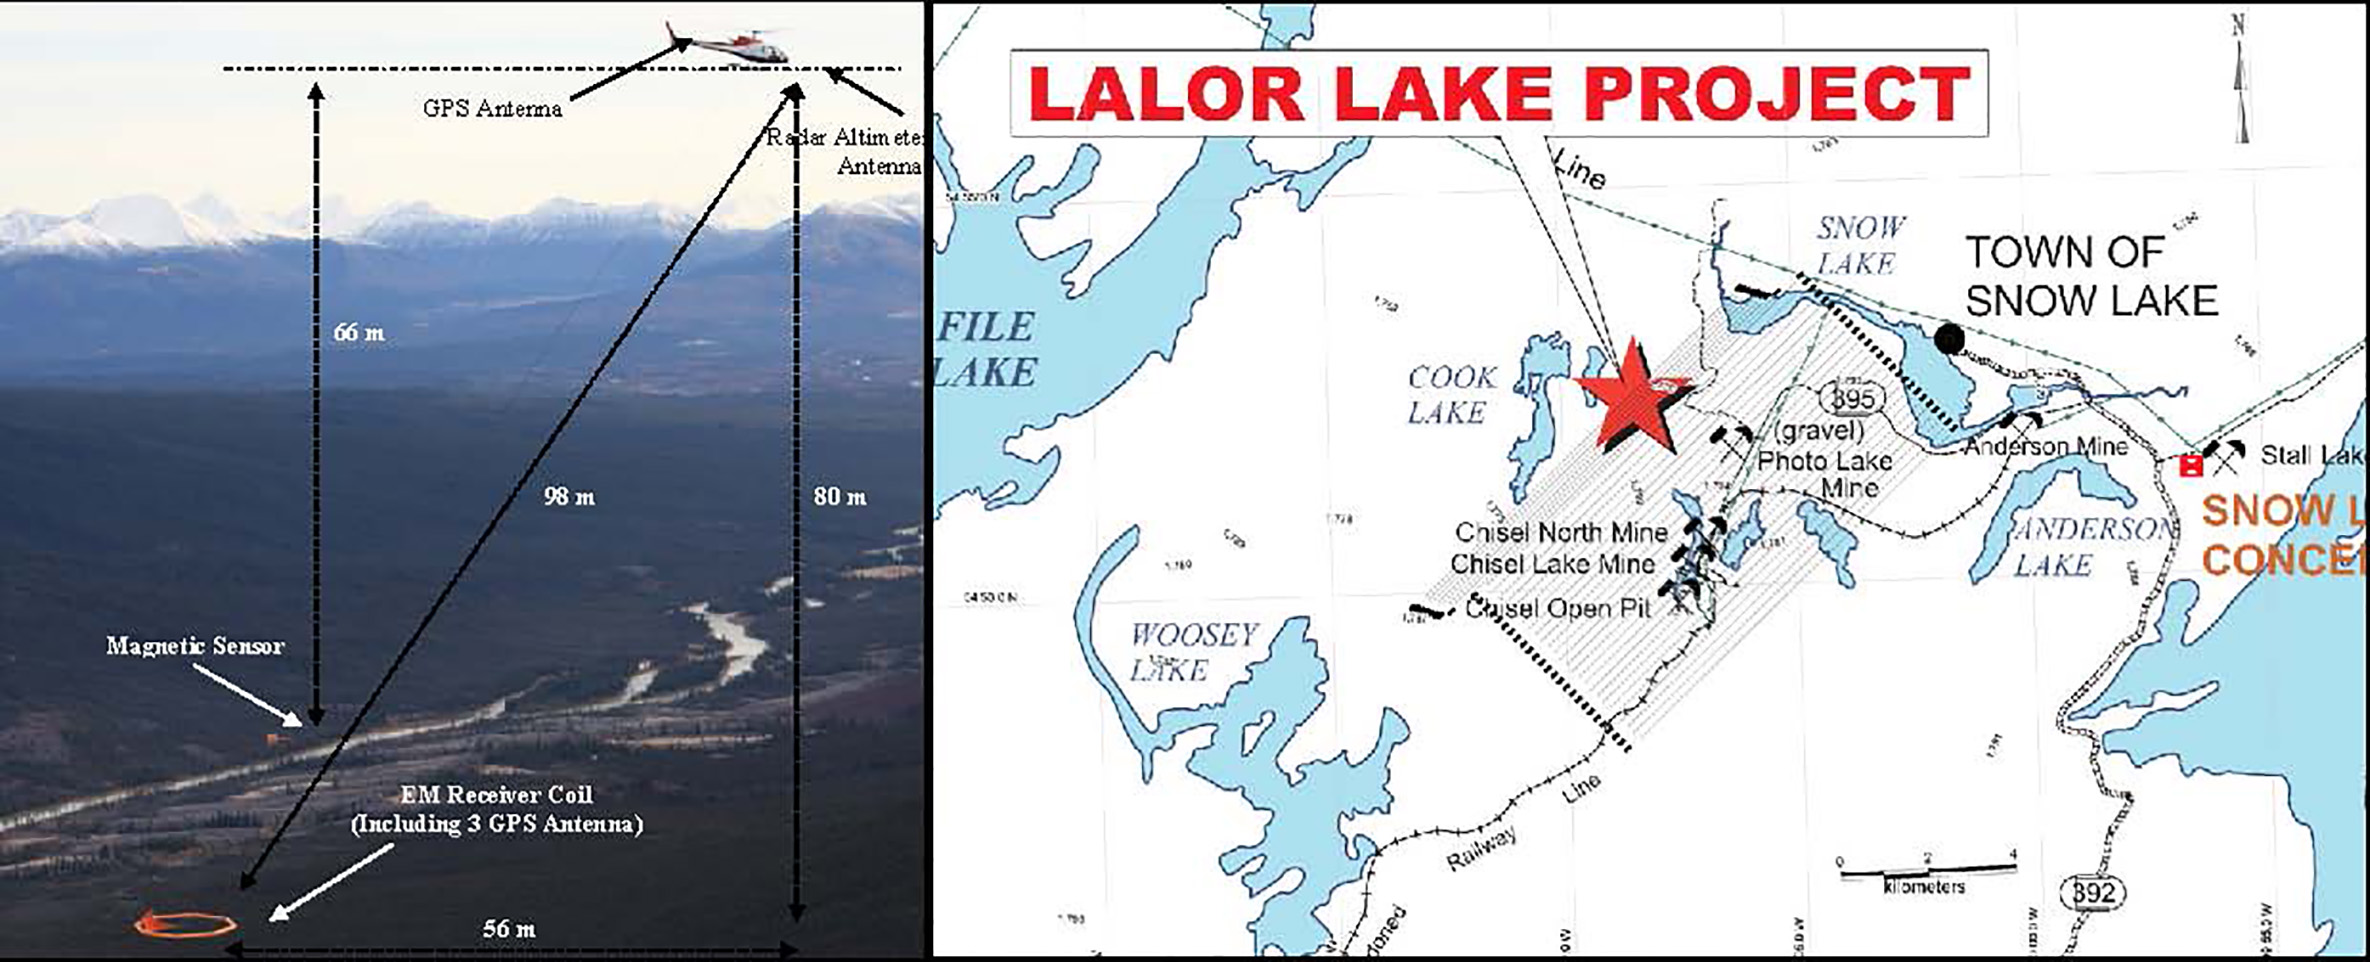
Figure 1: a) ZTEM helicopter receiver system (left) and b) Lalor Lake location with ZTEM flight lines (right – modified after Blakley, 2008).
Deposit Geology
The Lalor Lake deposit is situated in the Flin Flon Greenstone Belt and is a classic volcanogenic massive sulphide (VMS) deposit similar to other massive sulphide bodies in the Chisel sequence (Chisel Lake, Ghost-Lost Lake, Chisel North, and Photo Lake). Lalor Lake lies along the same stratigraphic horizon as the Chisel Lake and Chisel North ore bodies (Figure 1b). The Lalor Deposit was discovered in March 2007 by drill hole testing a ground fixed loop Time Domain electromagnetic anomaly that intersected high grade zinc mineralization at a depth of approximately 800 m below surface, approx. 3 km northwest of the Chisel North Mine. Mineralization occurs as massive to disseminated sulphides consisting of mainly of sphalerite, pyrite and chalcopyrite, with lesser galena and arsenopyrite. Rock units in the hanging wall include mafic and felsic volcanic rocks that have been overturned and are in unconformable possibly fault contact with the footwall rocks. The mineralization is immediately underlain by a thick zone of intense metamorphosed, hydrothermally altered rocks. The deposit dips shallowly to the northeast and occurs at depths between 550 m and 1200 m (Figure 2a). It has a lateral extent of about 900 metres in the north-south direction, and 700 metres in the east-west direction (Figure 2b). The zinc-rich base metal indicated resource of 12.3 Mt 1.6 g/t Au, 24.2 g/t Ag, 0.66% Cu, 8.70% Zn (Inferred resource 13.2 Mt 2.9 g/t Au, 34.1 g/t Ag, 0.70% Cu, 8.19% Zn) is geologically interpreted as six stacked lenses (Figure 2a). In addition, potential gold zones of 10.6-12.0 Mt 4.3-5.2 g/t Au, 30.0-33.0 g/t Ag, 0.40-0.60% Cu, 0.30-0.40% Zn occur in five other separate, disseminated mineralized zones (Ref. Gilmore et al., HBMS, from PDAC 2010 abstracts and Hudbay Minerals, from PDAC 2010 core shack notes).
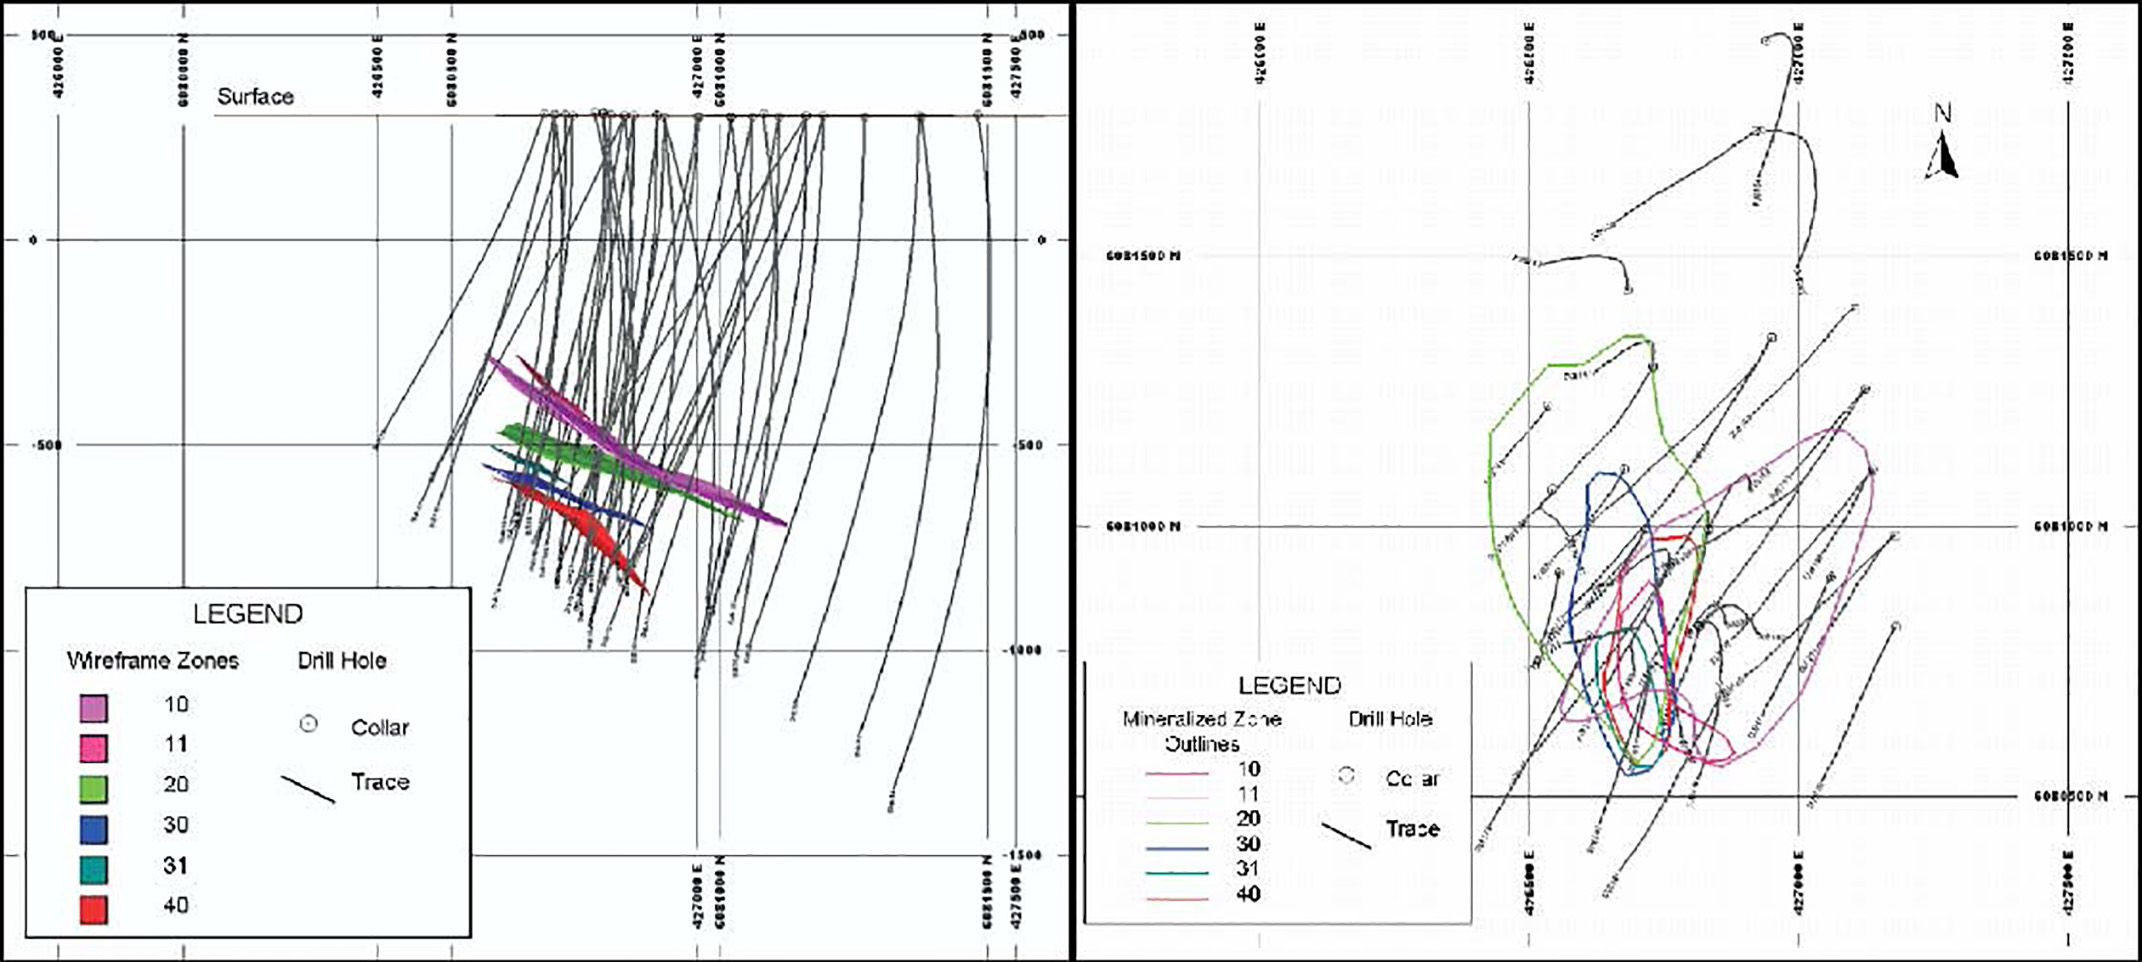
Figure 2: Lalor Lake Deposit drill holes and mineralized zone outlines in a) long section (left) and b) plan (right – after Blakley, NI 43-101, 2008).
ZTEM System
The ZTEM survey instrumentation consists of a single vertical-dipole receiver coil (7.4m dia.) that is towed roughly 80m below the helicopter (Figure 1a), at a 100m nominal flight height, and is flown over the survey area in a grid pattern, similar to other regional airborne surveys. Two orthogonal air-core horizontal axis coils (3.5m dia.) are placed close to the survey site to measure the horizontal EM reference fields. Data from the three coils are used to obtain the Z/X (In-line) and Z/Y (cross-line) AFMAG tippers, whose transfer functions (In-Phase & Quadrature) are derived at six frequencies in the 30 to 720 Hz band. ZTEM tipper AFMAG is recognized for its unique ability to map resistivity contrasts associated with lithology, structure and alteration that are typically associated with VMS and other similar deposits to great depths, exceeding 1-2km.
ZTEM Tipper AFMAG Results
Figure 3 presents the ZTEM tipper results in plan shown as Phase Rotated (PR) images (that convert the tipper cross-overs into peaks) of the In-line (Z/X) tipper In-Phase component, comparing the 360Hz (shallower penetration) and 30Hz (deepest) responses, with the outline of the Lalor Lake deposit and drill holes overlain. In the PR image, warm colours represent conductive structures and contacts; cool colours represent more resistive units. The Lalor Lake deposit is not well defined in the 360Hz high frequency data likely due to the limited skin depth penetration and poor relative contrasts in this depth range; whereas in the deeper, lowest frequency 30Hz image, the Lalor Lake deposit and alteration are better contrasted with the surrounding rocks. The effect of the NE-SW powerline to the Chisel mine is strongest in the 360Hz image, but the Chisel Lake horizon (center), a graphitic horizon (west) and mineralized horizon to the northeast (east) are easily resolved from high to low frequencies. Figure 4 present the 2D cross-sectional resistivity data results obtained from the 2D inversion of the In-Line (Z/X) ZTEM tipper data from the L1020 profile directly over Lalor Lake deposit (see Fig. 3) using Geotech’s proprietary Zvert2d code. The 2D inversion image defines a buried, north-east dipping conductive body from 500¬1000m depth, which is consistent with the known position and geometry of the Lalor Lake VMS deposit, as shown in Figure 4.
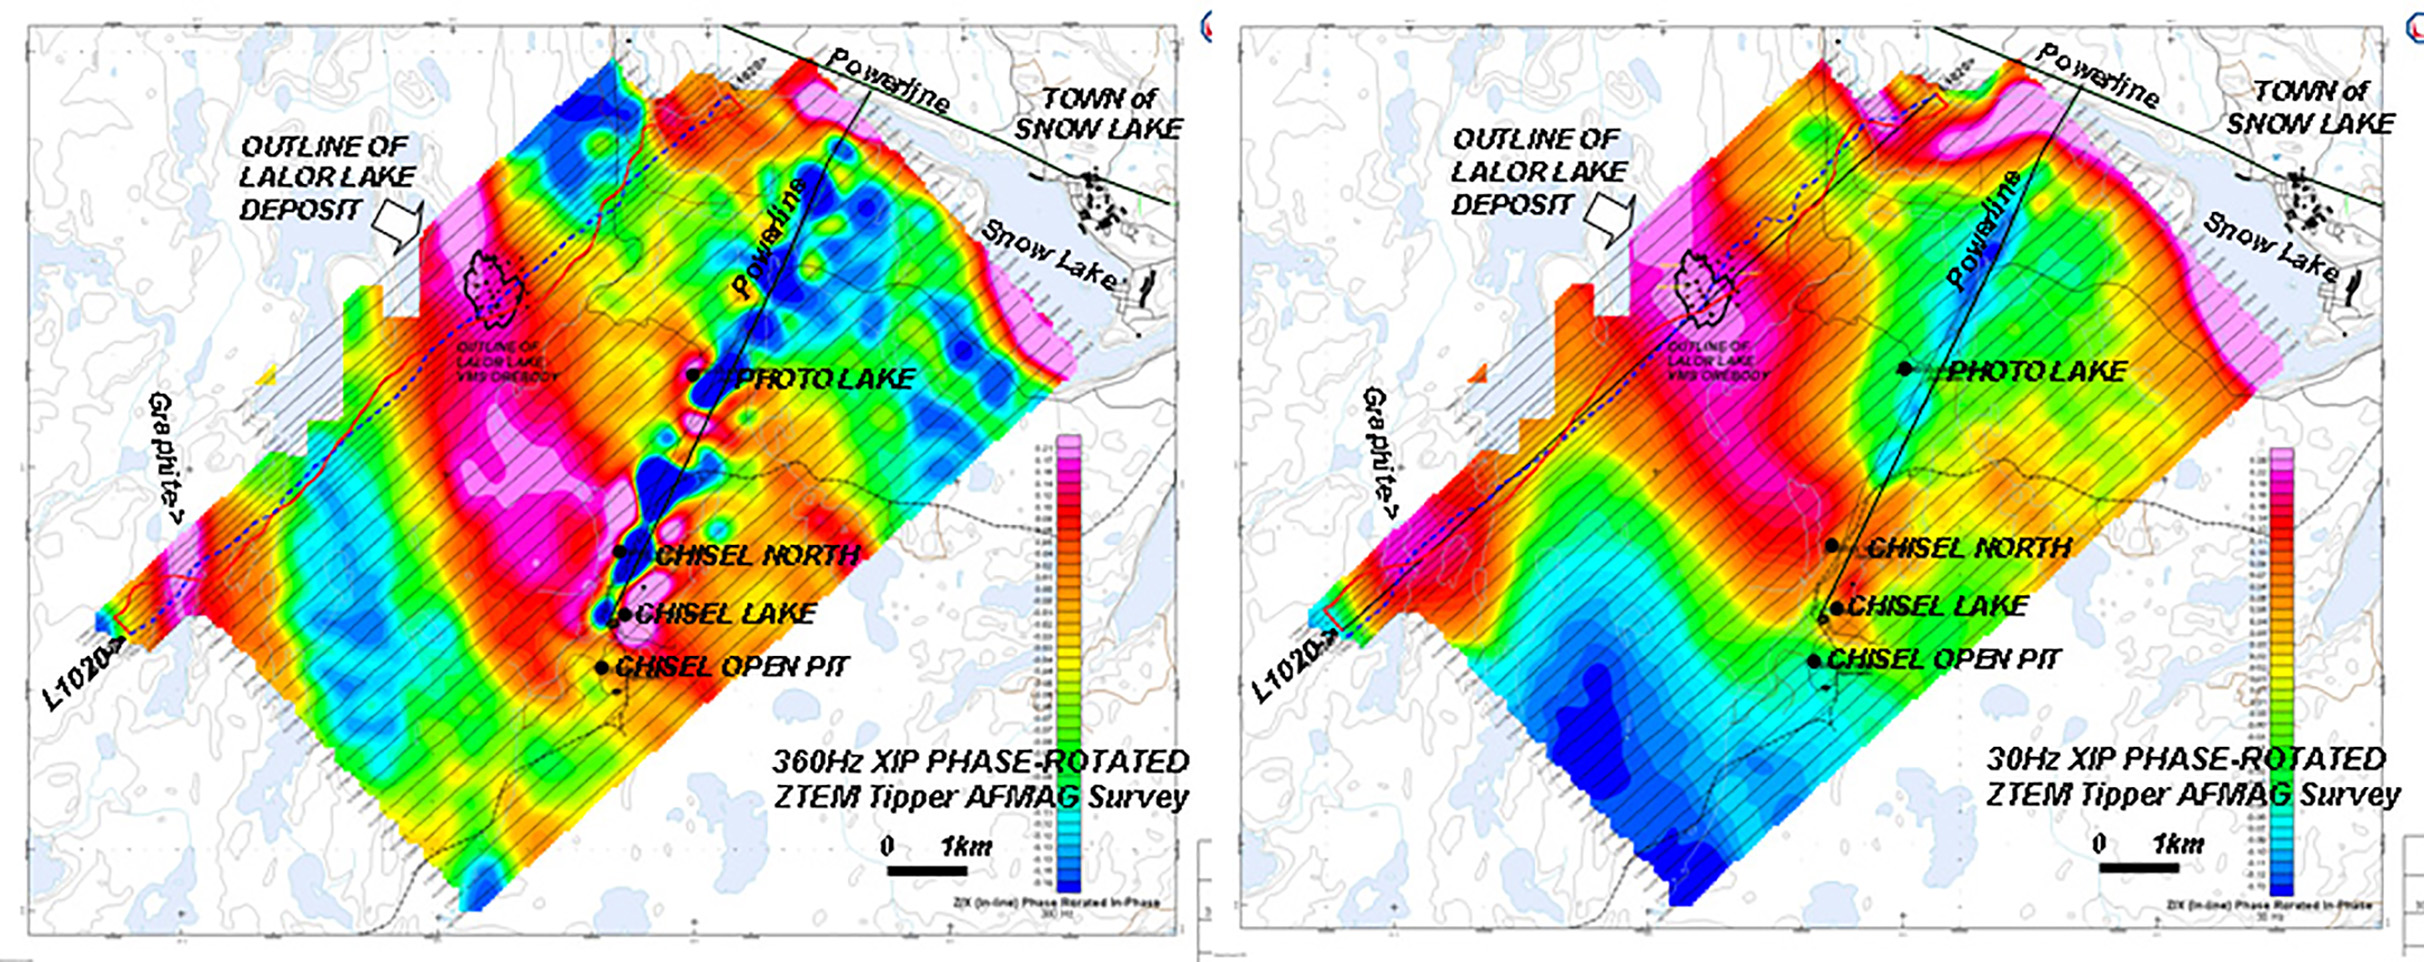
Figure 3: ZTEM Tipper AFMAG field results shown in plan as grid contours of 90-degree Phase-Rotated (PR) In-line (Z/X) In-Phase component at: a) 360Hz high frequency showing shallower penetration (left) and b) 30Hz low frequency showing deeper penetration (right) and Lalor Lake deposit outline.
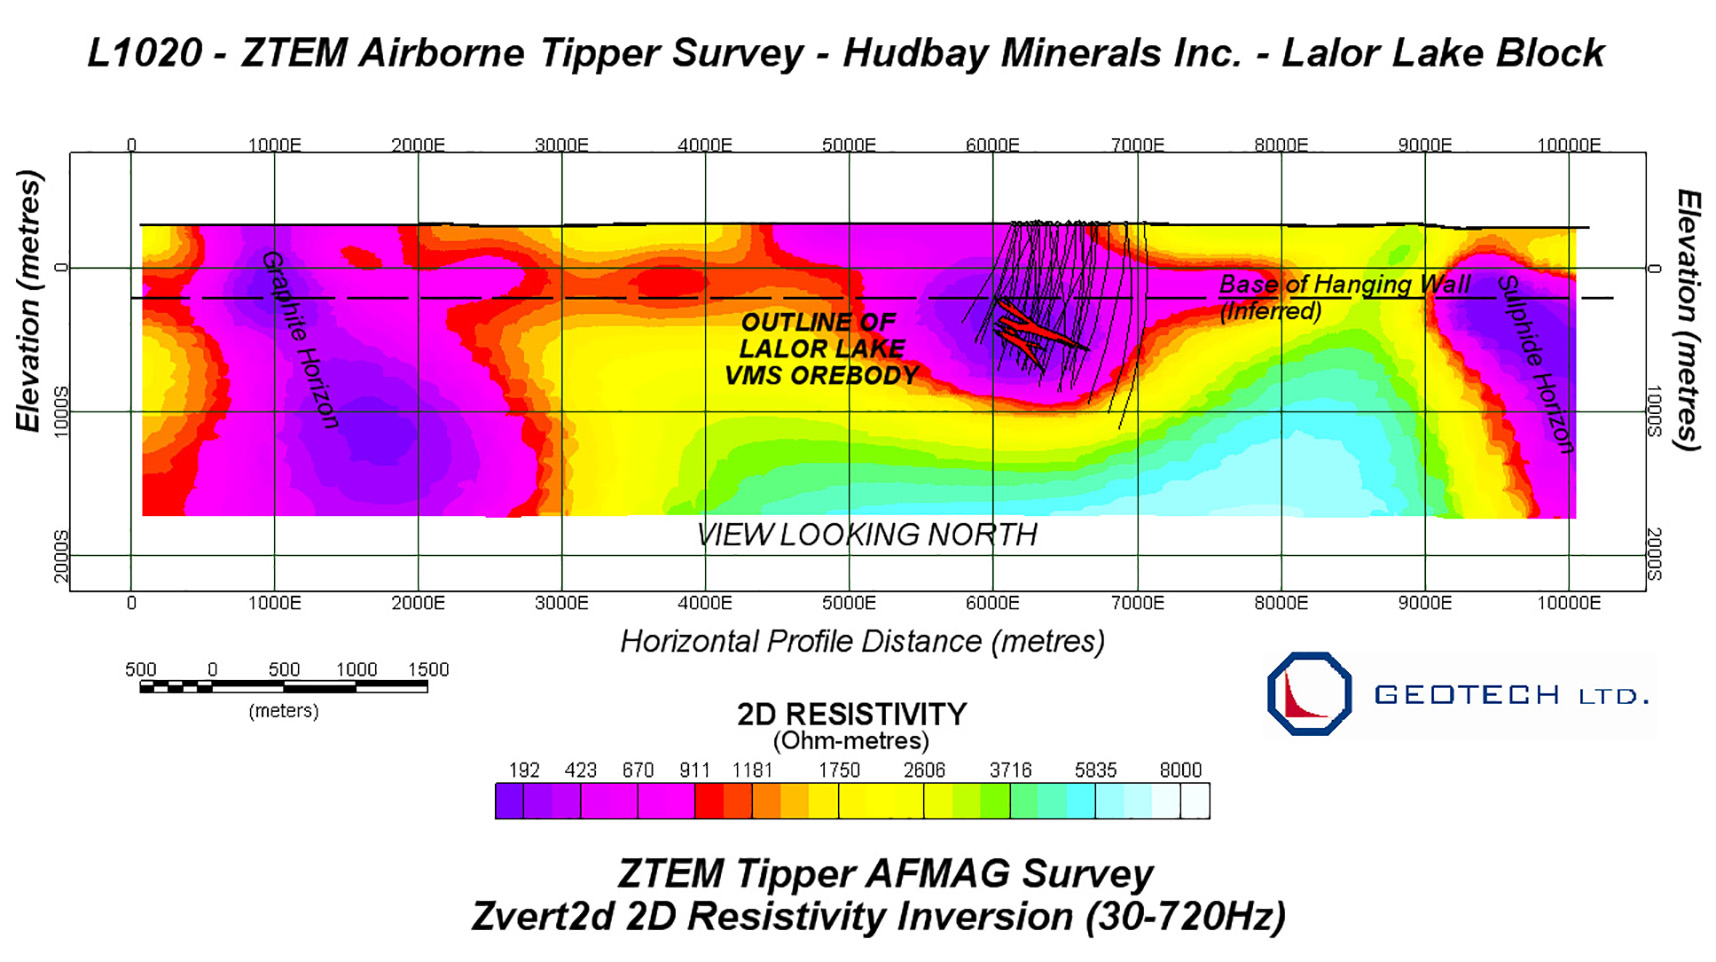
Figure 4: 2D Resistivity cross-section for L1020 over centre of Lalor Lake deposit from Zvert2d inversion of ZTEM In-line (Z/X) tipper data.