For a PDF of this paper click here
Presented at SEG 2009
Summary
An airborne AFMAG demonstration test survey was conducted using the ZTEM™ tipper electromagnetic prospecting system over an unconformity uranium occurrence in northern Saskatchewan, Canada. These tests were conducted in early 2008 and were flown to test the system’s capability to penetrate and define the basement geology below a thick sequence of Athabasca sandstones, as well as defining resistivity structure relating to possible fault-controlled alteration zones. The AFMAG method utilizes naturally occurring audio telluric fields from worldwide sferic activity as its primary field source and is capable of large penetration depths – in the order of hundreds of metres to km. The AFMAG field tests corroborate previous airborne transient electromagnetic and magnetic surveys, and the inferred geology. A 2D inversion algorithm has been developed to account for the air layer required for the ZTEM tipper data. The results agree with the known geology to below >500m.
Introduction
As part of a larger series of demonstration tests for the ZTEM (Z-Axis Tipper Electromagnetic) airborne AFMAG system (Lo and Zang, 2008; Lo et al., 2009), a survey was conducted over a test block situated in the North Athabasca Basin of northern Saskatchewan (Figure 1) in May, 2008. The test area was chosen because it hosts known uranium occurrences and hosts significant thicknesses of Athabasca sandstone (500-750+ metres) cover above a known basement graphitic conductor. It had been partially flown using VTEM (Witherly et al., 2004) and, due to the significant depth of cover, had proven challenging for ground and airborne geophysical methods (Lo et al., 2009). The current study presents the results of the survey and the 2-dimensional inversion solution for the quantitative interpretation of ZTEM airborne results.
General Theory
The ZTEM airborne AFMAG system measures the anomalous vertical secondary magnetic fields that are created by the interaction between naturally occurring, plane wave audio frequency EM fields and electrical heterogeneities in the earth. The vertical magnetic field is linearly related to the horizontal fields according to the following (Vozoff, 1972):
HZ = TXHX + TYHY
where the magnetic field vector T = (TX, TY), known as the tipper, is complex and a function of frequency, but has rotationally invariant properties, such as its magnitude and direction, that are independent of the subsurface, the measurement direction and the field polarization (Labson et al., 1985).
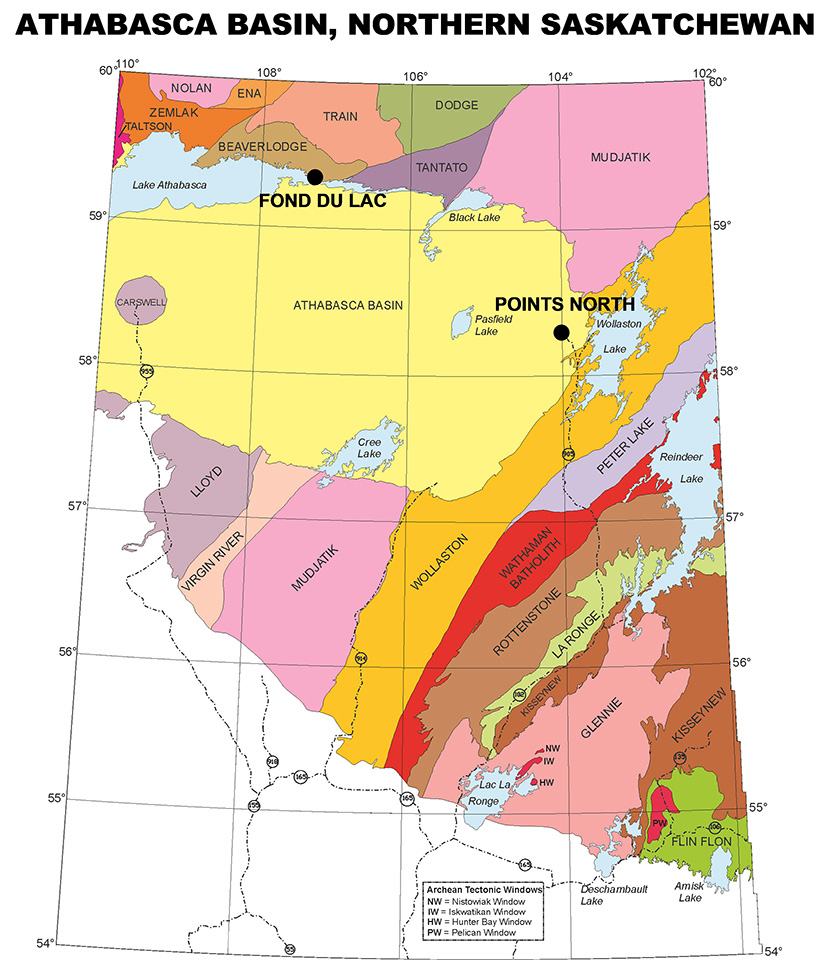
Figure 1: Athabasca Basin and regional geology in northern
AFMAG uses naturally occurring audio frequency magnetic fields as the source of the primary field signal, and therefore requires no transmitter (Ward, 1959). The primary fields resemble those from VLF except that they are lower frequency (tens & hundreds of Hz versus tens of kHz) and are not strongly directionally polarized (Labson et al., 1985). These EM fields used in AFMAG are derived from world wide atmospheric thunderstorm activity, have the unique characteristic of being uniform, planar and horizontal, and also propagate vertically into the earth – to great depth, up to several km, as determined by the magnetotelluric (MT) skin depth (Vozoff, 1972), which is directly proportional to the ratio of the bedrock resistivity to the frequency.
At the frequencies used for ZTEM, the investigation depths likely range between approx. 600m to 2km in this region (approx. 1k ohm-m avg. resistivity assumed), according to the following equation for the Bostick skin depth (Mura-kami, 1985):
δs = 356 * √(ρ / ƒ) metres
The other unique aspect of AFMAG fields is that they react to relative contrasts in the resistivity, and therefore do not depend on the absolute conductance, as measured using inductive EM systems, such as VTEM – hence poorly, conductive targets, such as alteration zones and fault zones can be mapped, as well as higher conductance features, like graphitic units. Conversely, resistive targets can also be detected using AFMAG– provided they are of a sufficient size and contrast to produce a vertical field anomaly. Indeed resistors produce reversed anomalies relative to conductive features. Hence AFMAG can be effective as an all-round resistivity mapping tool, making it unique among airborne EM methods.
The tipper from a single site contains information on the dimensionality of the subsurface (Pedersen, 1998), for ex-ample, in a horizontally stratified or 1D earth, T=0 and as such HZ is absent. For a 2D earth with the y-axis along strike, TY=0 and HZ = TX*HX. In 3D earths, both TX and TY will be non-zero. HZ is therefore only present, as a secondary field, due to a lateral resistivity contrast, whereas the horizontal HX and HY fields are a mixture of secondary and primary fields (Stodt et al., 1981). But, as an approximation, as in the telluric-magnetotelluric method (T-MT; Hermance and Thayer, 1975) used by distributed MT acquisition systems (Legault et al., 2008), the horizontal fields are assumed to be practically uniform, which is particularly useful for rapid reconnaissance mapping purposes. By measuring the vertical magnetic field HZ, using a mobile receiver (Figure 2), and the orthogonal horizontal HX and HY fields at a fixed base station reference site, ZTEM is a direct adaptation of this technique for airborne AFMAG surveying.
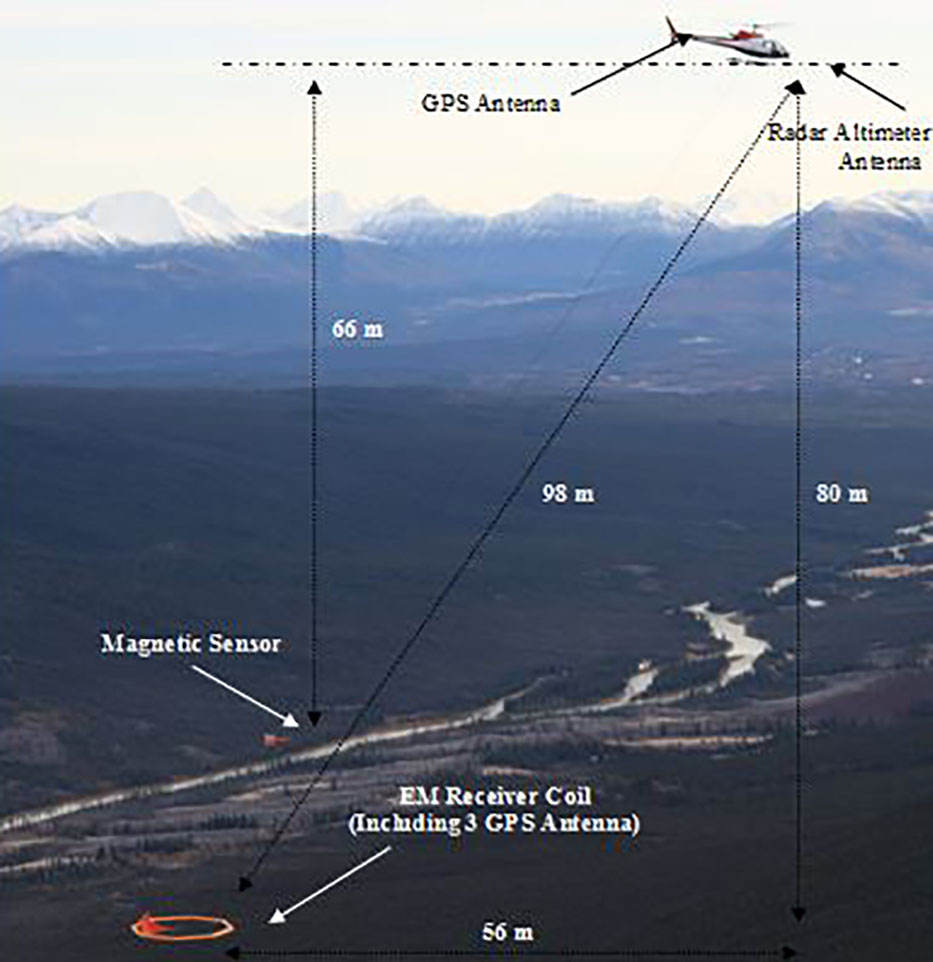
Figure 2: The ZTEM helicopter receiver system
Geophysical Background and General Geology
Uranium deposits within the Athabasca Basin are associated with the unconformity between the flat-lying Proterozoic Athabasca Group sandstones and the underlying Archean-Paleoproterozoic metamorphic and igneous basement rocks. They occur along basement faults and fracture zones above graphitic pelites. Since the uranium deposits themselves are relatively small and without significant physical property contrasts, except their density and radioactivity, geophysical exploration for unconformity type uranium targets below the sandstone focuses on the search for the conductive graphitic basement fault structures, using EM and magnetic methods (Mathews et al., 1997). More recently the focus has also been on the larger alteration halos of clay or silica enrichment around the deposits that produce either weak resistivity low or high signatures above the deposits (Powell et al., 2007) – making them difficult targets for inductive airborne EM (Lo et al., 2009).
The test area lies along the northern rim of the Athabasca Basin and entirely underlain by Manitou Falls sandstones with more conductive Wolverine Point mudstones outcrop-ping further the south. Within the survey area, the Athabasca sandstone thicken from approx. 550m to the north and dips to >700m depths towards the center of the survey area. At depth, below the Manitou Falls sandstones, the Archean basement geology hosts at least one major SW-NE graphitic EM conductor that is structurally controlled. This graphitic fault zone, that is a focus for uranium exploration, extends from the north into the center of the survey block, but eventually becomes too deep for ground or airborne EM detection but whose presence is inferred from regional magnetics.
The ZTEM survey objectives were to penetrate the thick sandstone cover to help define the deep basement geology, using the graphitic markers, as well as detecting possible alteration zones in the overlying sandstone.
AFMAG Survey Results
The ZTEM survey comprises airborne tipper AFMAG as well as aeromagnetics using a caesium magnetometer (Figure 2). The vertical (Z) component data were obtained using the Geotech ZTEM aircoil receiver system (Figure 2), suspended at approximately 85m elevation above ground level. The vertical component data (Hz) were then ratioed to fixed horizontal field measurements (Hx-Hy) obtained using identical reference coils, that were oriented in the in-line (X) and cross-line (Y) directions, in order to obtain the scalar tipper functions Z/X and Z/Y. The In-Phase and Quadrature components ZTEM field ratio data were obtained, using Fourier-based, digital signal processing analyses, at 5 frequencies, between 30Hz and 360Hz. The magnetometer was towed at approximately 100m above ground level (Figure 2).
The survey consisted of fifty-four (54) 11.5km long, NW-SE oriented flight lines, totalling 620 line-km, that were obtained at nominal 400m line spacings over an approximately 30 x 60km area. The North Athabasca test area ZTEM results, in particular, display a relatively high data quality, in terms of low signal/noise and well defined anomaly resolution. Particularly given the fact that a) the data were obtained in early May, and therefore not at the peak season of sferic activity – hence at best moderate natural field levels expected; b) the data were obtained using aircraft flying at ~80km/hr, approximately 80m above ground level – hence without significant stacking or additional processing applied, and c) the strength of response obtained from geologic targets at >500-700+ metre depths, below the sandstone cover.
The 90 Hz In-Phase Tipper (Z/X = In-line – Z/Y = Cross-line) profile data with corresponding 90-degree phase-rotated (PR) grids are presented in Figures 3. The phase rotations, designed to convert the typical cross-overs over tabular conductors to peak responses, are obtained using a simple magnetic pole-reduction grid manipulation (Lo and Zang, 2008). The 2ND vertical derivative of the airborne total magnetic intensity results are also compared to the ZTEM DT (total divergence) grid results in Figure 4. The DT (Kuzmin et al., 2005), that is analogous to Peaker parameter of Pedersen (1998), sums the horizontal derivatives of Z/X and Z/Y to obtain peak responses over conductors (and resistors) and is rotationally invariant.
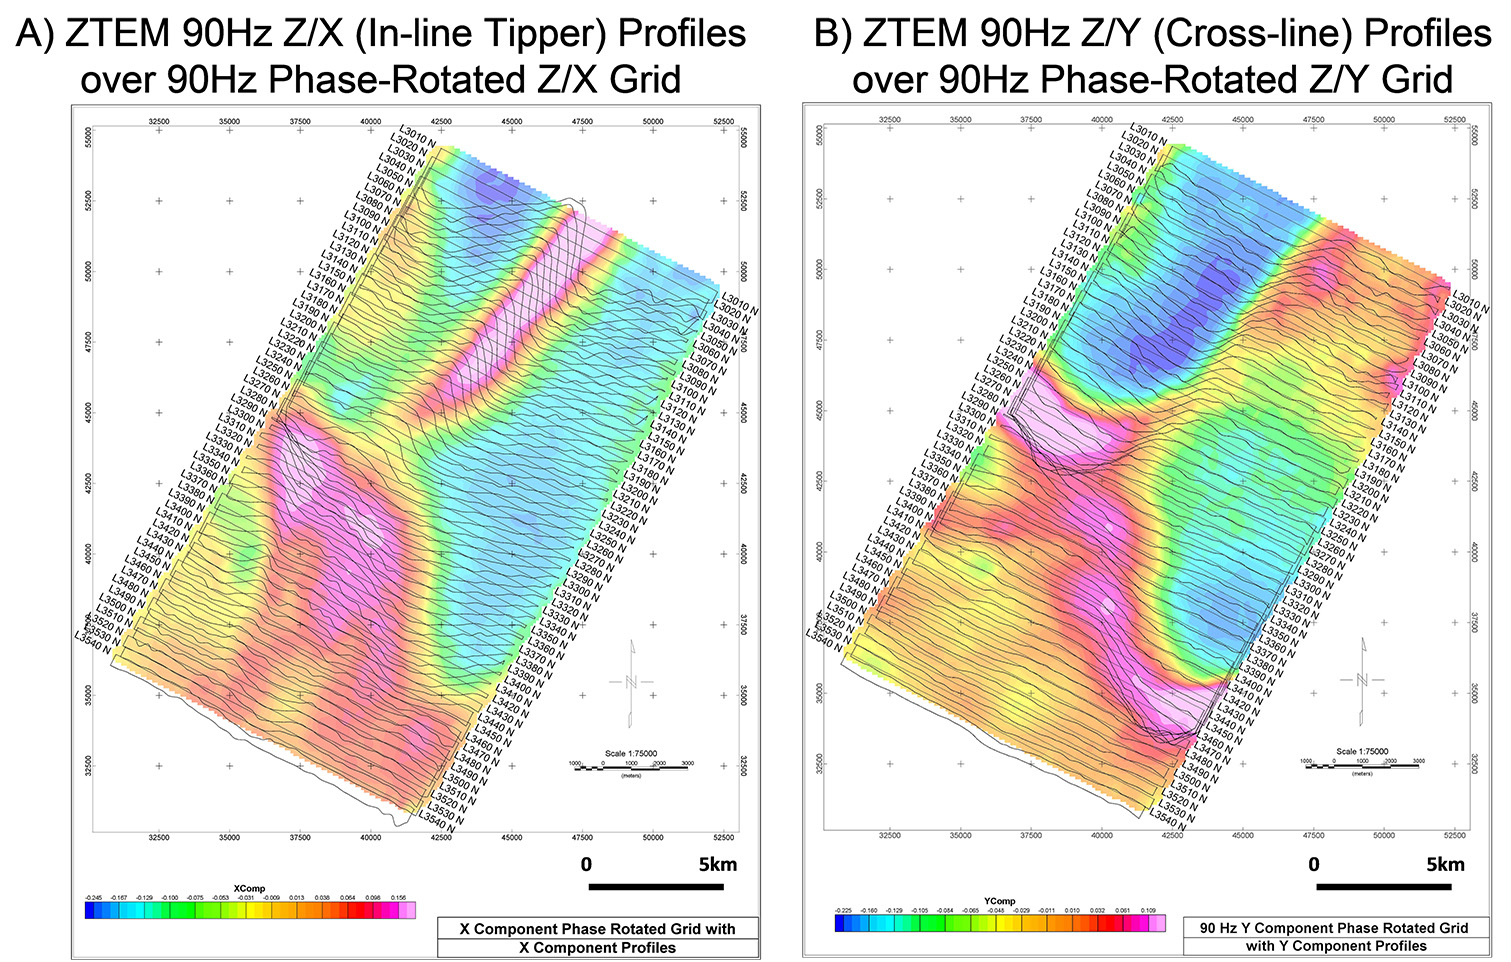
Figure 3: North Athabasca ZTEM test block: 90Hz In-Phase Z/X (in-line tipper) component profiles and phase-rotated (PR) grid contour (left) versus corresponding In-Phase Z/Y (cross-line) profiles PR grid (right).
There are distinctive differences observed between the Z/X (In-Line) component profile results (Figure 3a), which are most sensitive to structures orientated perpendicular to the In-Line direction, versus the Z/Y (Cross-line) component profiles (Figure 3b), which are sensitive to structures oriented oblique/parallel to the In-Line flight direction. When the 2 Tippers are combined, using either the PR or DT grid methods, as shown, the imaging of geoelectric structures becomes omni-directional, with all orientations being highlighted.
In this North Athabasca test area, the DT results (Figure 4a) highlight a well-defined conductor associated with the known main NE-SW orientated graphitic fault zone, extending from the north whose depth increases from 500 to >750m depths; whereas they also define other oblique-to-flight-line NW-SE oriented features – notably: a) the inference of a synformal fold structure in the central survey area, and b) a possibly NNW-SSE oblique shear zone-hosted, alteration zone, in the south-central survey area, where the numerous radioactive indicators are found and the geology is inferred to exceed 700-900m. These features are not as well defined in the magnetic results (Figure 4b).
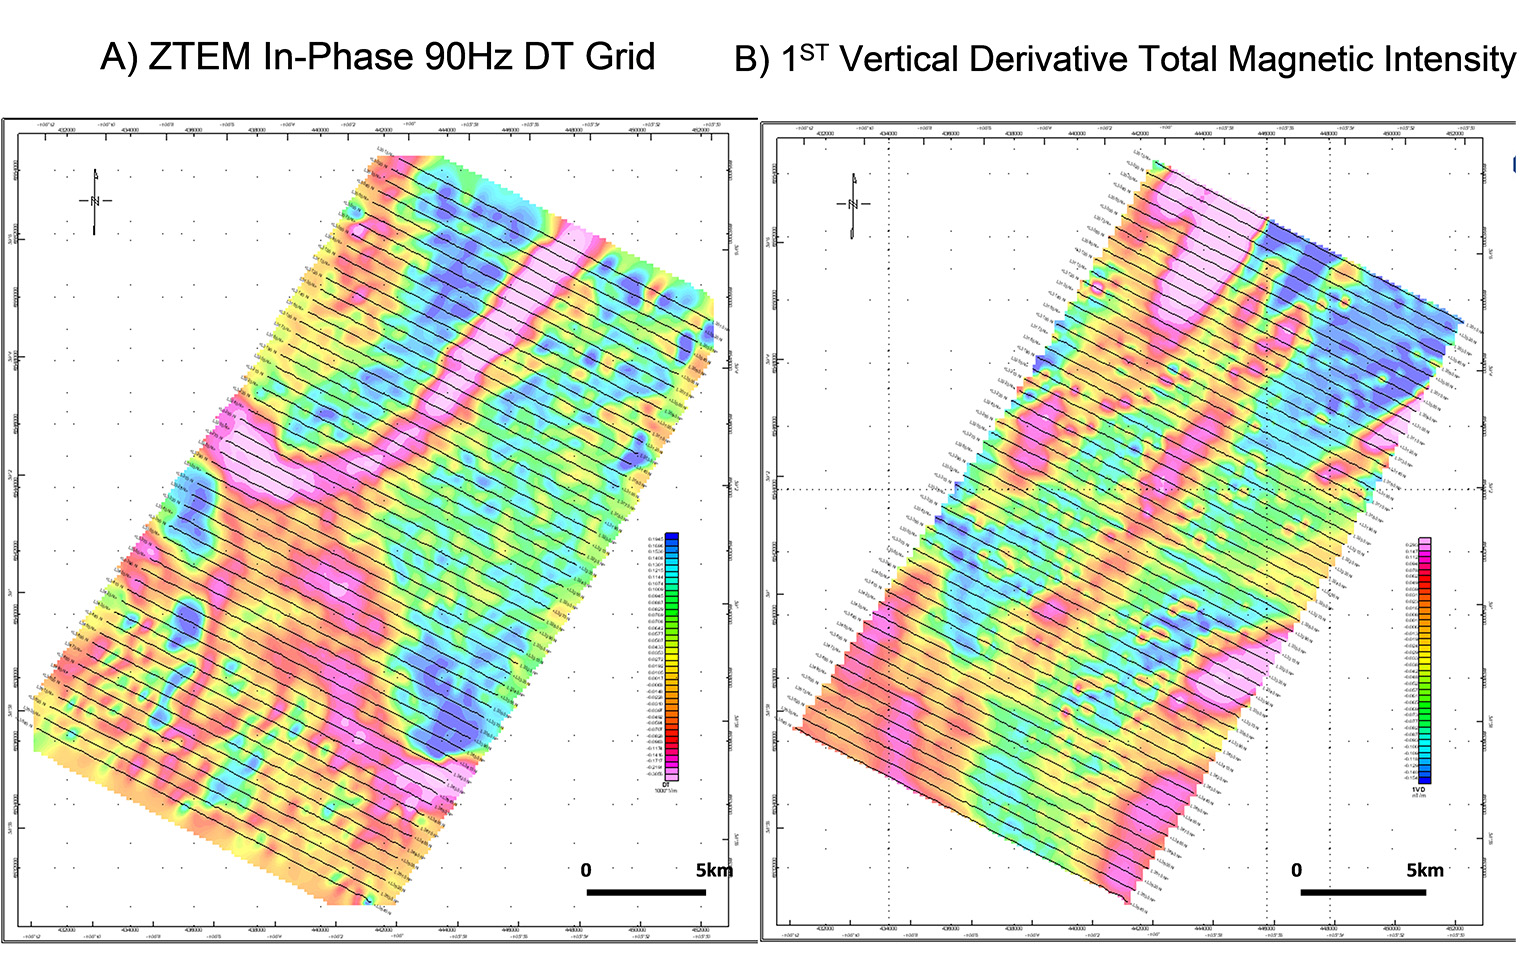
Figure 4: North Athabasca ZTEM test block: 90Hz In-Phase total divergence (DT) Grid (left) versus 1ST vertical derivative of total magnetic intensity (right).
2-Dimensional Forward and Inverse Problem
The performance of a two-dimensional (2-D) inversion of ZTEM data profiles using a prototype algorithm developed from MT was tested using a synthetic structure and example data profiles from the ZTEM system. The ZVERT2D algorithm makes use of the finite element forward problem and inversion parameter sensitivities using reciprocity of Wannamaker et al. (1987) and de Lugao and Wannamaker (1996), together with the regularized Gauss-Newton non-linear parameter step estimate described by Tarantola (1987). The regularization is simple damping of the spatial slope of the model variation across the section. All models were run on a desktop Pentium with 3 GHz processor, most required ~5500 parameters to define the 2-D section, and took ~20 minutes to execute. Airborne receiver positions were simulated by imposing an ‘overburden’ layer with air properties (1018 ohm-m) of equal thickness to flight height and constraining the inversion mesh to lie below this layer.
To gauge the utility of inversion of ZTEM data, the response of a known structure is computed and an image formed by Zvert2d. The body is a 5 ohm-m brick 360 m deep in a 1000 ohm-m half-space host (Figure 5a). The brick is 600 m wide and 420 m thick. MT tipper responses (Figure 5c) were calculated at the 5 frequencies of the ZTEM system for 91 sites at 100 m intervals centred over the body and assigned uncertainty intervals of 0.02 (2%) (dimensionless). Because this is a prototype examination, the algorithm was not modified to consider fixed ground coil locations, but rather used H-fields local to the HZ receiver as in traditional MT. This is not considered a major variation for the purposes of this study. The 2d inversion considers that the host resistivity is known (1000 ohm-m). Nevertheless, the formed inversion images overall are quite promising. In Figure 5b, we see that the inversion image is accurately located when the profile is positioned 300 m above the surface. The image is of somewhat lower contrast and more spread out as expected, but is still well centered.
The In-line (Z/X) data for a line profile, taken from the north end of North Athabasca Lake test block, were used to create the 2D inversion image presented in Figure 6a.
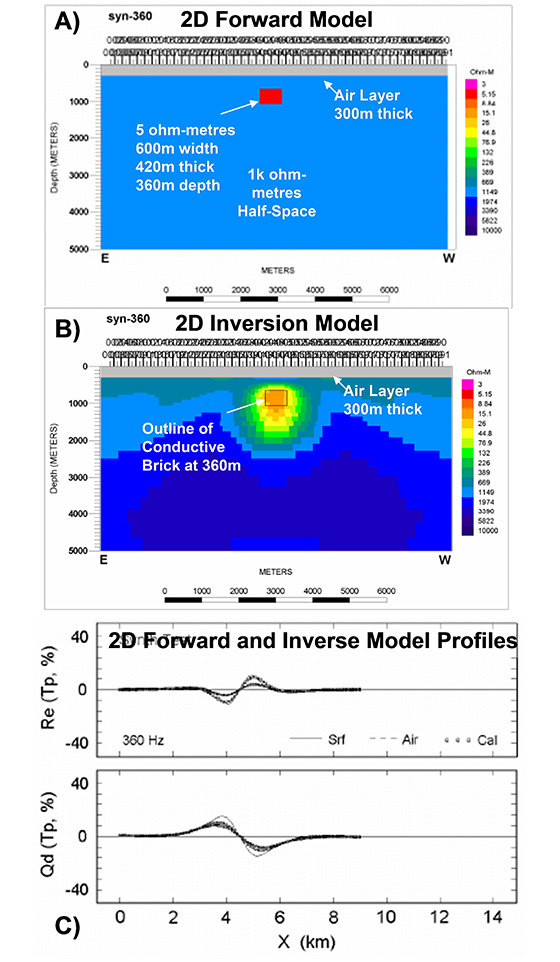
Figure 5: a) Calculated 2D forward and b) inverse model responses for In-Line (Z/X) IP and QP components over buried conductor in resistive half space. The gray region is a 300 m thick air layer. c) Synthetic data and inversion model responses at 360Hz for Z/X response profile at surface (solid curves) and 300 m in the air (dashed curves). Small open squares are the inversion fits.
The input data utilized both the In-Phase and Quadrature Phase data from all five measured frequencies. Due to the impractical nature of the >1000 data points from the ZTEM profile, these were under sampled to 90 points in order to perform the calculation and proved effective. An error of 2% was assigned to the data for inversion. A host of 1000 ohm metres was assumed for the model. Despite non-ideality of the data error, a value of nRMS of close to unity (1.0) was achieved in 4-6 iterations with starting nRMS values of 5-6.
Figure 6 presents the 2D resistivity cross-section obtained from the Zvert2d inversion and the corresponding In-Phase and Quadrature profiles showing the measured vs. 2D for-ward model data fits at 360Hz. As shown, although the anomaly appears at first like a simple but strong cross-over response, the inversion image is surprisingly detailed and appears to accurately describe the inferred geology. The host to conductive anomaly has moved during the inversion to be considerably higher than 1000 ohm-m. This is believed to have helped deepen the vertical extent of the anomaly to lower frequencies by increasing contrast. The top of the conductor occurs at 500m, which is geologically accurate. The bedrock conductor is mildly arcuate downward with some asymmetry and dips to the east. The conductive near-surface layer’s 400-500m thickness is also consistent with the known geology.
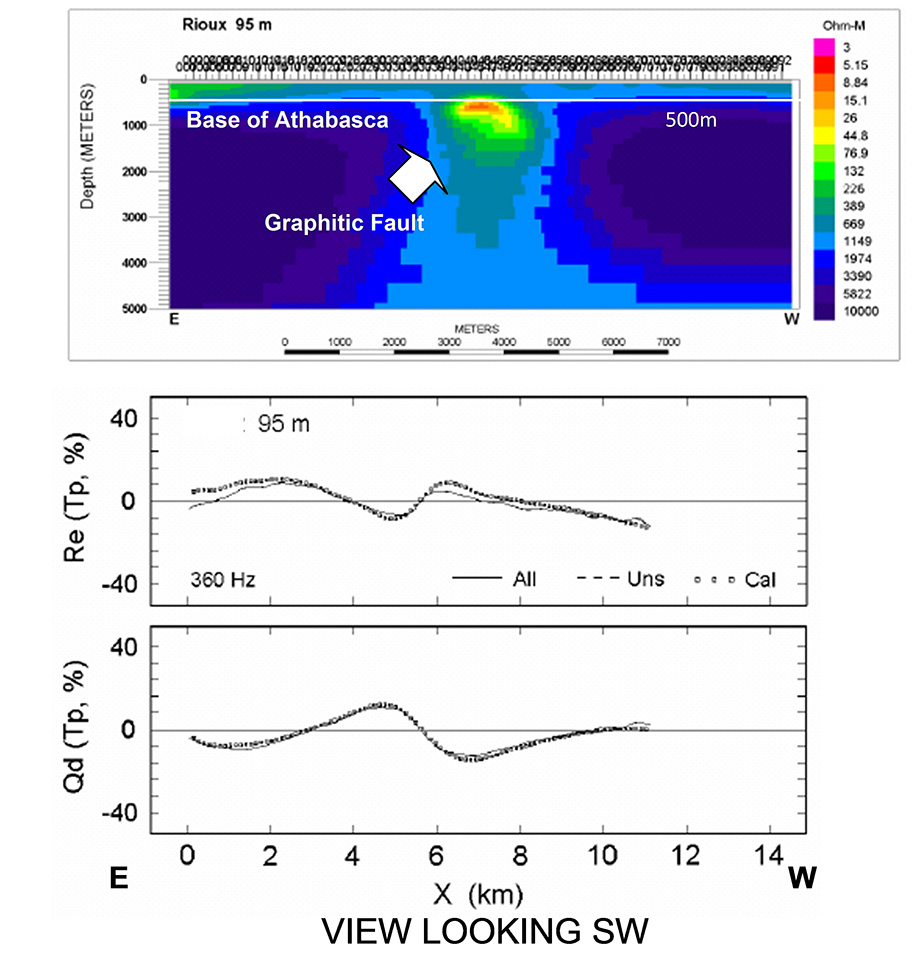
Figure 6: Above: 2D inversion image for ZTEM flight line 95m above the ground; below: Observed (solid curves) and computed 2D inversion model responses (open squares) for 95m ZTEM line.
Conclusion
The ZTEM test results performed over an unconformity-type uranium target appear to correlate very well with the known geology, in particular the presence of a graphitic conductor that is known to occur at depths exceeding 500-750m. In addition, the ZTEM results appear to explain/corroborate changes in the geologic strike in the deeper, more thickly sandstone-covered portions of the survey area. In particular, the ZTEM results point to the presence of a synformal conductive structure, that relates to the graphitic fault zone, in the central survey area, as well as a weak NNW-SSE oriented low resistivity zone inferred to occur in the shallower sandstone cover rocks, which correlates with geochemical anomalies and potentially relates to a shear-hosted alteration zone.
The 2D inversion using the Zvert2d algorithm appears to have been able to compute accurate ZTEM responses in the air and to invert them for reasonable earth resistivity cross section in this region of the North Athabasca Basin. Provided approximate constraints on the host resistivity are available, inversion anomaly positions are more accurate. With poor constraints, trials with a variety of host resistivities are required to judge their dependency.
Acknowledgements
The authors would like to thank Geotech and the mining company involved for allowing us to present these results, as well as Bill Doerner for his involvement in the 2d study.
References
De Lugao, P. P., and Wannamaker, P. E., 1996, Calculating the two-dimensional magnetotel¬luric Jacobian in finite elements using reciprocity: Geophys. J. Int., 127, 806-810.
Hermance, J.F., and Thayer, R.E., 1975, The telluric-magnetotelluric method, Geophysics, 37, 349-364.
Kuzmin, P., Lo, B., and Morrison, E., 2005, Final report on modeling, interpretation methods and field trials of an existing proto-type AFMAG system, Miscellaneous Data Release, 167, Ontario Geological Survey.
Labson, V. F., A. Becker, H. F. Morrison, and U. Conti, 1985, Geophysical exploration with audio-frequency natural magnetic fields: Geophysics, 50, 656–664.
Legault, J.M., Carriere, D., and Petrie, L., 2008, Synthetic model testing and distributed acquisition dc resistivity results over an unconformity uranium target from the Athabasca Basin, northern Saskatchewan, The Leading Edge, 27, 46-51.
Lo, B., and Zang, M., 2008, Numerical modeling of Z-TEM (airborne AFMAG) responses to guide exploration strategies, SEG Expanded Abstracts, 27, 1098-1101.
Lo, B., Legault, J.M., Kuzmin, P., 2009, Z-TEM (Airborne AFMAG) tests over unconformity uranium deposits, Extended abstract submitted to 20TH ASEG International Geophysical Conference & Exhibition, Adelaide, AU, 6 pp.
Matthews, R., Koch, R. and Leppin, M., 1997, Advances in Integrated Exploration for Unconformity Uranium Deposits in Western Canada; Proceedings of Exploration 97: Fourth Decennial International Conference on Mineral Exploration, edited by A.G. Gubins, Prospectors and Developers Association of Canada, Toronto, p. 993-1024.
Murakami, Y. 1985, Short Note: Two representations of the magnetotelluric sounding survey, Geophysics, 50, 161-164.
Pedersen, L.B., 1998, Tensor VLF measurements: Our first experiences, Exploration Geophysics, 29, 52-57.
Powell, B., Wood, G., and Bzdel, L., 2007, Advances in geophysical exploration for uranium deposits in the Athabasca Basin, Proceedings of Exploration 07: Fifth Decennial International Conference on Mineral Exploration, edited by B. Milkereit, p. 771-790.
Stodt. J.A., Hohmann, G.W., and Ting, S.C., 1981, The telluric-magnetotelluric method in two- and three-dimensional environ-ments, Geophysics, 46, 1137-1147.
Tarantola, A., 1987, Inverse problem theory, Elsevier, New York, 613 pp.
Vozoff, K., 1972, The magnetotelluric method in the exploration of sedimentary basins, Geophysics, 37, 98–141.
Wannamaker, P. E., Stodt, J. A., and Rijo, L., 1987, A stable finite element solution for two dimensional magnetotelluric modeling: Geophy. J. Roy. Astr. Soc., 88, 277-296.
Ward, S. H., 1959, AFMAG—Airborne and ground: Geophysics, 24, 761–787.
Witherly, K., Irvine, R., and Morrison, E.B., 2004, The Geotech VTEM time domain helicopter EM system, SEG Expanded Ab-stracts, 23, 1217-1221.