For a PDF of this paper click here
Summary
ZTEM™ airborne electromagnetic surveys over the Copaquire porphyry deposit, in northern Chile, were designed to map its alteration and structure due resistivity contrasts, to depth, based on successful applications of the method in north America. ZTEM™ is an airborne variant of the AFMAG passive EM method whose source fields are related to world-wide thunderstorm activity. The ZTEM™ results over Copaquire appear to map the resistive potassic alteration associated with known Marta and Cerro Moly porphyries, below the surficial secondary enrichment layer and extending to depth. These are in turn surrounded by more conductive, barren pyrite-rich phyllic and propyllitic alteration. Over the other two known mineralized prospects, at Sulfato North and South, the ZTEM™ results are different, with more resistive rocks at surface becoming more conductive at depth – perhaps reflecting a different geologic setting. Overall, these results are consistent with ZTEM™ results obtained over other, similar calc-alkalyne porphyry systems and also agree with the known geology.
Introduction
In December 2010, Geotech Ltd conducted a ZTEM™ helicopter-borne geophysical survey for International PBX Ventures Ltd (Vancouver, BC) on its Copaquire Project, in northern Chile (Figure 1). The Copaquire project hosts a porphyry system with mineralized zones enriched in copper, molybdenum and rhenium. The project is situated in one of the most productive copper belts in the world, with operating porphyry copper mines, such as Quebrada Blanca and Collahuasi, located nearby.
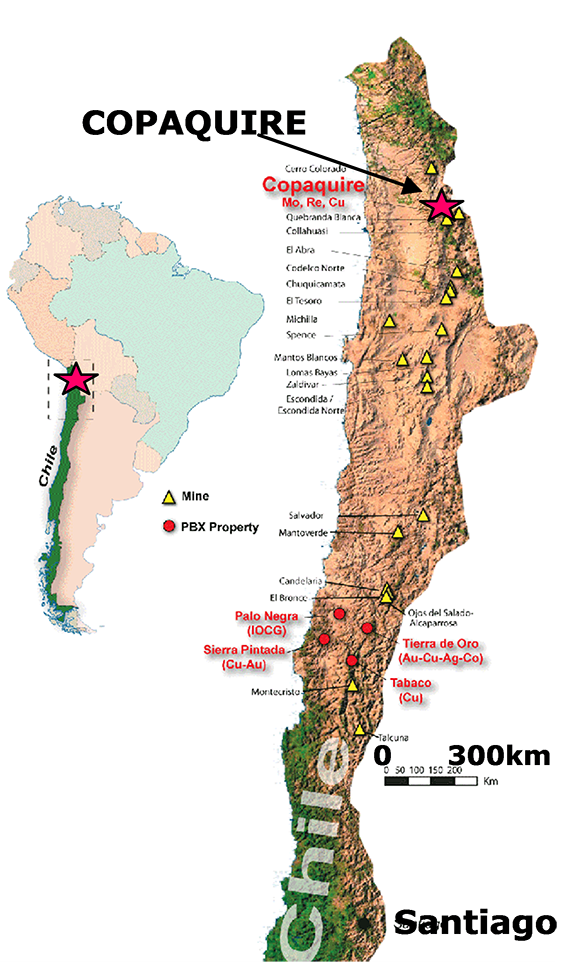
Figure 1: Copaquire Property Location in northern Chile (courtesy International PBX Ventures Ltd.).
The objectives of the ZTEM™ survey over Copaquire were: a) to map the known porphyry deposits and potential prospects from surface to depth, based on resistivity contrasts, b) as a survey comparison against previous ground MT results obtained on the property (Figure 2).
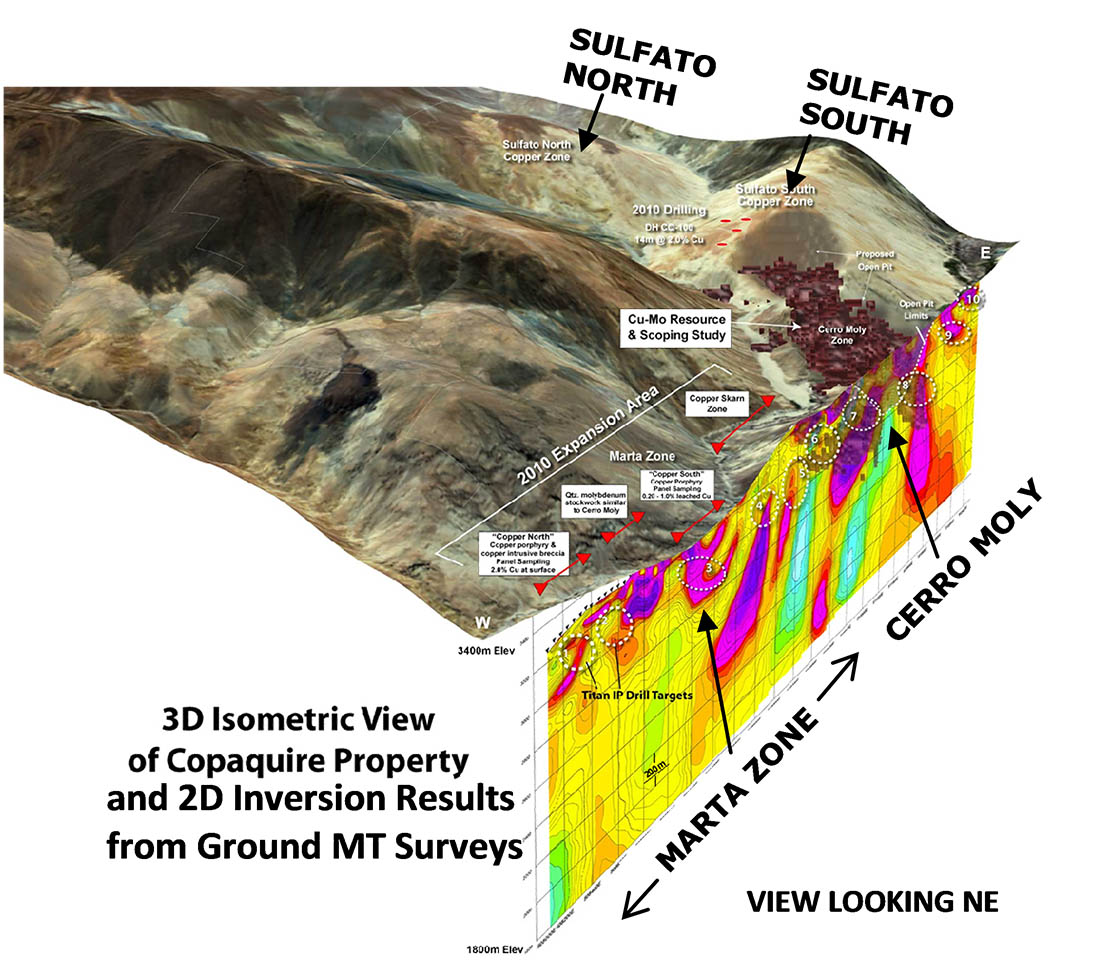
Figure 2: 3D Isometric view of Copaquire property and 2D inversion of ground MT along southern boundary of property (courtesy International PBX Ventures Ltd.).
ZTEM™ surveys have proven particularly useful in porphyry copper exploration for their ability to map resistivity contrasts associated with geologic structures and alteration that accompany these large mineral deposits – particularly between the potassic-altered core of the porphyries, which tend to be resistive, and the surrounding phyllic and/or propyllitic alteration halos, which are more conductive (Lo and Zang, 2008; Paré and Legault, 2010; Sattel et al., 2010).
Property Geology
The geological setting and mineralization type of Copaquire are similar to that found at Collahuasi (5 Bt @ 0.83% Cu, 0.02% Mo) and Quebrada Blanca Mines (1 Bt@ 0.62% Cu oxides). The Copaquire property contains 2 large mineralized porphyry systems (Figure 2): Copaquire and Marta. The Copaquire porphyry includes three zones (Sulfato North, Sulfato South & Cerro Moly) that cover an area of roughly 7 km2 and possesses the potassic, phyllic, argillic and propylitic phases of alteration typical of calc-alkaline Andean porphyry copper systems. The porphyry has a leached cap and secondary chalcocite blanket exposed in the Sulfato Zone north of the Cerro Moly ridge. A preliminary assessment report focusing on the molybdenum rich core of the Cerro Moly zone defined a resource of 307.8 million pounds Mo and 1.2 billion pounds Cu. The Marta Porphyry is in the western area of the property. Recent exploration has revealed mineralized zones close to historic underground workings which exhibit stockwork type molybdenum mineralization similar to that developed at Cerro Moly and areas of porphyry copper and copper skarn mineralization (G. Sookochoff, personal communication, 2011).
The magnetic analytic signal map (Figure 3) obtained from the aeromagnetic data collected during the ZTEM survey, shows Marta area inside a magnetic regional high with localized bull-eye anomalies. Cerro Moly is located over a moderate magnetic high, while the Sulfato Zones are represented by a regional magnetic low. These observations provide evidence that points to potential differences in magnetic mineral content resulting from the hydrothermal alteration processes responsible for mineral accumulation at Copaquire.
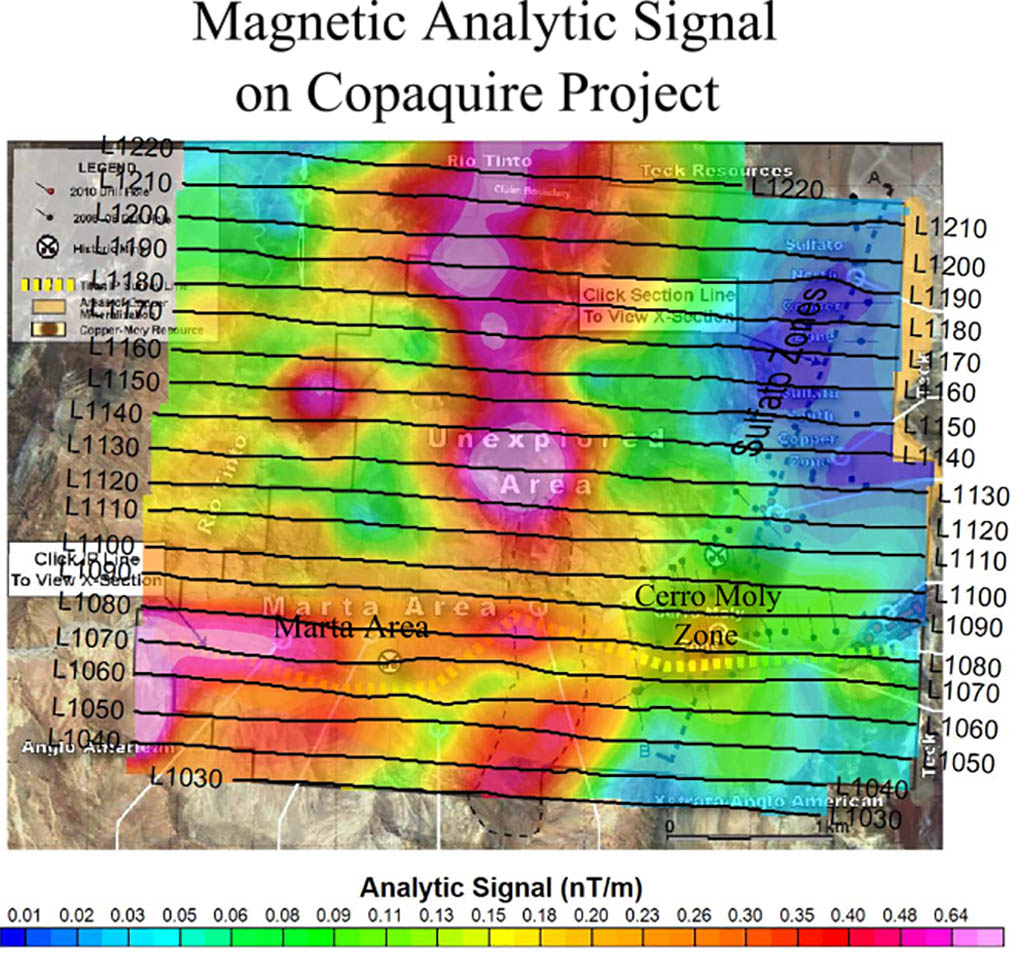
Figure 3: Analytic signal of total magnetic intensity contour plan map, showing the known mineralized zones and with flight lines clipped to the property extents.
General Theory
The ZTEM airborne AFMAG system measures the anomalous vertical secondary magnetic fields that are created by the interaction between naturally occurring, plane wave audio frequency EM fields and electrical heterogeneities in the earth. The vertical magnetic field is linearly related to the horizontal fields according to the following equation (Vozoff, 1972):
HZ = TZXHX + TZYHY
where the magnetic field vector T = (TZX, TZY), known as the Tipper, is complex and a function of frequency, but has rotationally invariant properties, such as its magnitude and direction, that are independent of the subsurface, the measurement direction and the field polarization (Labson et al., 1985).
AFMAG uses naturally occurring audio frequency magnetic fields as the source of the primary field signal, and therefore requires no transmitter (Ward, 1959). The primary fields resemble those from VLF except that they are lower frequency (tens & hundreds of Hz versus tens of kHz), are pseudo-periodic and are not as strongly directionally polarized. These EM fields used in AFMAG are derived from world wide atmospheric thunderstorm activity, have the unique characteristic of being uniform, planar and horizontal, and also propagate vertically into the earth – to great depth, up to several km, as determined by the magnetotelluric (MT) skin depth (Vozoff, 1972), which is directly proportional to the ratio of the bedrock resistivity to the frequency.
![]() In AFMAG, the tipper is obtained by measuring the vertical Hz secondary EM field in the presence of both the horizontal Hx and Hy components, which are a mix of primary and secondary fields (Stodt et al., 1981). ZTEM is a variant of the AFMAG method whereby, as an approximation, the vertical magnetic field HZ is measured using a mobile receiver, towed from a helicopter, and the orthogonal horizontal HX and HY fields are obtained at a separate, fixed base station reference site. As such ZTEM is therefore analogous to the telluric-magnetotelluric adaptation (Hermance and Thayer, 1975) used by modern controlled-source AMT and also distributed array MT systems for rapid reconnaissance mapping purposes.
In AFMAG, the tipper is obtained by measuring the vertical Hz secondary EM field in the presence of both the horizontal Hx and Hy components, which are a mix of primary and secondary fields (Stodt et al., 1981). ZTEM is a variant of the AFMAG method whereby, as an approximation, the vertical magnetic field HZ is measured using a mobile receiver, towed from a helicopter, and the orthogonal horizontal HX and HY fields are obtained at a separate, fixed base station reference site. As such ZTEM is therefore analogous to the telluric-magnetotelluric adaptation (Hermance and Thayer, 1975) used by modern controlled-source AMT and also distributed array MT systems for rapid reconnaissance mapping purposes.
ZTEM™ Survey Results
The airborne geophysical survey consisted of a ZTEM™ (Z-axis Tipper Electromagnetic) System and Caesium magnetometer. A total of 503 km were flown at a nominal line-spacing of 200m over an area of 97km2. The ZTEM™ survey receiver, towed roughly 75m below the helicopter, at a 60m nominal height clearance, is flown over the survey area in a grid pattern. Two orthogonal horizontal axis coils (3.5m dia.) are placed close to the survey site to measure the horizontal EM reference fields. Data from the three coils are used to obtain the Tzx (In-line) and Tzy (cross-line) ZTEM™ tippers, whose transfer functions (In-Phase & Quadrature) are derived at six frequencies in the 25 to 600 Hz band.
Figures 4-5 present the ZTEM™ tipper results in plan shown as Total Phase Rotated (TPR) images of the In-Phase component, with overlying flight paths above the Copaquire Project area. The TPR combines the 90-degree phase-rotations of both the Tzx and Tzy tipper cross-over responses in peaks for easier visualization in plan (Lo et al., 2009). In the TPR image, warm colours represent conductive structures and contacts; cool colours represent more resistive units.
Cerro Moly and Marta areas appear associated with an east-west conductive trend as shown in the 600Hz frequency results (Figure 4), potentially relating to the argillic/phyllic alteration and supergene enrichment blanket and skarns at shallow depth levels. Whereas in the deeper, lowest frequency 37Hz image (Figure 5), both Cerro Moly and Marta are better contrasted and more resistive than the surrounding rocks. This is consistent with the potassic altered core of these porphyry systems relative to the surrounding phyllic/propyllitic altered rocks. In contrast, the Sulfato zones (South and North) display the opposite geoelectrical pattern: At higher frequency, they exhibit clear high resistivity contrast; whereas at greater depth they become moderately conductive and adjacent to more conductive parallel trends. This suggests that the Sulfato zones may be responding to a surficial potassic alteration zone and a surrounding pyritic phyllic-propyllitic altered halo and/or geological structures at depth.
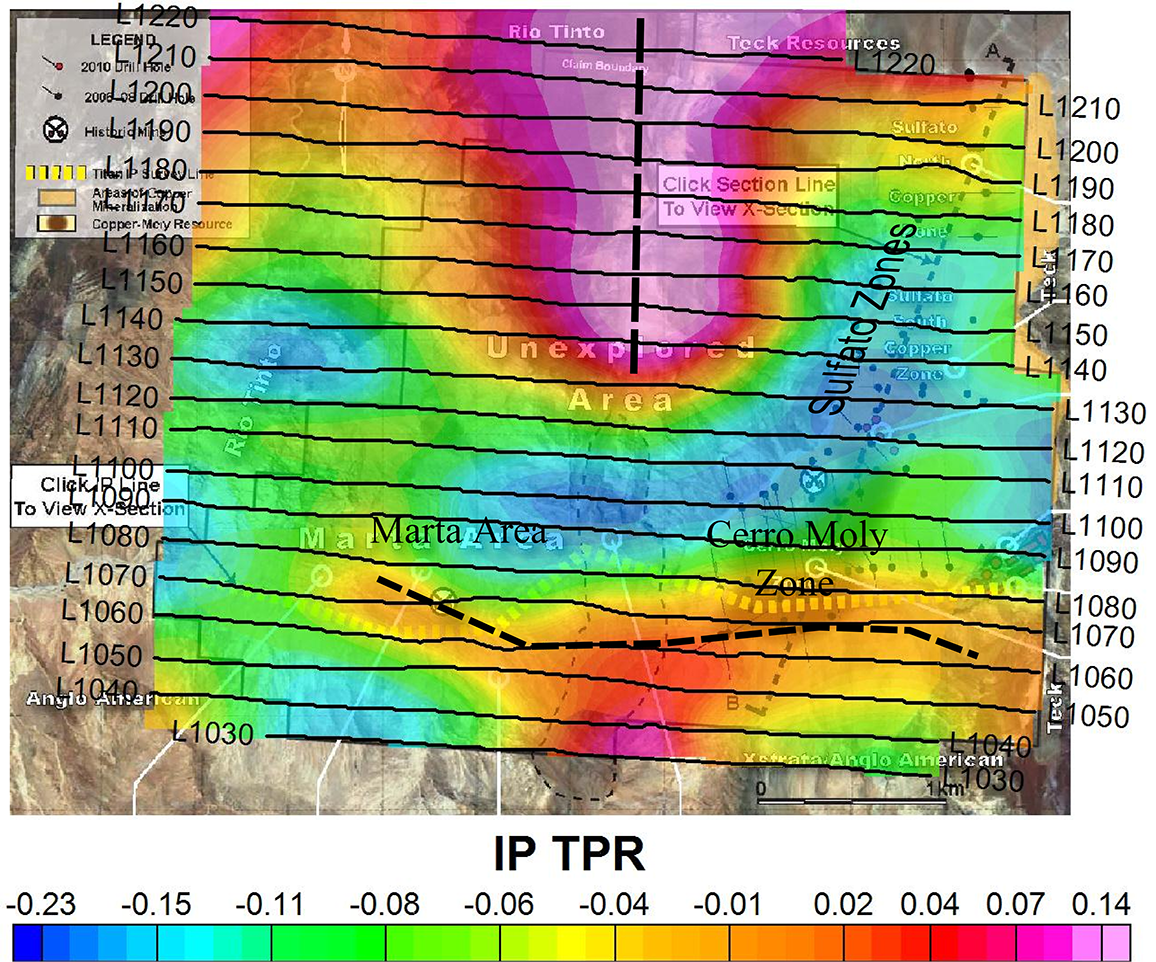
Figure 4: ZTEM™ high frequency (600Hz) Total Phase Rotated In-Phase tipper contour plan map, showing the known Copaquire mineralized zones and with flight lines clipped to the property extents.
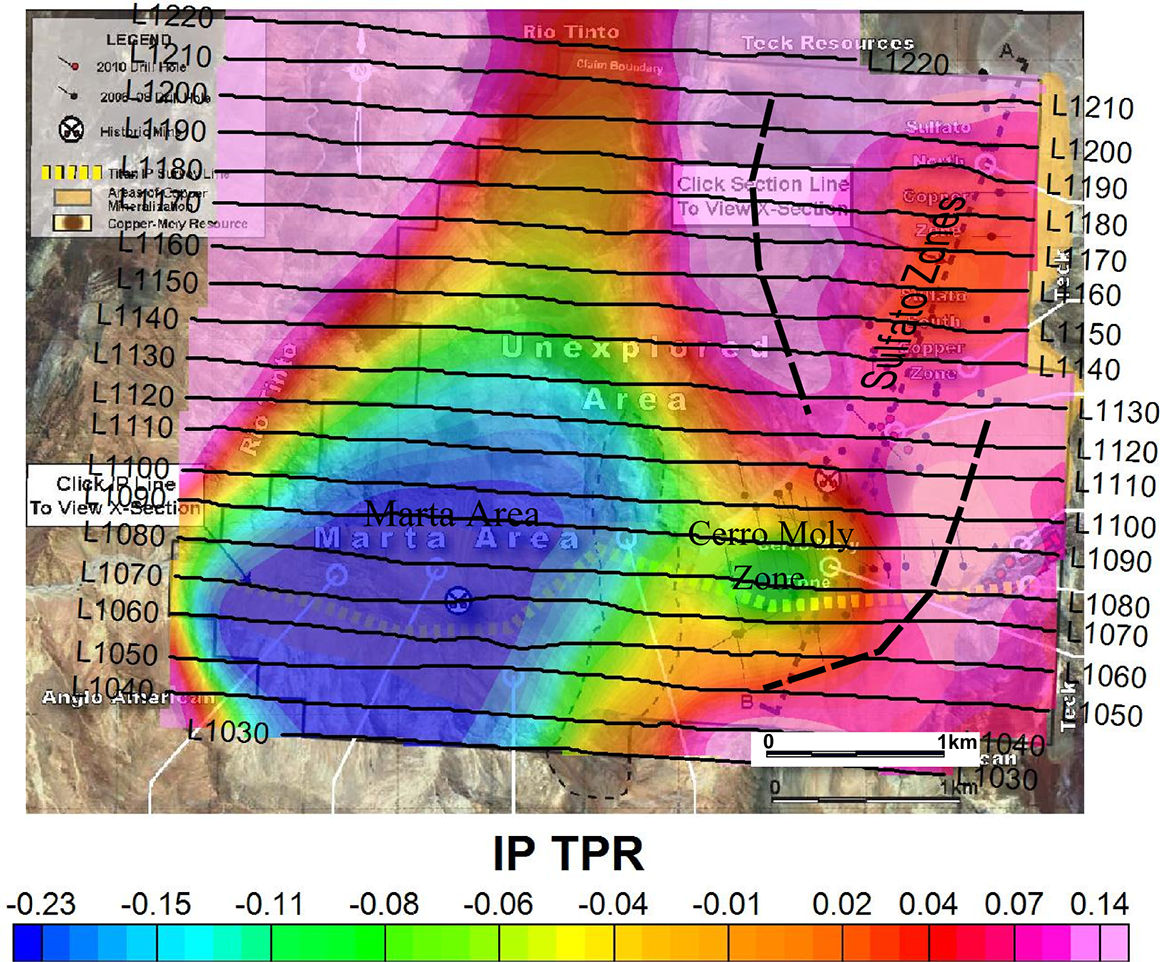
Figure 5: ZTEM low frequency (37Hz) Total Phase Rotated In-Phase tipper contour plan map, showing the known Copaquire mineralized zones and with flight lines clipped to the property extents.
Figures 6-7 present the 2D inversion results for the In-Line (Tzx) ZTEM™ tipper data, using the Zvert2d code, which accounts for the ZTEM™ mobile Hz and fixed Hx approximation and also for the air-layer below the receiver (Legault et al., 2009). Figure 6 shows the 2D resistivity cross-section obtained from the inversion of a line directly over the Cerro Moly and Marta Area, proximal to the MT survey line, presented in Figure 2. As indicated, both the known porphyry centers coincide with well defined resistivity highs that are surrounded by lower resistivity rocks, which is consistent with the known geology. The thin near-surface conductive layer that is imaged above the deposits could either represent the secondary enrichment blanket or else is possibly caused by 2D inversion artifacts due to topography. Although less detailed than the corresponding MT 2D inversion model, the ZTEM™ section appears to map similar resistivity structures and trends – albeit possibly to lesser depth-extent. For example, the pinching of the Cerro Moly resistive feature below 1km depths in Figure 6 is not observed in the MT model (see Figure 2).
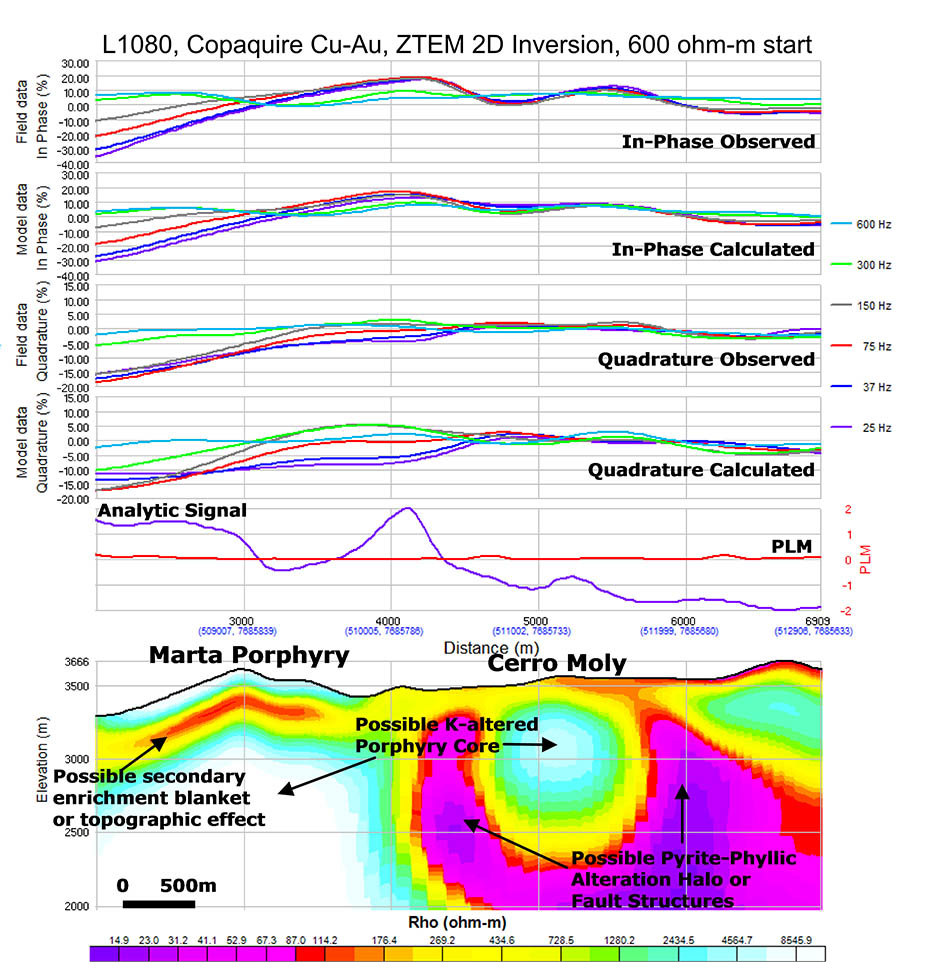
Figure 6: ZTEM low frequency (37Hz) Total Phase Rotated In-Phase tipper contour plan map, showing the known Copaquire mineralized zones and with flight lines clipped to the property extents.
Figure 7 presents a 3D Voxel representation of the 2D ZTEM™ inversion results showing the resistive core below Cerro Moly and conductive surficial layer above the larger Marta porphyry. Further north, the Sulfato zones are modeled as east dipping resistivity features, with the more resistive portion occurring close to surface and weakening at depth. This is interpreted to reflect either a different alteration at depth or is due to structural controls.
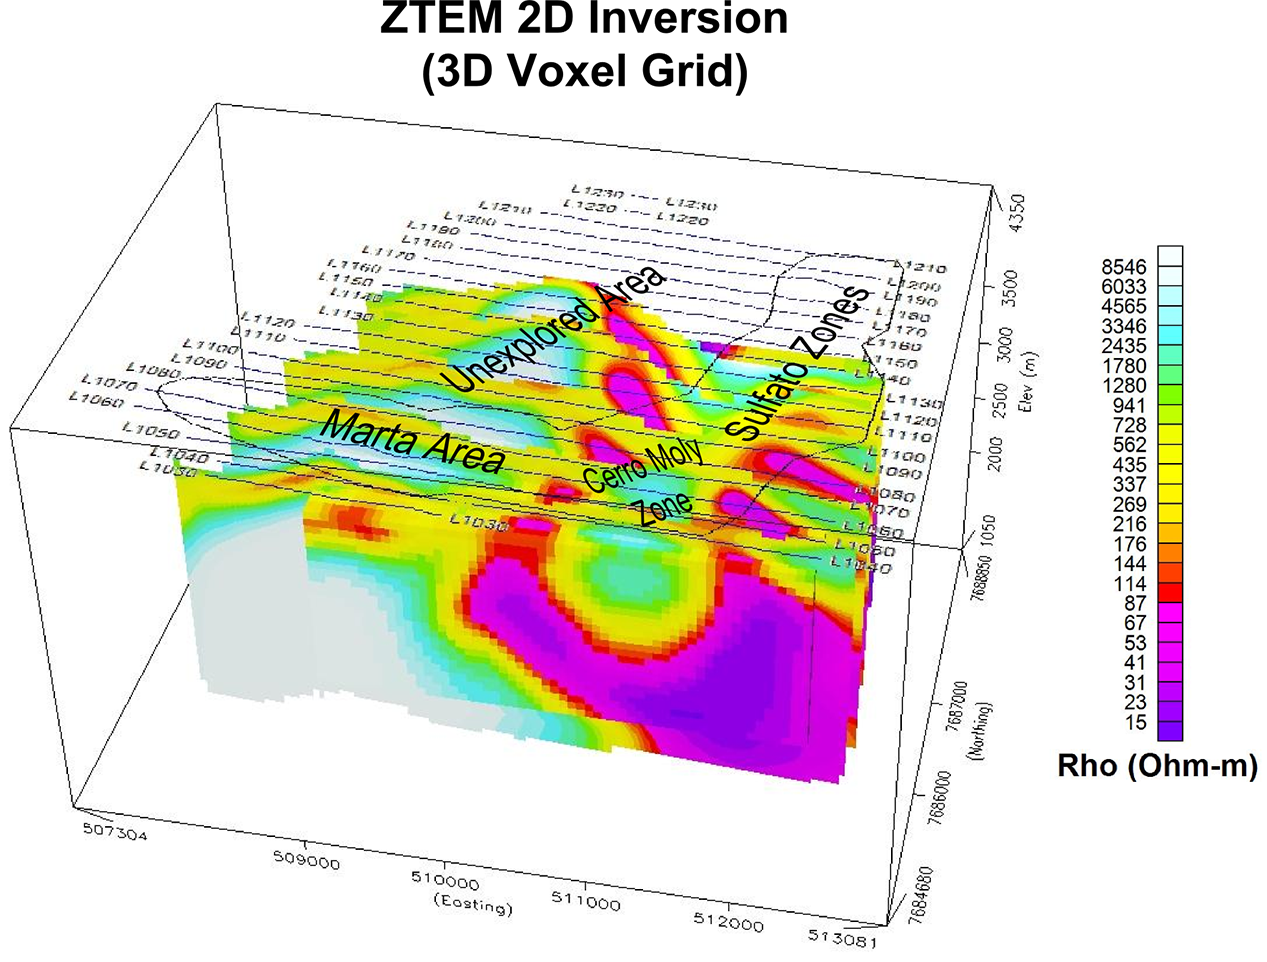
Figure 7: 3D Voxel view of 2D ZTEM inversion results for In-line Tzx component (25-600Hz) at Copaquire, showing known mineralized zones and flight lines.
Conclusions
Airborne ZTEM surveys over the Copaquire porphyry property have defined possible alteration and structural features, based on resistivity contrasts. The ZTEM results appear to map the resistivity highs relating to mineralized potassic altered cores of the Marta porphyry and the smaller Cerro Moly zone, to great depth. These porphyry centers are in turn surrounded by more conductive rocks, which is consistent with either the barren pyrite-rich phyllic and propyllitic alteration or else fault structures. In addition, the ZTEM appears to map a surficial conductive layer, possibly the secondary enrichment blanket that lies above the deposits. Comparisons with MT survey results suggest that ZTEM is mapping similar geology, though less detailed and to lesser depth-extent (<2km). Over the other two known mineralized prospects, Sulfato North and South, the ZTEM results differ somewhat, with the resistive, potassic altered rocks at surface becoming more conductive at depth. Hence the results appear to indicate a different mineralization style.
These findings are consistent with ZTEM™ results obtained over other, similar calc-alkalyne porphyry systems and also agree with the known geology. Certainly, 3D inversion of the ZTEM™ data (Holtham and Oldenburg, 2010) could provide further insights on the mineralized zones and controlling structures at Copaquire. The survey results obtained suggest that ZTEM™ airborne EM could be successfully applied to porphyry copper exploration elsewhere in the Andes of South America.
Acknowledgements
The authors wish to thank Geotech Ltd. and International PBX Ventures Ltd. for allowing us to present these results and for sponsoring this study
References
De Lugao, P.P., and P. Wannamaker, 1996, Calculating the two-dimensional magnetotelluric Jacobian in finite elements using reciprocity, Geophysical Journal International, 127, 806-810.
Hermance, J. F., and R. E. Thayer, 1975, The telluric-magnetotelluric method: Geophysics, 37, 349–364.
Holtham, E., and D. Oldenburg, 2010, Three-dimensional inversion of ZTEM data, 80th Annual International Meeting, SEG, Expanded Abstracts, 655-659.
Labson, V. F., A. Becker, H.F. Morrison, and U. Conti, 1985, Geophysical exploration with audiofrequency natural magnetic fields, Geophysics, 50, 656-664.
Legault, J.M., H. Kumar, B. Milicevic, and P. Wannamaker, 2009b, ZTEM tipper AFMAG and 2D Inversion results over an unconformity uranium target in northern Saskatchewan, 79th Annual International Meeting, SEG, Expanded Abstracts, 1277-1281.
Lo, B., J.M. Legault, P. Kuzmin, and M. Combrinck, 2009a, Z-TEM (Airborne AFMAG) tests over unconformity uranium deposits, 20TH International Geophysical Conference & Exhibition, ASEG, Extended Abstracts, 5 pp.
Lo, B., and M. Zang, 2008. Numerical modeling of Z-TEM (airborne AFMAG) responses to guide exploration strategies, 78th Annual International Meeting, SEG, Expanded Abstracts, 1098-1101.
Paré, P., and J.M. Legault, 2010, Ground IP-Resistivity, airborne Spectrem and helicopter ZTEM survey results over Pebble copper-moly-gold porphyry deposit, Alaska, 80th Annual International Meeting, SEG, Expanded Abstracts, 1734-1738.
Pedersen, L.B., 1998, Tensor VLF measurements: Our first experiences, Exploration Geophysics, 29, 52-57.
Sattel, D., S. Thomas, and M. Becken, M., 2010, An analysis of ZTEM data over the Mt Milligan Porphyry Copper Deposit, British Columbia, 80th Annual International Meeting, SEG Expanded Abstracts, 1729-1733.
Stodt, J.A., G. W. Hohmann, and S. C. Ting, 1981, The telluric-magnetotelluric method in two- and three-dimensional environments: Geophysics, 46, 1137–1147.
Tarantola, A., 1987, Inverse Problem Theory, Elsevier, New York, 613 pp.
Vozoff, K., 1972, The magnetotelluric method in the exploration of sedimentary basins: Geophysics, 37, 98–141.