For a PDF of this paper click here
Summary
VTEM™ is an industry leader in airborne time-domain electromagnetic (TEM) for mineral exploration and achieved this with its superior signal-to-noise ratio and target sensitivity.
TEM data are studied over the Valen prospect in South Australia and compares the VTEM and SkyTEM systems which have similar transmitter specifications. The study focuses on the two systems noise levels, late time gate response for conductors and target sensitivity. Analysis shows VTEM has lower noise levels, stronger late time response which indicates a superior signal-to-noise ratio and leads to a greater target sensitivity.
The VTEM System
The helicopter-borne Versatile Time Domain Electromagnetic System (VTEM) is a geophysical instrument which has been in continuous complex development, utilizing most recent advances in digital electronics, signal processing and the results of practical experience.
Since its inception in 2002, VTEM has been flown around the world, in widely diverse geological environments and spanning a broad spectrum of exploration tasks. The continuous technical development of the system is firmly based on the combination of survey practice, new electronic and schematic achievements and the requirements of exploration and mining industry. It stands firmly on the principle of implementing the complex and balanced upgrades that contribute to decreasing system noise, increasing dipole moment, optimization of waveform, increasing time-width of decay measurement, and increasing precision of the data acquisition system.
VTEM is a world leading airborne EM technology in signal quality and data accuracy. This is illustrated through a survey comparison between VTEM and SkyTEM508 time-domain EM systems over the Valen Cu-Ni massive sulphide deposit in South Australia.
Geology of the Valen Area
The Valen prospect is located within a geological setting containing variably textured mafic units, interpreted to be a part of the Giles Complex, in the Musgrave Province of northwestern South Australia. Close to mafic outcropping, both Cu- and Ni- sulphidesFigure 3 – Target sensitivity shown for Line 20050, times between 0.3-10.4 ms, of SkyTEM (top), and Line 30330, times between 0.3-10.7 ms of VTEM (middle) and resistivity depth image calculated from VTEM data (bottom) have been identified as chalcopyrite and pentlandite respectively. Around the Valen prospect, the overburden consists of a thick regolith of paleovalley sediments, which is conductive, and sand. VTEM surveys, flown in 2011 and 2012, have identified a number of high quality targets including numerous new targets in an underexplored area.
Comparing VTEM and SkyTEM Results
Data over some of the identified targets is presented comparing the results from VTEM and the SkyTEM508 system. The comparison focuses on the noise levels, late time conductor response and target sensitivity of both systems. Many technical specifications of the two system’s transmitters are similar including: peak dipole moment (≈460 000 NIA), transmitter loop area (≈525 m2) and ground clearance (30 m). The data presented are off-time dB/dt Z component measurements consisting of the final deliverable time gates. All time gates are referenced to the end of the current turn-off for both VTEM and SkyTEM.
Noise levels are represented in Figure 1, which shows the response along a profile over the Valen prospect for both systems (L30390 for VTEM and L20110 for SkyTEM). Although these datasets are not ideal when evaluating system noise levels due to conductive overburden, a qualitative analysis can be done for points between 590900E and 591600E (see Figure 1). The profiles are presented in the same log/linear scale in order to show the conductor’s response while not diminishing the noise completely. In this section, VTEM has noticeable late time noise but response decay is still distinguishable with minimal crossing of time gate profiles. The SkyTEM results show abundant crossover between time gates including significant portions of the late time data in the negatives. Also, SkyTEM’s noise appears to contain long wavelength harmonics, which are comparable in width to the response from Valen, over an area of constant VTEM response.
Response strength in the late time gates is the prime indicator of identifying good conductors. Figure 2 depicts a comparison between VTEM (L30290) and SkyTEM (L20010) data showing the dB/dt Z profiles for the lines and decay curves at the peak response for the same conductor. The VTEM data shows strong late time response which is still decaying to 9 msec. Meanwhile, the response from SkyTEM has fully decayed at 6.5 msec. The longer decay of VTEM for the same conductor indicates that its transmitter signal is penetrating deeper into the conductor. This is important when calculating Tau constant values to discriminate between good and poor conductors. For this conductor, the Tau constant values calculated are 2 msec for VTEM and only 0.9 msec for SkyTEM. Therefore, VTEM is more accurately identifying good conductors. This conductor is located nearby other identified targets close to the mafic outcropping of the Giles Complex. The strength of late time gate response is important when modeling targets for drilling, as the model will be more representative of depth, orientation and conductance of the most conductive region of the target.
Since it has been shown that VTEM has lower system noise and stronger late time gate response for conductors, it leads to the conclusion that VTEM has a superior signal-to-noise ratio. Higher signal-to-noise ratio for a TEM system allows for greater penetration depth and target sensitivity, especially for deep, high conductance targets. A comparison of target sensitivity is demonstrated in Figure 3 which shows VTEM data for L30330 and SkyTEM data for L20050, which are separated by approximately 5 meters, and a resistivity depth image created from the VTEM data. Along the line, VTEM is able to sense multiple targets more
clearly particularly a deep conductor at 590150E which is indistinguishable in the SkyTEM data. It is VTEM’s high sensitivity to conductive targets which allows it to identify this deep conductor which could otherwise have been missed. This target is highly prospective as it is located near the Giles Complex outcropping. VTEM can not only identify this target but also model the data for follow-up drilling.
Conclusions
VTEM’s capabilities were compared against the SkyTEM508 system studying the systems noise levels, late time gate response from conductors and target sensitivity. In the three cases, VTEM shows lower noise level, stronger late time response and higher target sensitivity. This is achieved from VTEM’s high signal-to-noise ratio which allows its data to penetrate deeper and identify highly conductive targets which otherwise could be missed.
The high signal-to-noise ratio of VTEM allows its data to be modeled more accurately and derived the depth and orientation of the target’s most conductive region for follow-up exploration and drilling.
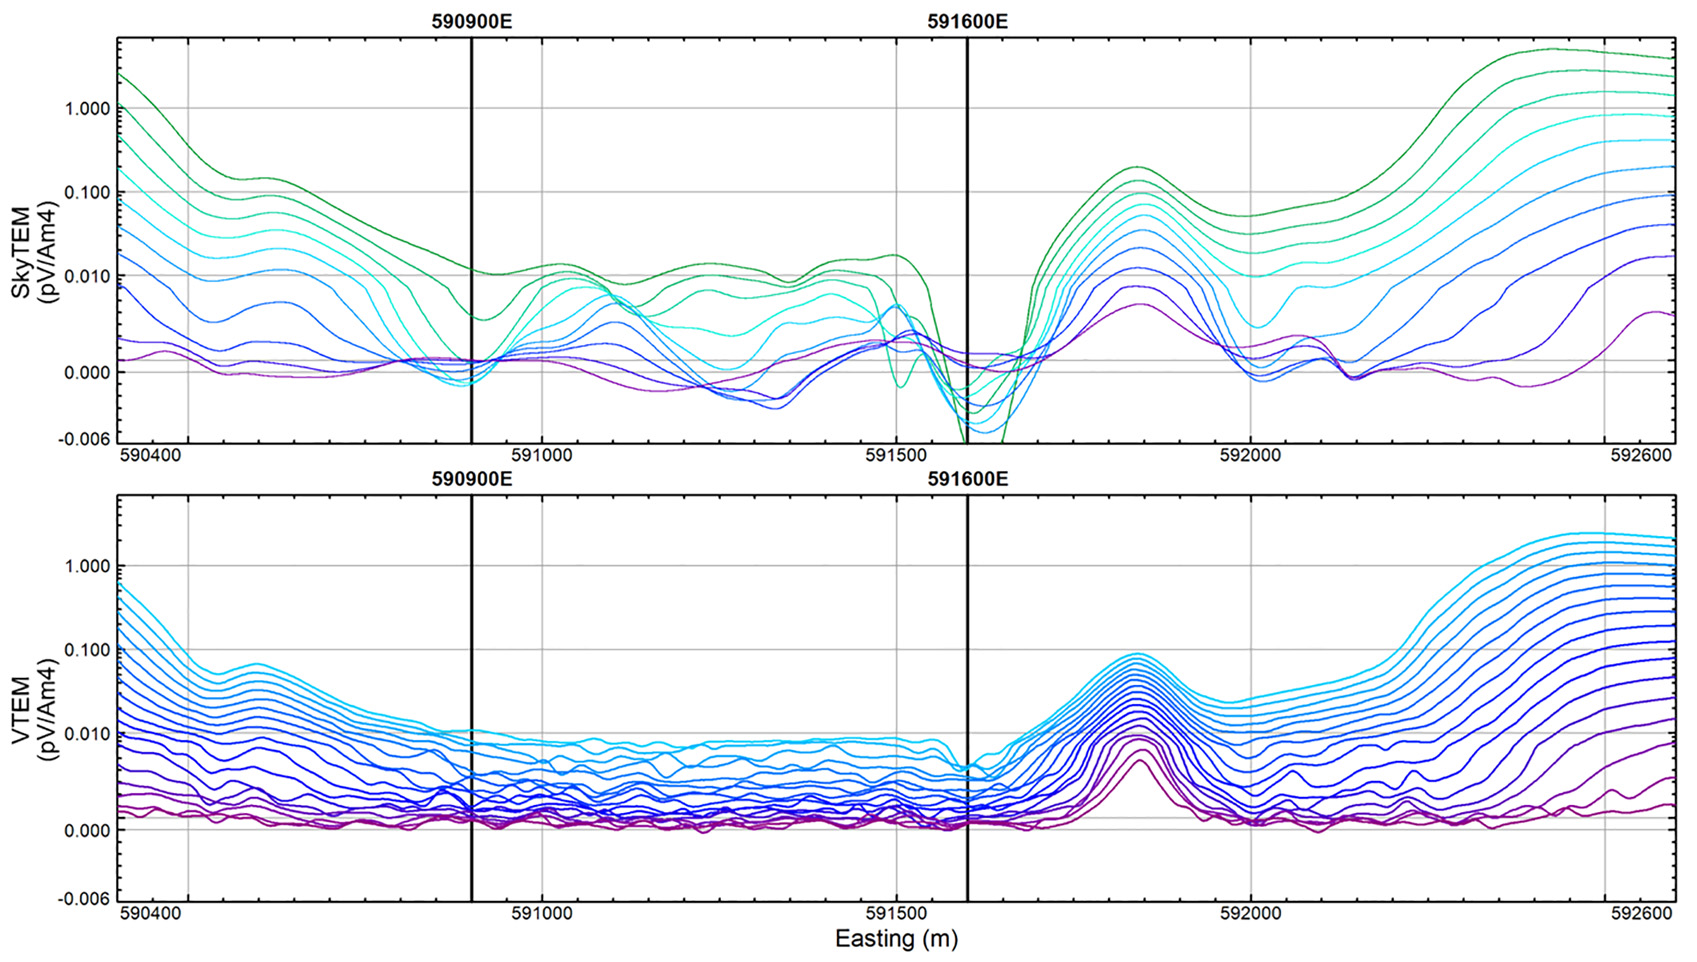
Figure 1 – System noise highlighted for Line 20110, times between 1.1-10.4 ms, of SkyTEM (top) and Line 30390, times between 1.2-10.7 ms of VTEM (bottom)
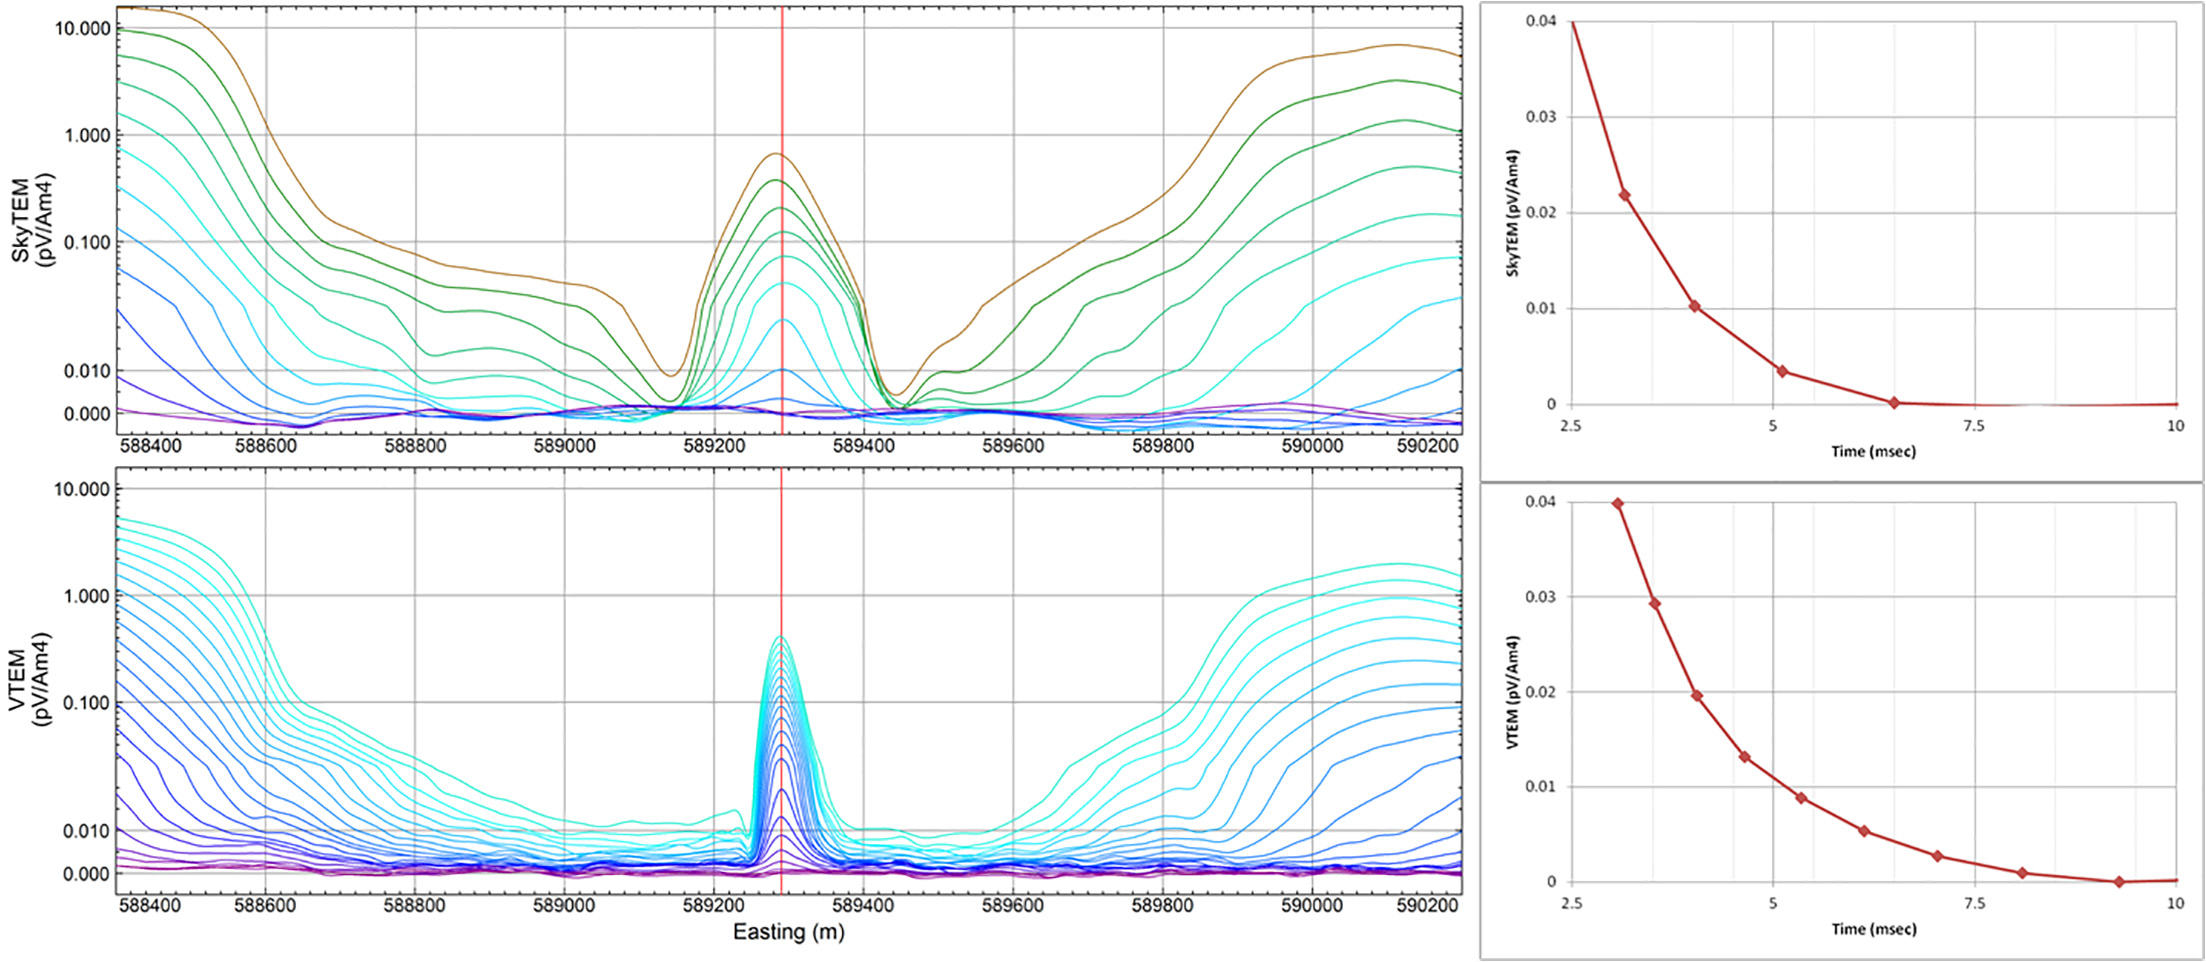
Figure 2 – Late time response shown by profiles of times between 0.6-10.6 msec of Line 20010 for SkyTEM (top) and Line 30290 for VTEM (bottom) with decay curves (right) at sounding denoted by red line.
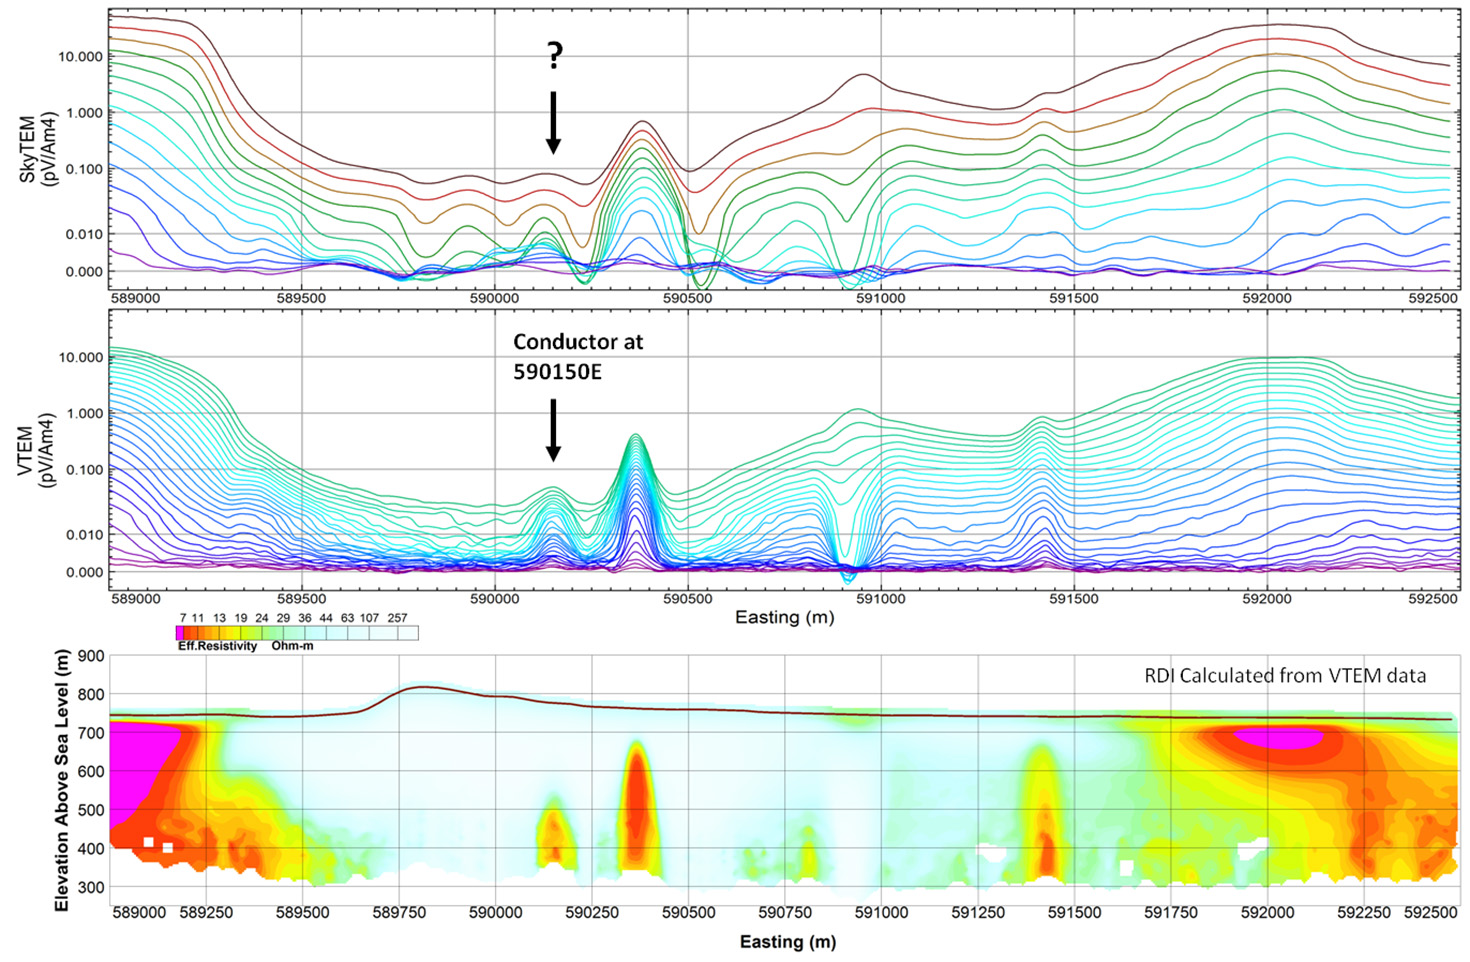
Figure 3 – Target sensitivity shown for Line 20050, times between 0.3-10.4 ms, of SkyTEM (top), and Line 30330, times between 0.3-10.7 ms of VTEM (middle) and resistivity depth image calculated from VTEM data (bottom)