For a PDF of this paper click here
Introduction
This case-study concerns a direct survey comparison between the VTEM and SkyTEM helicopter EM systems over the Maniitsoq region’s Greenland Norite Belt (GNB), in western Greenland.
The Maniitsoq area is underlain predominantly by highly deformed and metamorphosed Archean gneisses. Supracrustal rocks comprise about 10% of the area and consist mainly of amphibolite (metamorphosed and deformed volcano-sedimentary sequences). Most of the nickel discovered to date is associated with younger, undeformed norite intrusions that are concentrated in (but not restricted to) a 15 km wide by 75 km long “J”-shaped belt, referred to as the Greenland Norite Belt (GNB), which rims a large, complex known as the Finnefjeld Gneiss Complex.
In 1995 Cominco Ltd, in conjunction with the Geological Survey of Denmark and Greenland (GEUS), flew a large portion of the GNB with the GeoTEM fixed wing, airborne EM system. Relatively few EM anomalies were detected. Helicopter EM surveying of the GNB by SkyTEM Surveys ApS of Denmark took place in mid-September to early October of 2011. Later, a VTEM survey (Geotech Ltd.), covering some parts of the SkyTEM block, was completed in June, 2012.
The results showed that the VTEM system, by comparison, detected many more highly conductive targets than did SkyTEM, due to VTEM’s low noise levels, high dipole moment, optimized waveform, broad bandwidth and significant depth of investigation. The tests also showed that, in contrast to SkyTEM, VTEM data provide more reliable information about weak and shallow conductors.
Below, the detailed comparison, between VTEM and SkyTEM data over the same areas using the same flight lines, includes:
- EM maps, profiles in detail comparison over some typical conductive targets (p. 2-5)
- VTEM-SkyTEM resistivity-depth sections for lines crossing conductive targets (p. 6)
- Early time VTEM-SkyTEM comparison (p. 7-8)
- VTEM-SkyTEM noise level comparison (p. 9)
Part 1: VTEM- SkyTEM EM Maps and Profiles
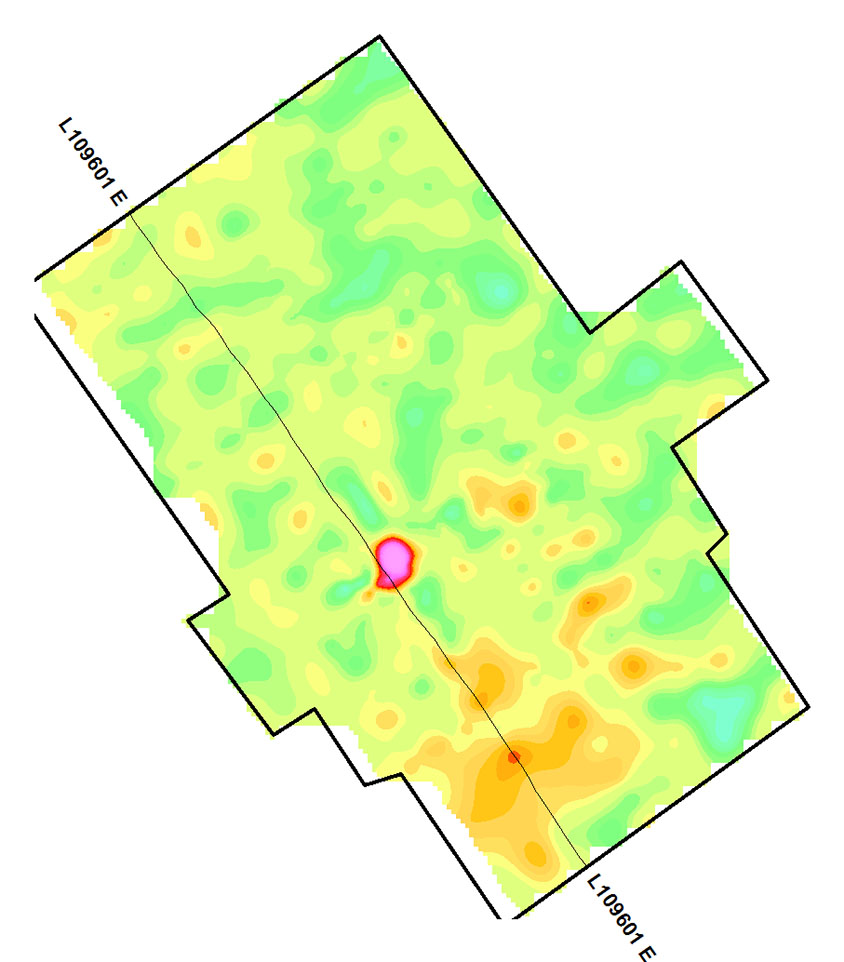
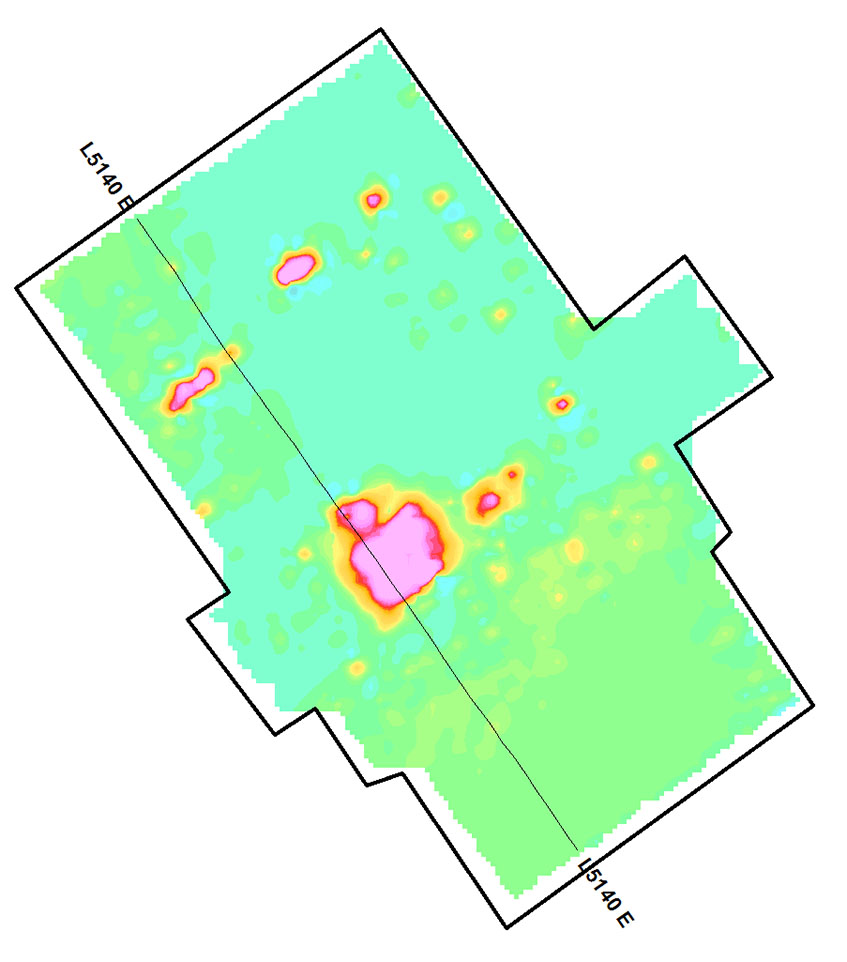
Figure 1 – SkyTEM (top) and VTEM (bottom) EM maps
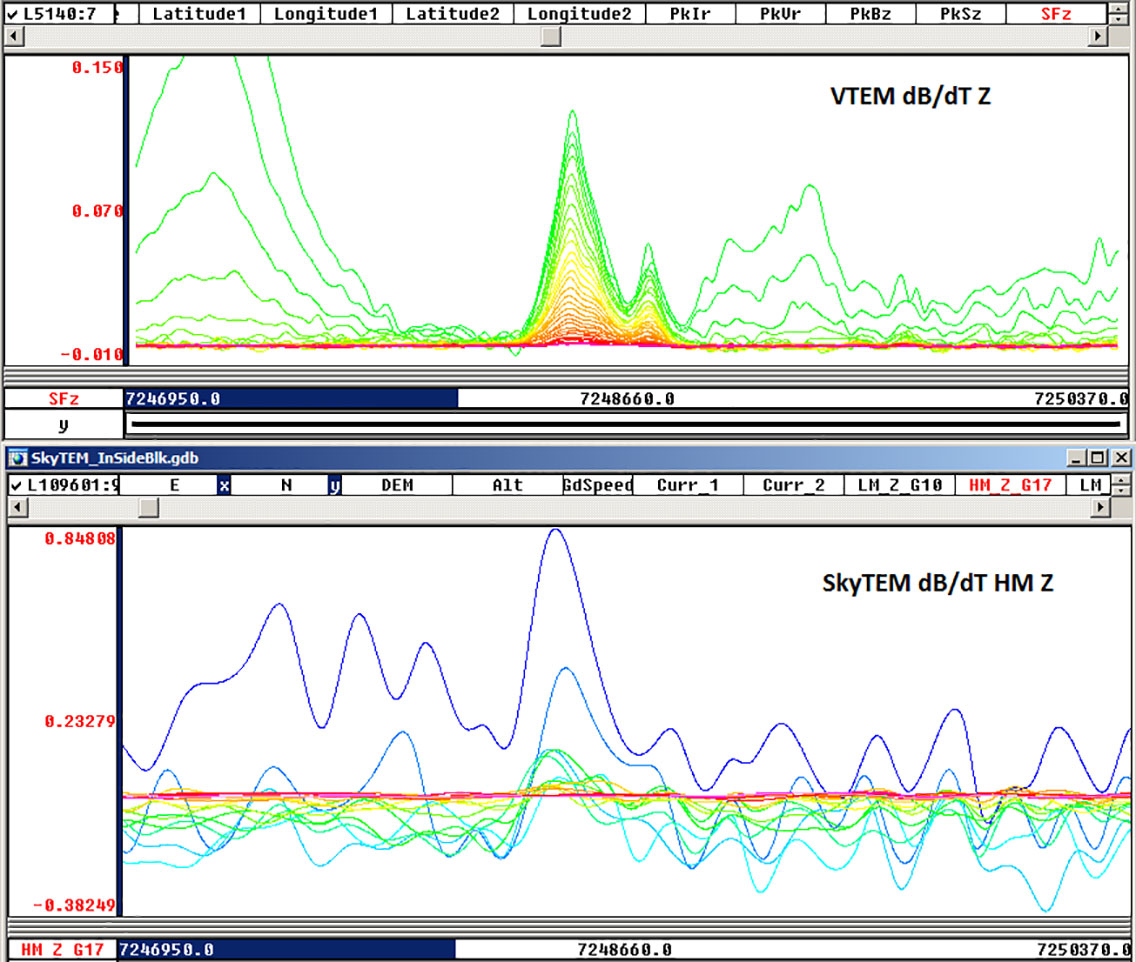
Figure 2 – VTEM L5140 (top) and SkyTEM L109601 (bottom) dBz/dT profiles (from Fig. 1)
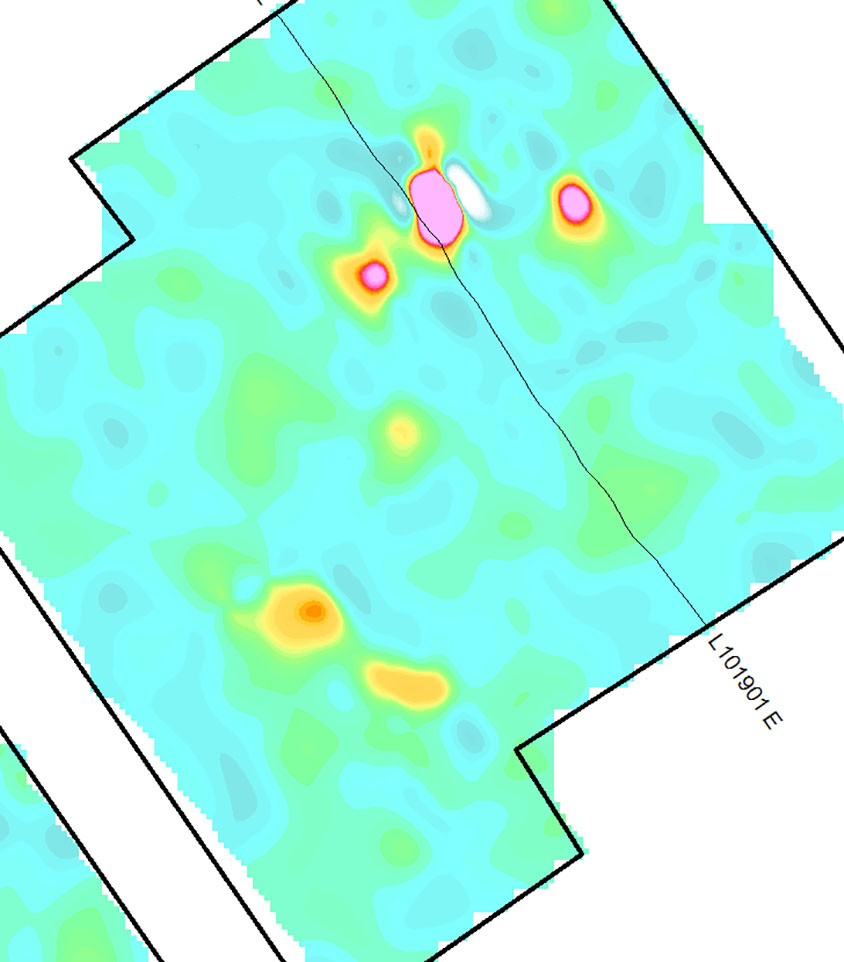
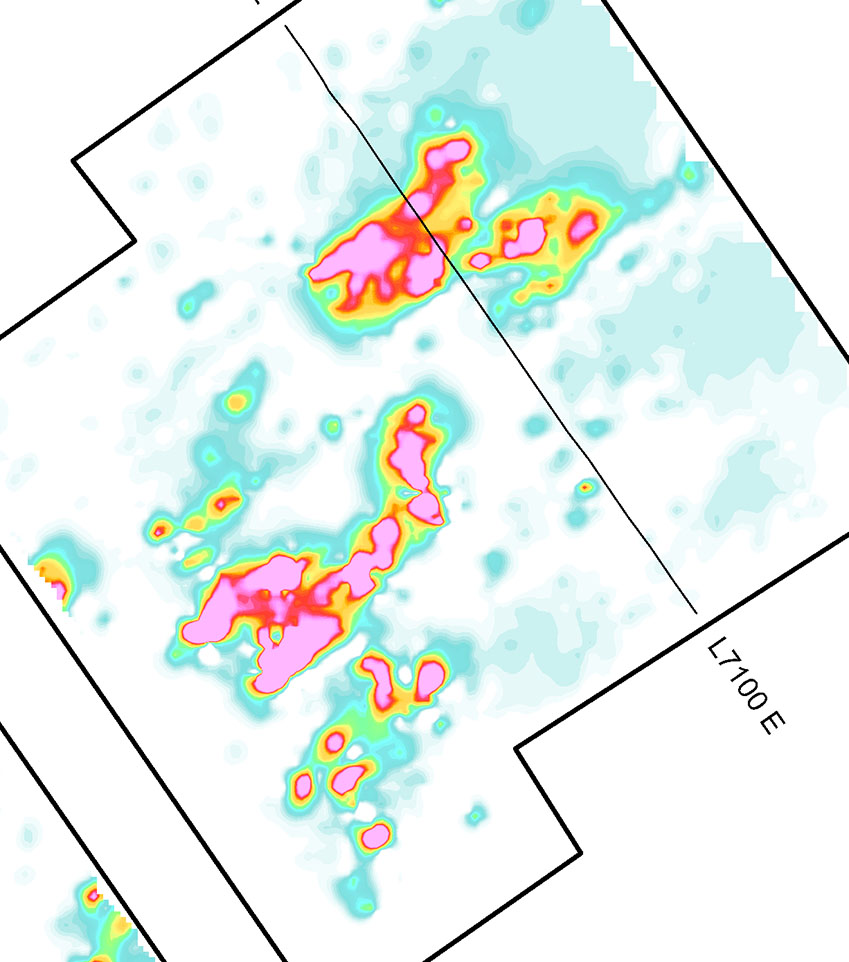
Figure 3 – SkyTEM (top) and VTEM (bottom) EM maps
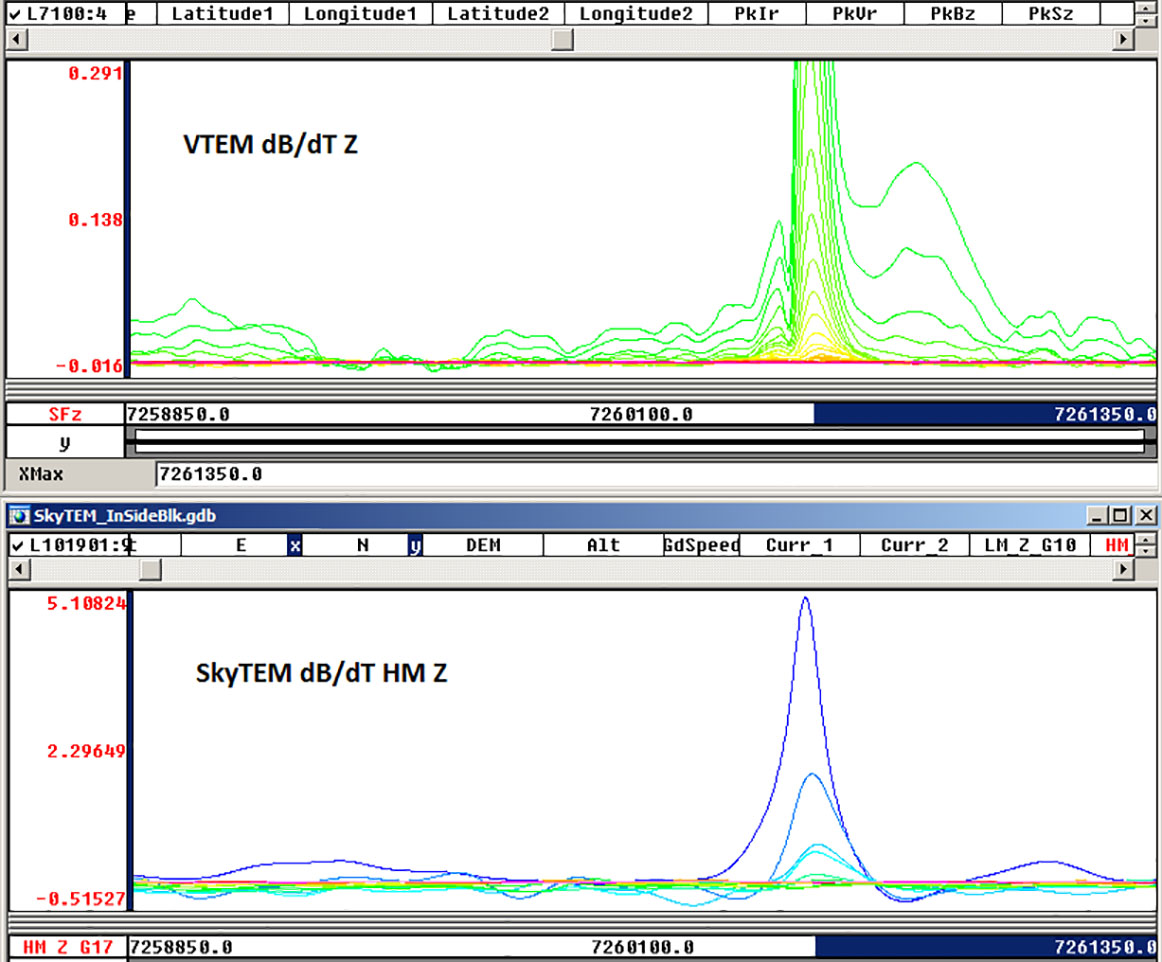
Figure 4 – VTEM L7100 (top) and SkyTEM L101901 (bottom) dBz/dT profiles
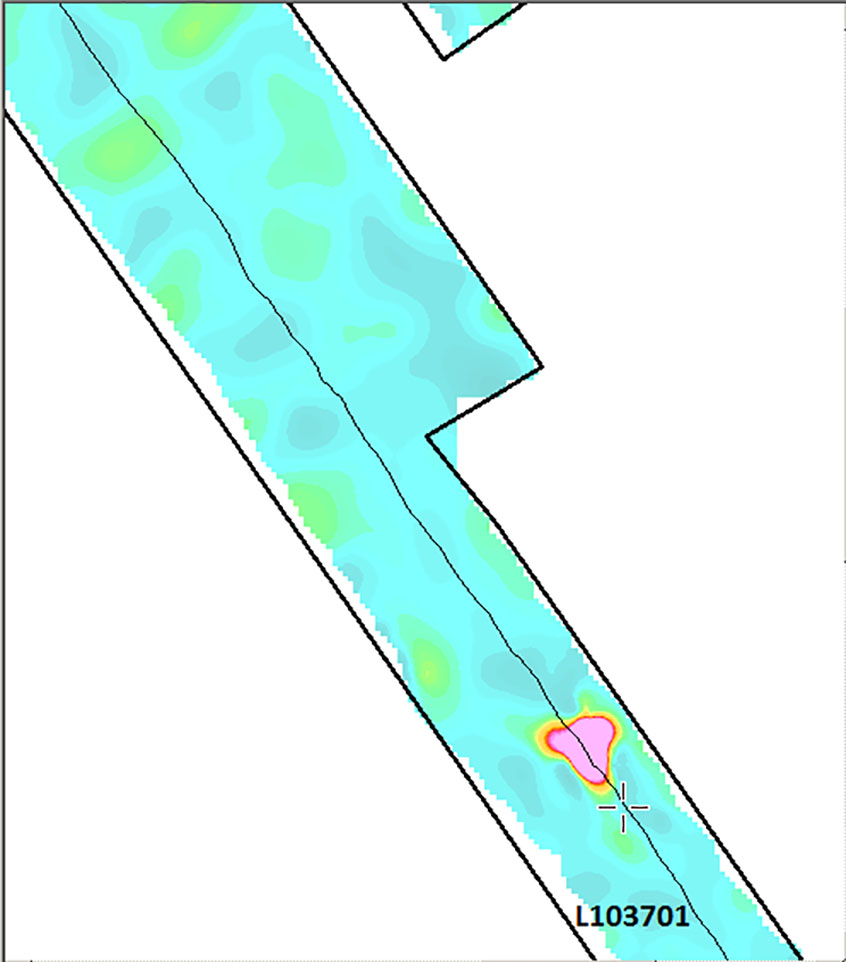
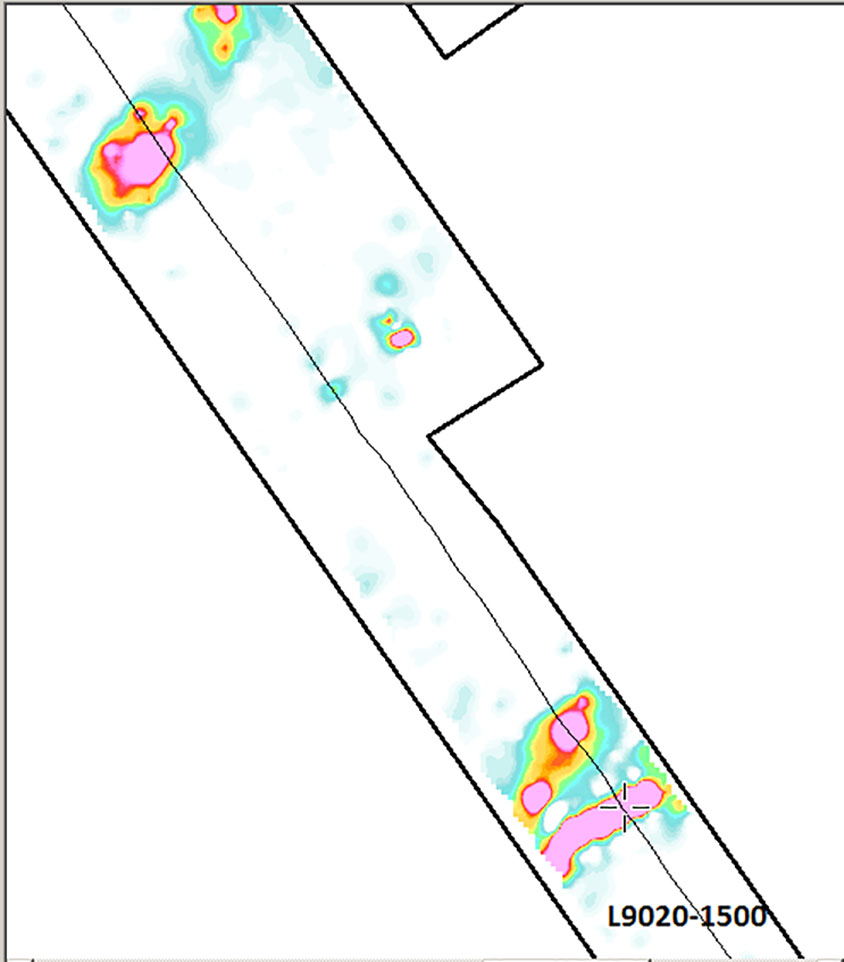
Figure 5 – SkyTEM (top) and VTEM (bottom) EM maps
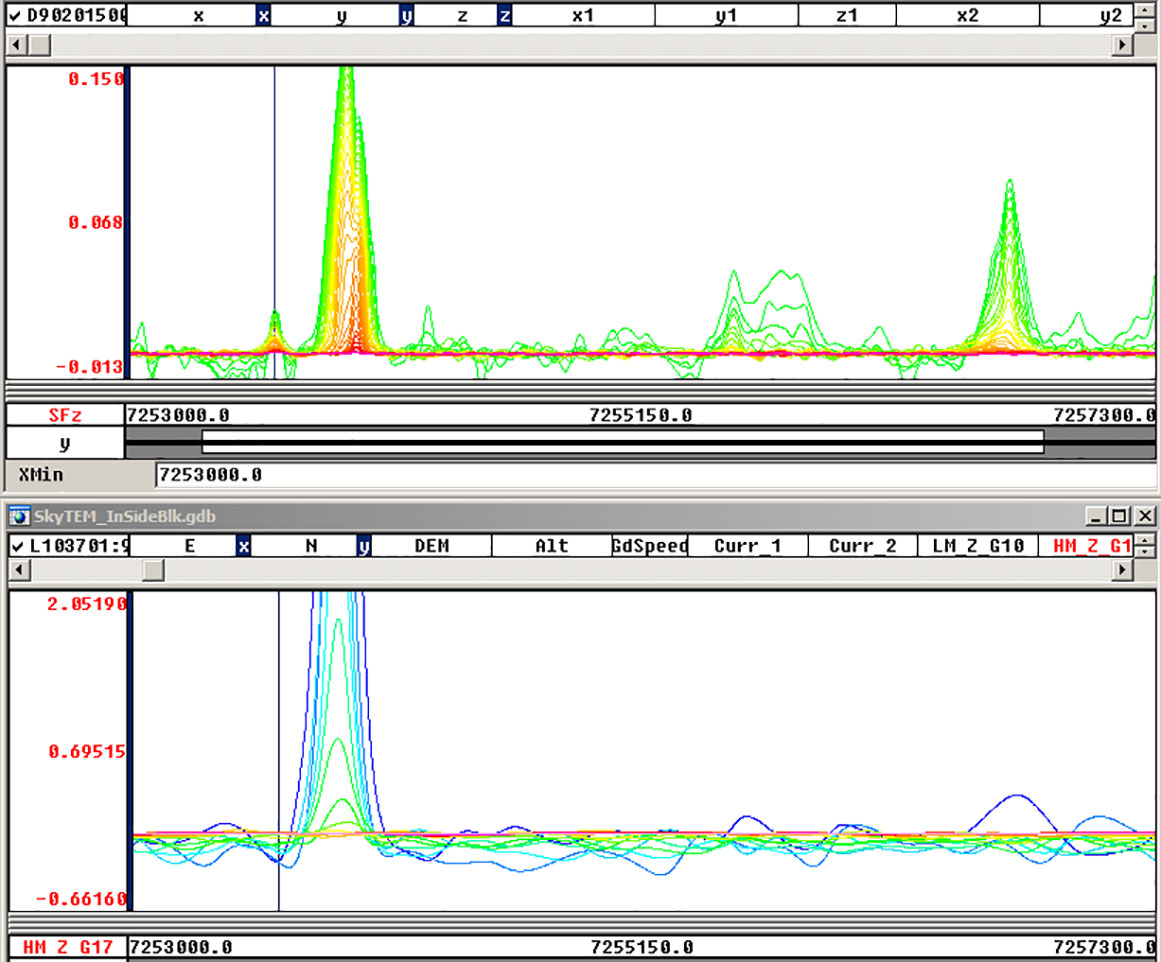
Figure 6 – VTEM L9020-1500 (top) and SkyTEM L103701 (bottom) dBz/dT profiles
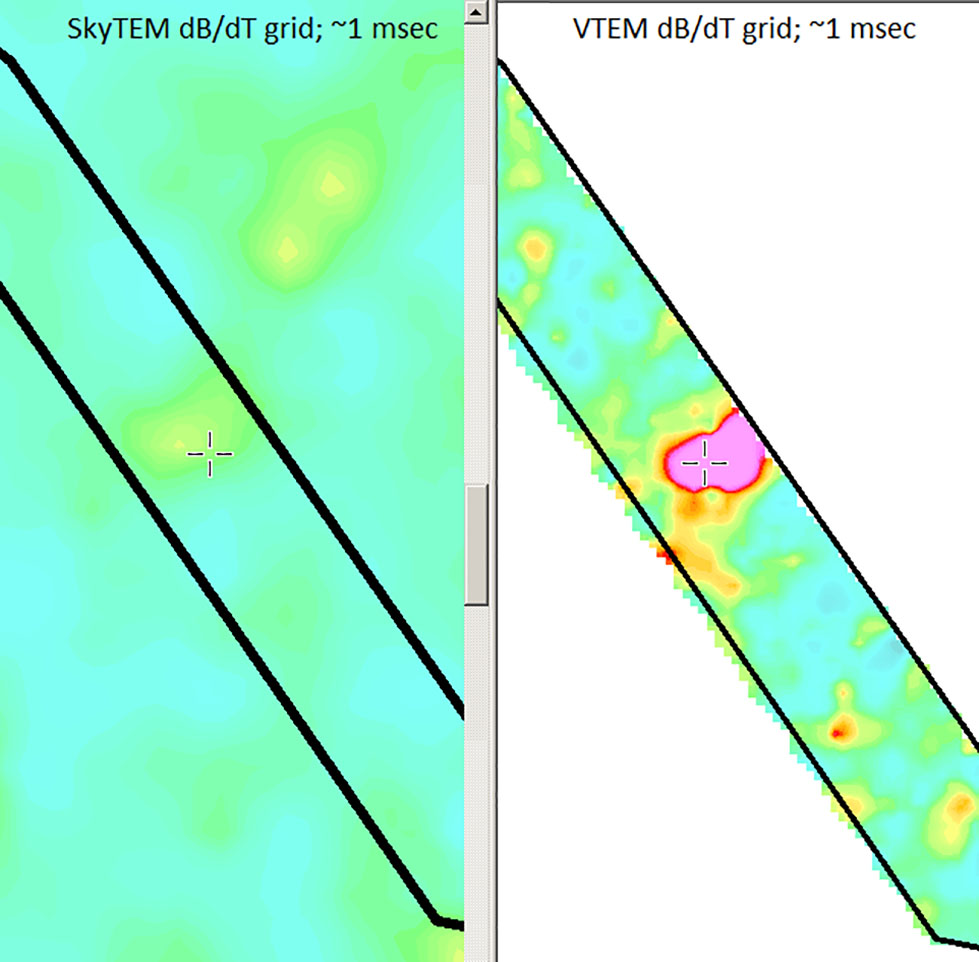
Figure 7 – SkyTEM (left) and VTEM (right) dBz/dT over the same conductive target
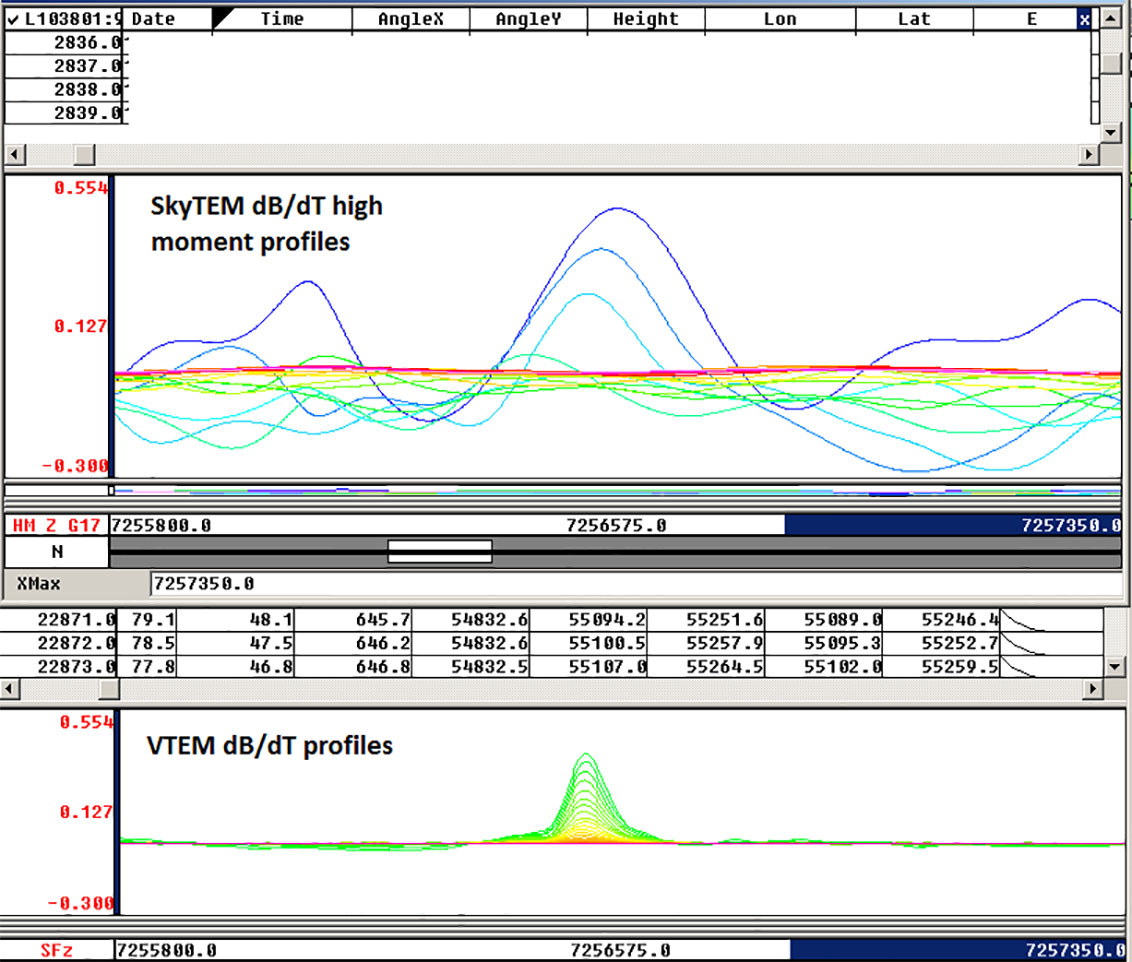
Figure 8 – SkyTEM (top) and VTEM (bottom) dBz/dT profiles for the line crossing the target in Fig. 7
Part 2: VTEM-SkyTEM Resistivity-depth Sections over Conductive Targets
The quality of response of the time-domain EM systems in mapping geology can be compared using resistivity depth imaging. The VTEM survey dBz/dT results were interpreted using pseudo-2D resistivity depth-imaging (RDI), according to the method described by Meju (1998). The SkyTEM resistivity sections were derived using their in-house 1D imaging software. The examples below clearly demonstrate the differences between the VTEM and SkyTEM system data.
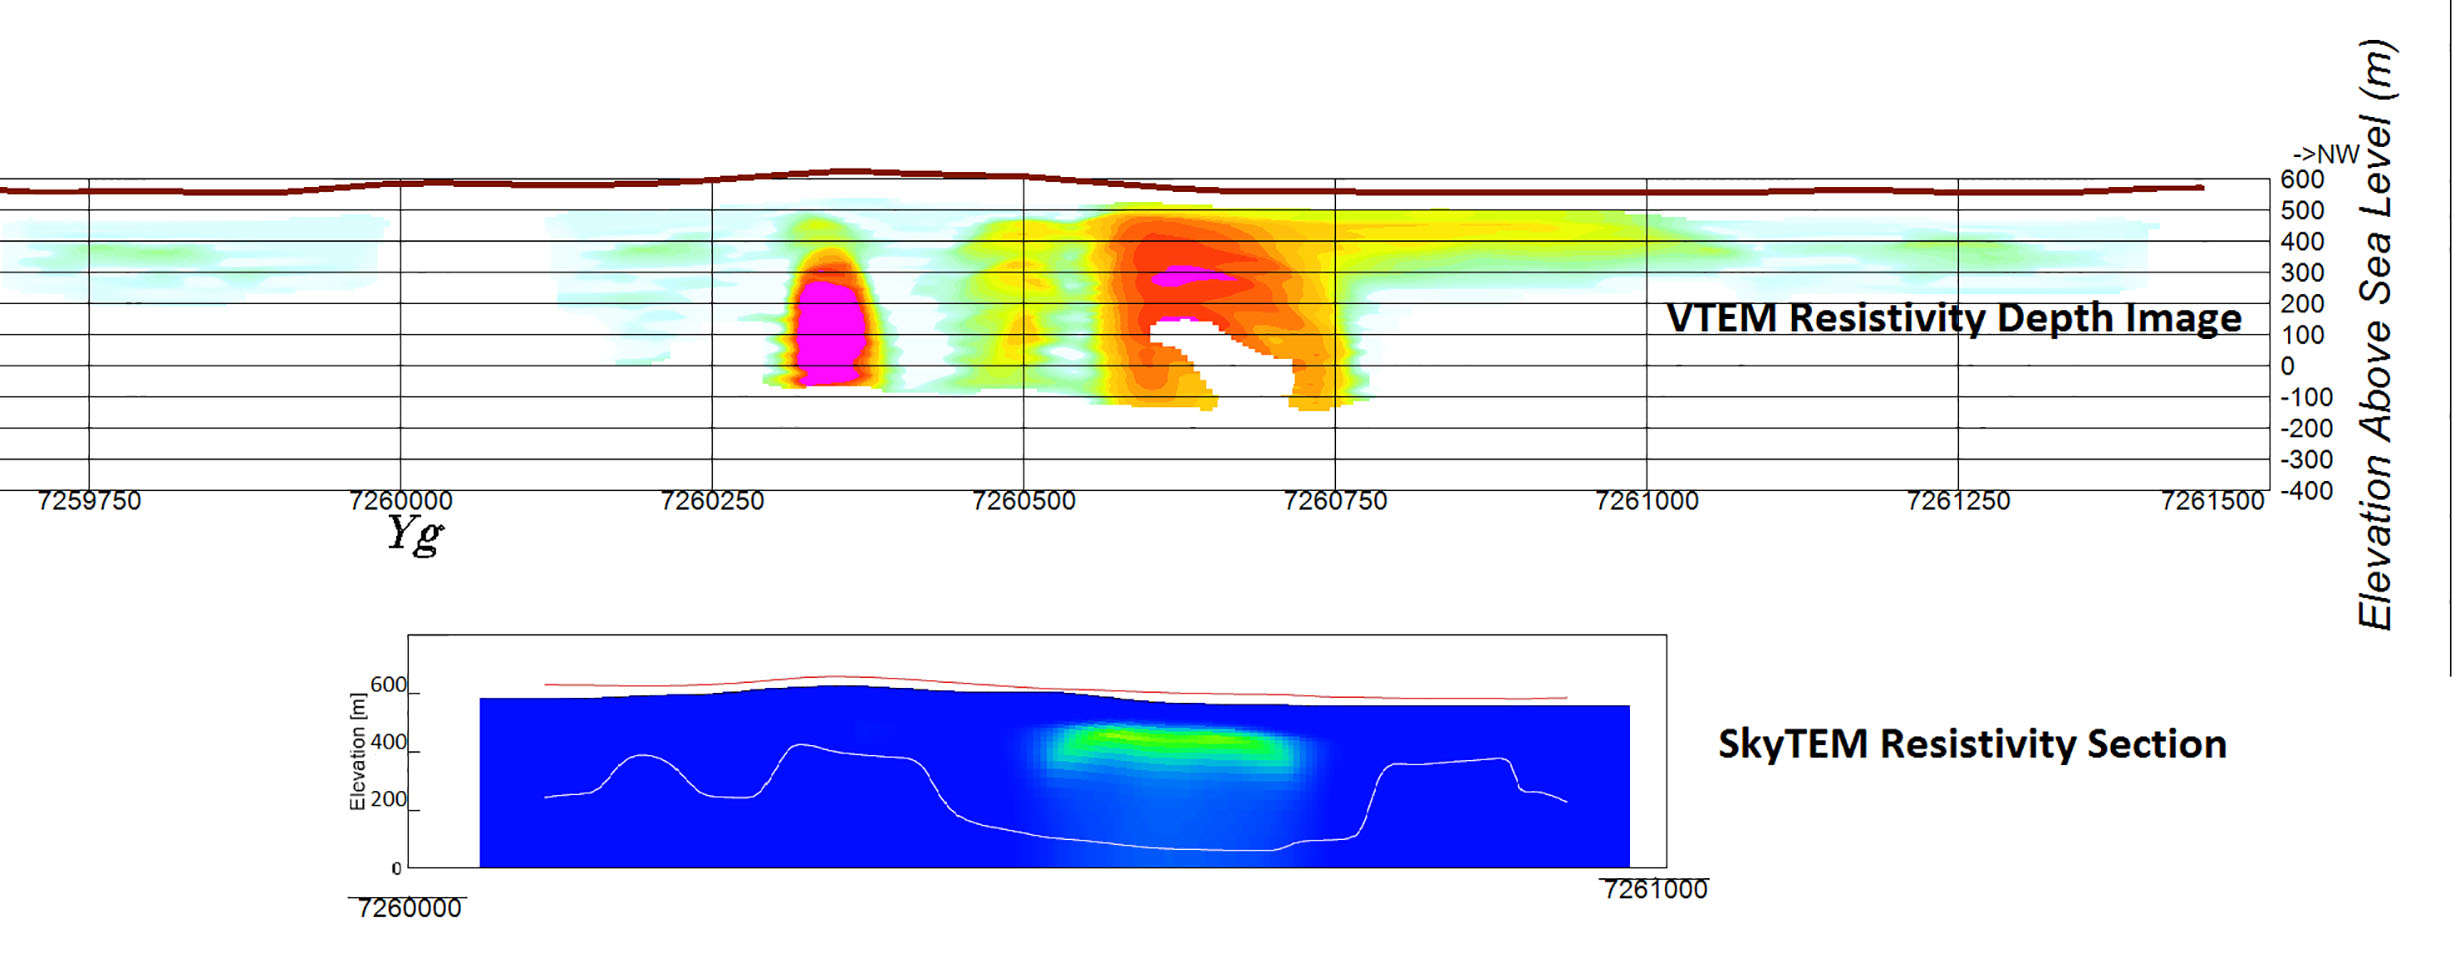
Figure 9 – RDI VTEM section (L7090) and SkyTEM resistivity section (L505501) for the same line
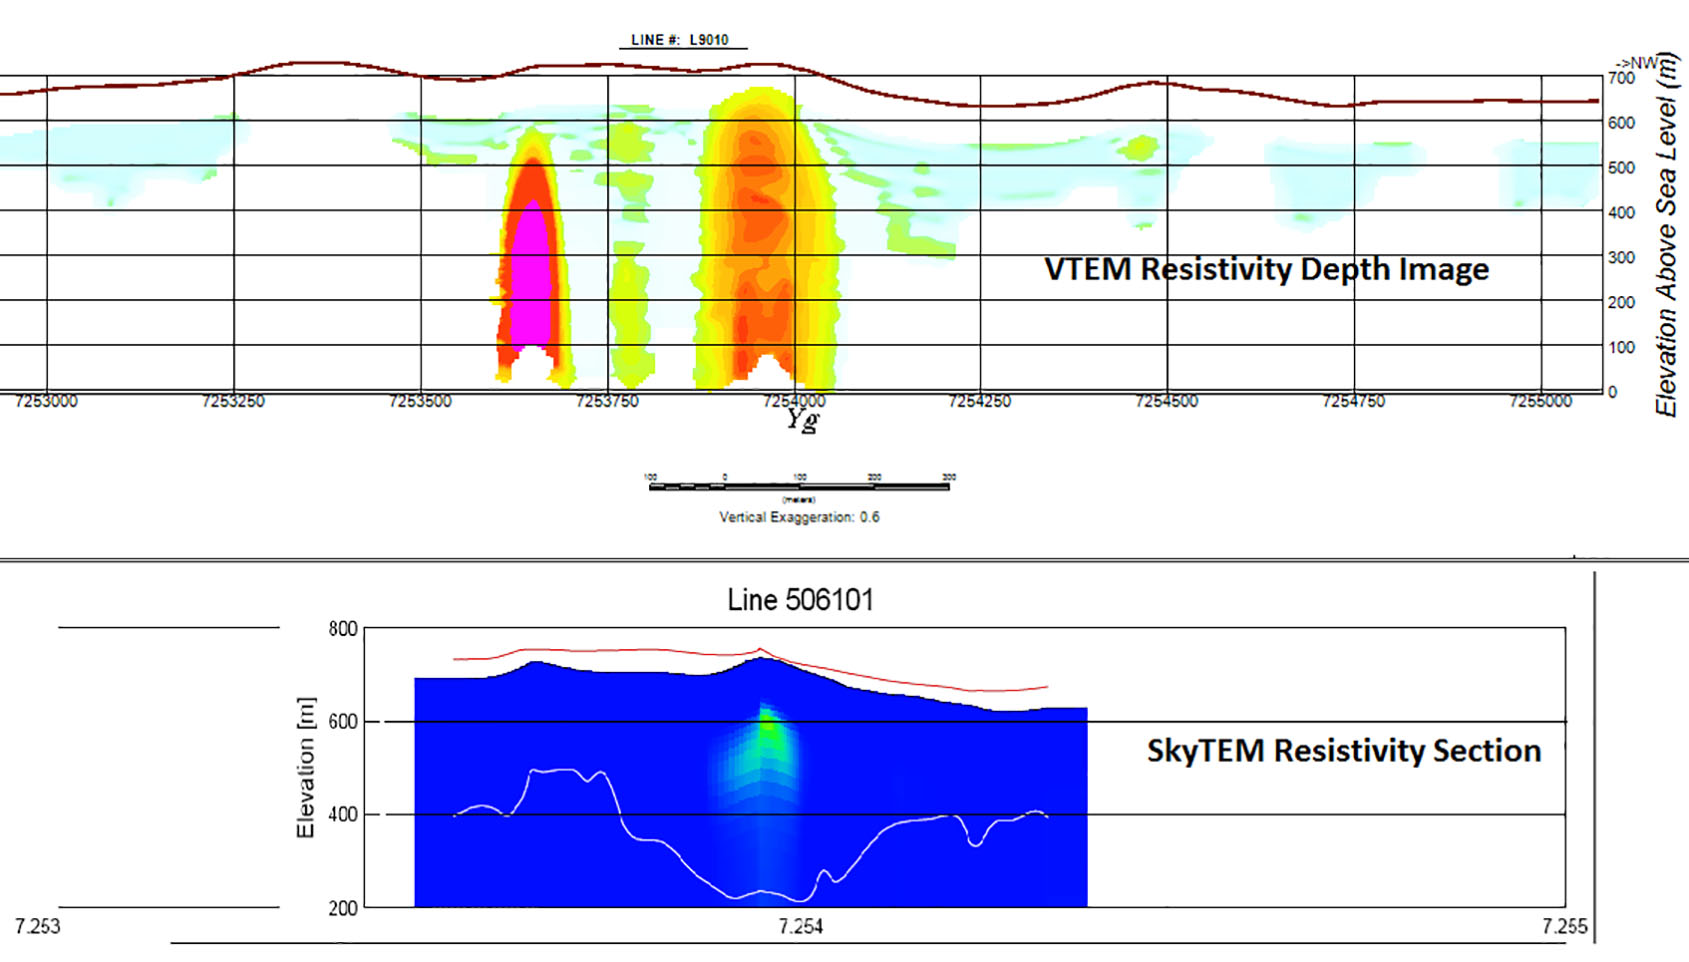
Figure 10 – RDI VTEM section (L9010) and SkyTEM resistivity section (L506101) for the same line (see figures 5-6)
Part 3: Early Time VTEM – SkyTEM Comparison
The reliability of the early time EM response can be checked over some shallow conductive sediments. An area of GNB with lake-bottom sediments has been chosen for the comparison. As shown in the pictures below, the VTEM early times are more reliable, stable and repeatable between time gates, as well as corresponding perfectly to the lakes – unlike SkyTEM in most cases.
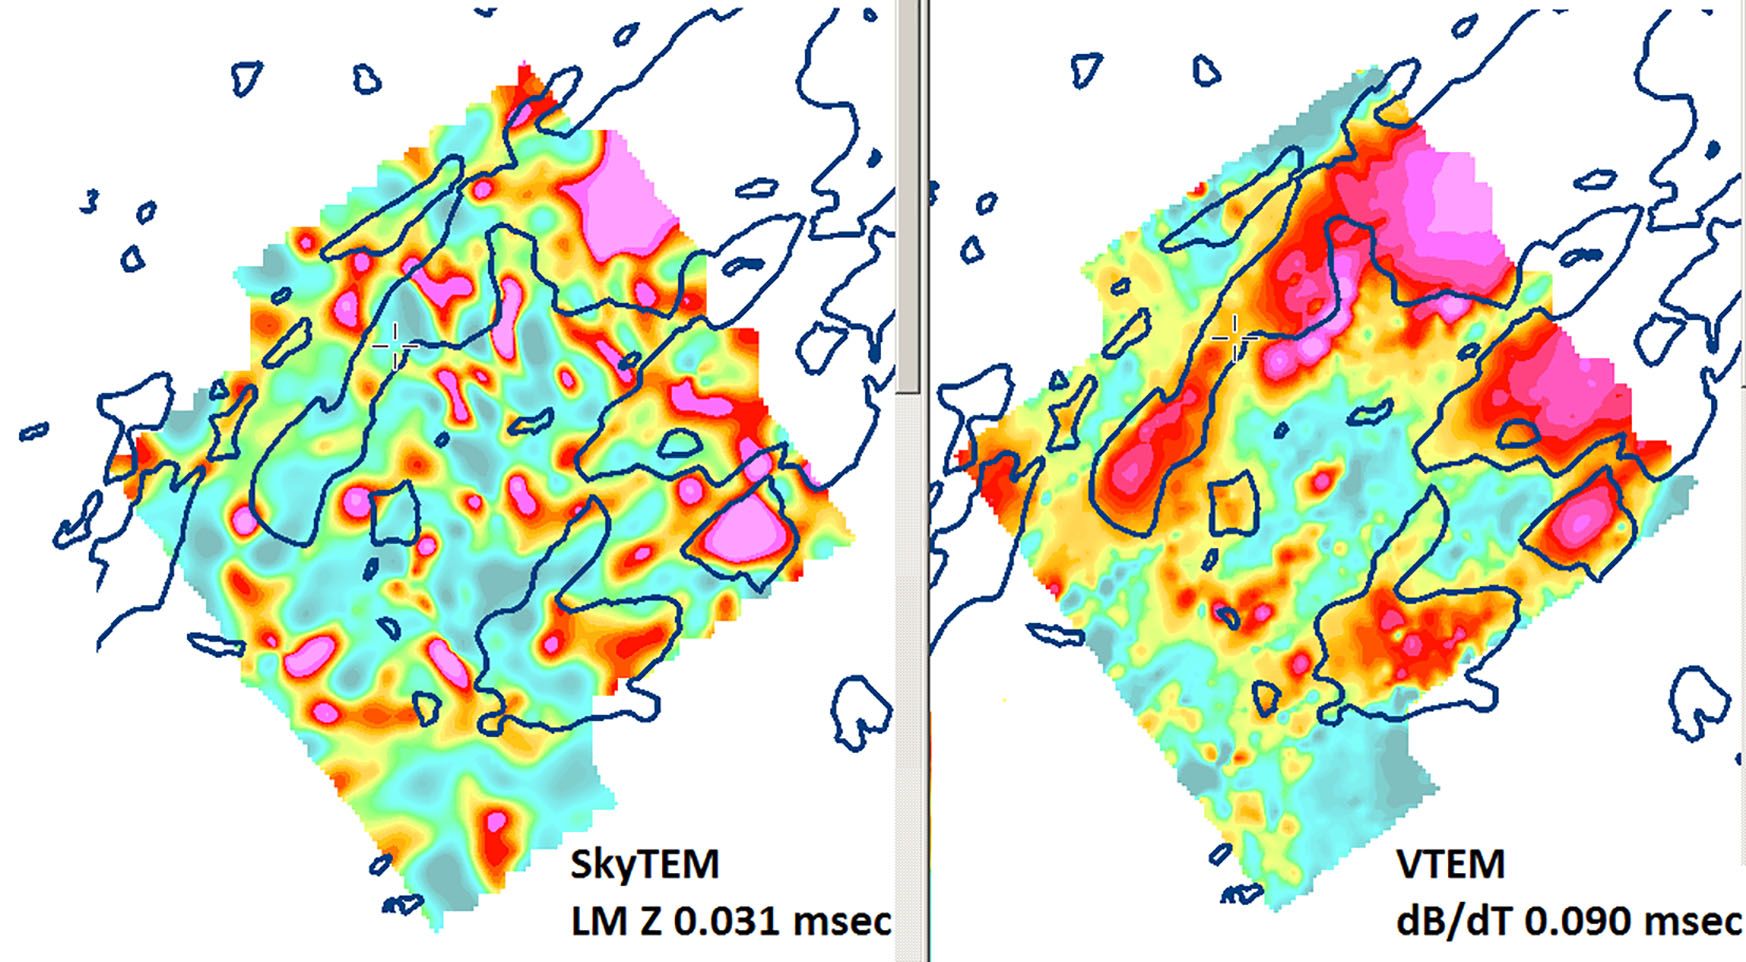
Figure 11 – SkyTEM (left) and VTEM (right) early time dBz/dT grids over lakes (contours)
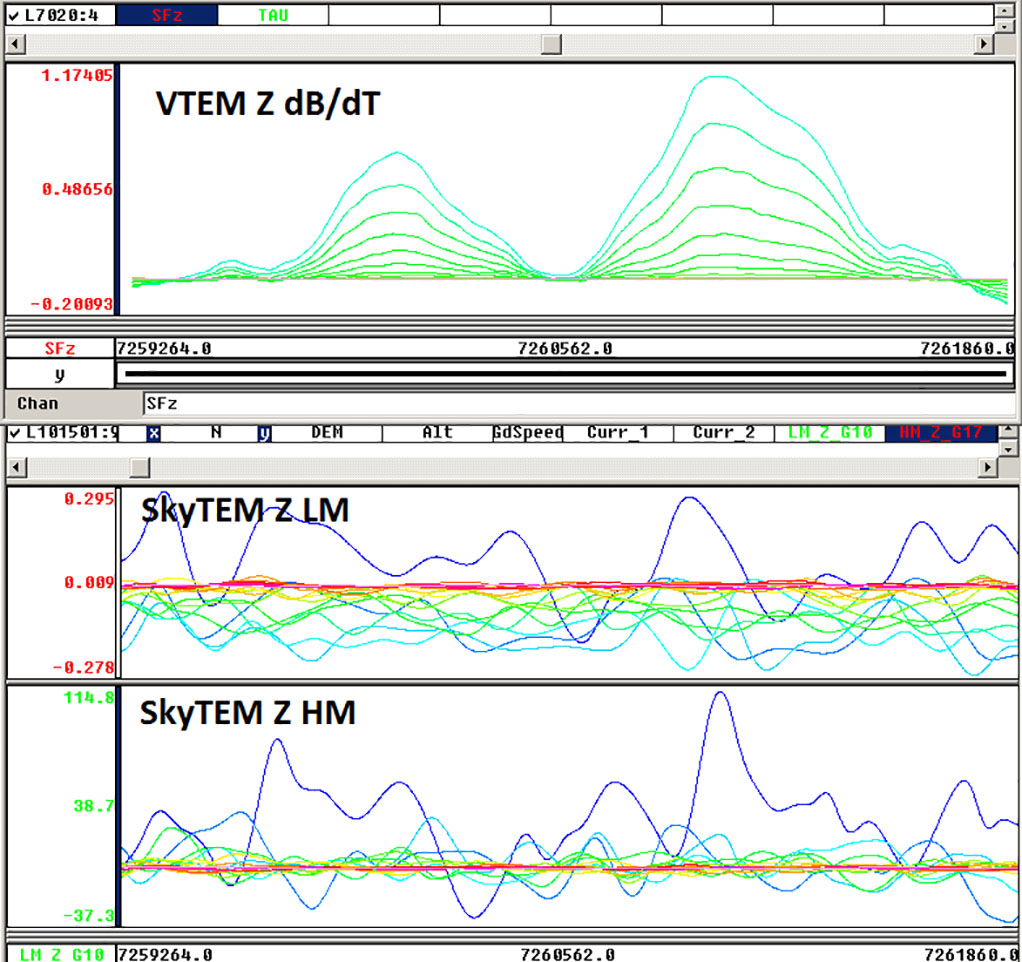
Figure 12 – VTEM (top, 7020 line) and SkyTEM (two profiles on the bottom, 101501 line) dBz/dT profiles over lakes (from Fig. 11).
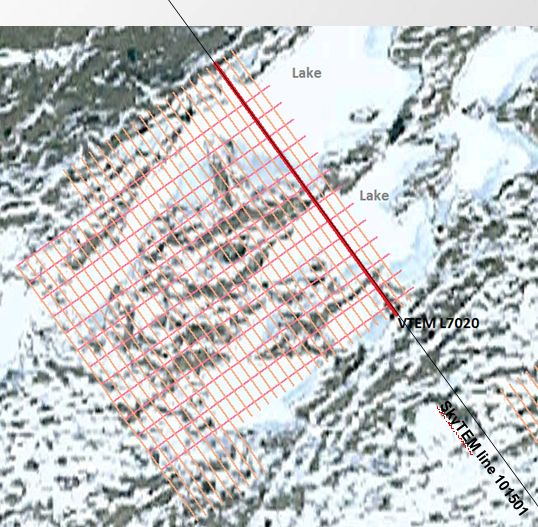
Figure 13 – Location of two coincident VTEM-SkyTEM lines over lakes
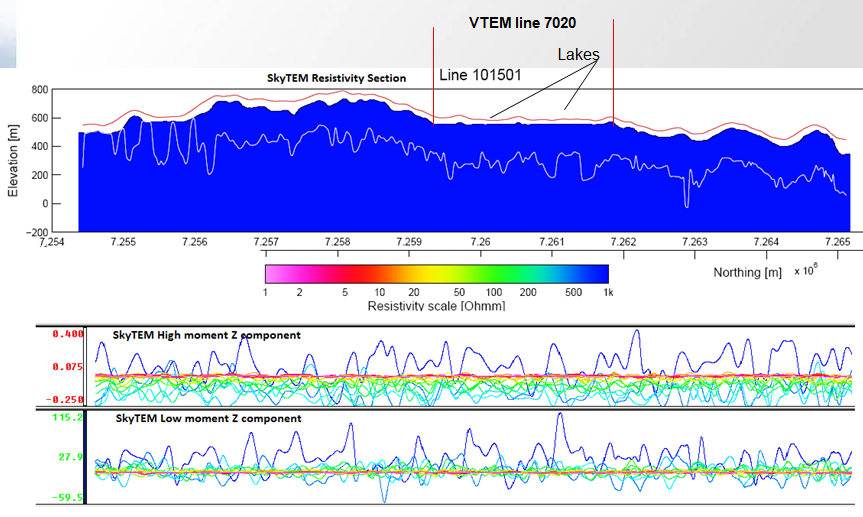
Figure 14 – SkyTEM 101501 line resistivity section (top) and high & low moment EM profiles (bottom)
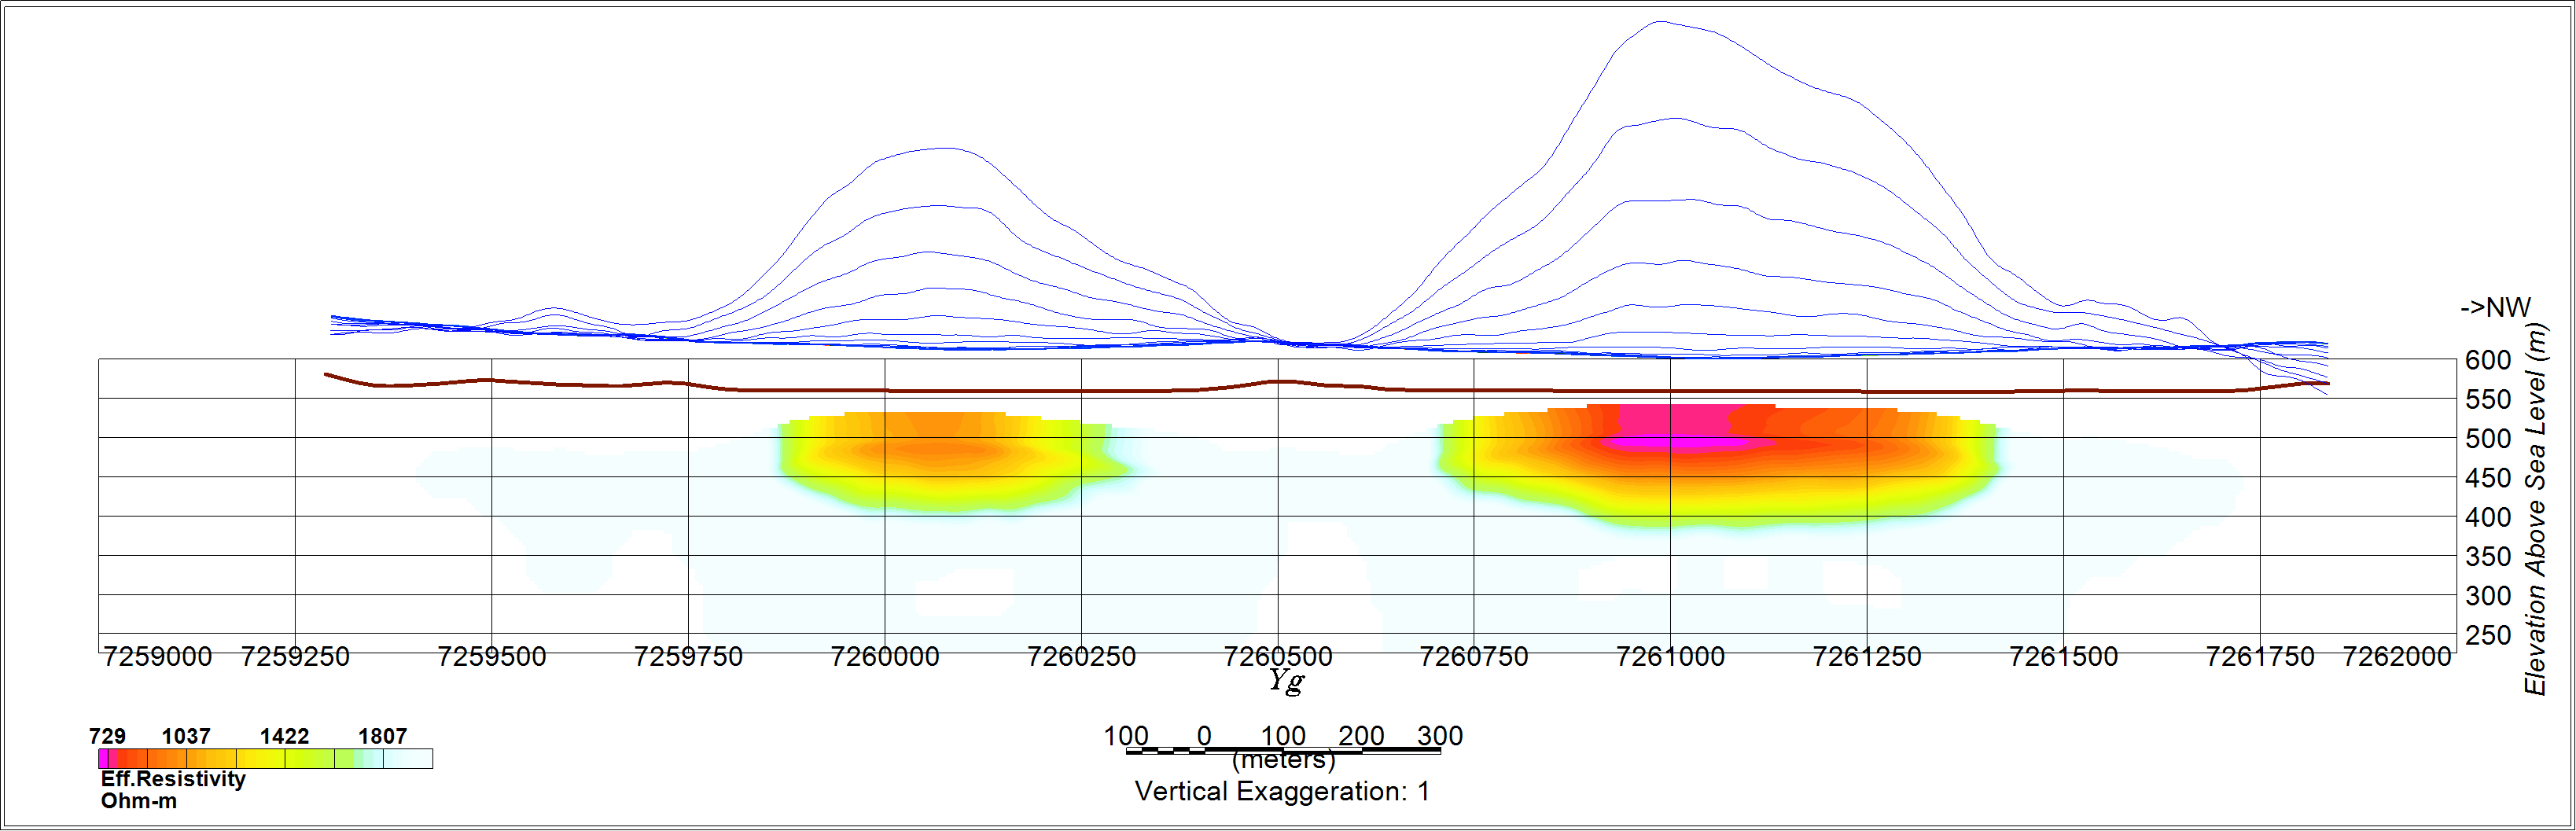
Figure 15 – VTEM 7020 line Resistivity-Depth Section and dB/dT profiles (see Fig. 13-14)
Part 4: VTEM-SkyTEM Noise Level Comparison
A highly resistive part of a line was chosen for the noise comparison between the VTEM and SkyTEM systems, shown using the same scales (units converted to pV/(A*m^4). The differences are clearly obvious, with the SkyTEM being 20-25 times noisier in late-times and 18-20 times noisier in early times, as compared to VTEM, as shown below:
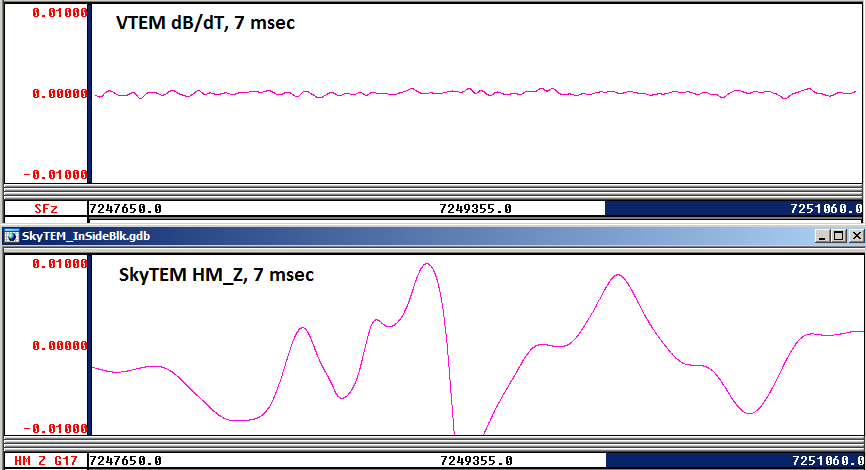
Figure 16 – Late time VTEM (top) and SkyTEM (bottom) noise levels
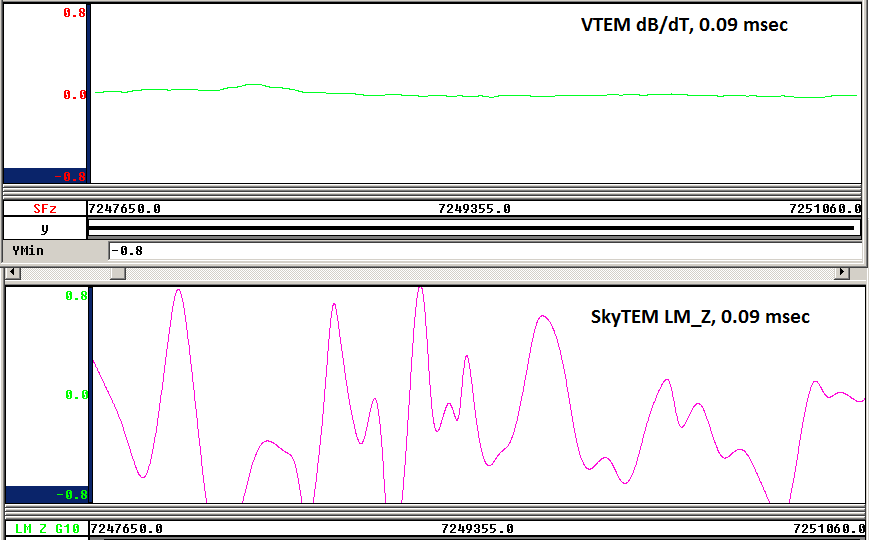
Figure 17 – Early time VTEM (top) and SkyTEM (bottom) noise levels
Conclusions
The current direct survey comparison in the GNB area of Greenland has highlighted the following differences between the VTEM and SkyTEM systems:
1) The estimated depth of investigation (DOI) of the VTEM system exceeds the SkyTEM DOI by a factor of 4-5 times. The SkyTEM system is not able to detect highly conductive targets below depths of 100-150 metres.
2) The VTEM system’s resistivity resolution, conductivity range and sensitivity are much higher in comparison with SkyTEM.
3) VTEM system provides reliable responses from weak and shallow conductors whereas SkyTEM system is not sensitive to this class of conductors.
4) SkyTEM late time noise is greater than VTEM late time noise by a factor of 20-25 times.
5) SkyTEM early time noise is greater than VTEM early time noise by a factor of 18-20 times.
6) Over the same 140 sq. km area, as many as 25-28 targets, sufficiently reliable for modeling, were obtained from the VTEM data.
7) In marked contrast, only 7-8 targets were obtained from SkyTEM data, including 3-4 that were only conditionally appropriate for modeling.