Presented at SAGEEP 2012, Tucson, Arizona, USA
For a PDF of this paper click here
Abstract
The most recent VTEM™ system development is designed to achieve fully calibrated time-domain EM decay for better near-surface mapping than was possible with previous VTEM systems. The new design, known as the “full waveform VTEM system” uses the streamed half-cycle recording of transmitter and receiver waveforms to obtain a complete system response calibration throughout the entire survey flight that helps to precisely eliminate the effect of the data acquisition system response on the recorded signals. The full waveform technology can be added to either the standard VTEM or VTEM early time systems.
In addition to improving the system bandwidth and the complete system response calibration, newly developed digital signal processing techniques have been applied that are aimed at reducing the effect of the input transmitter waveform and time-varying injected current using both a parasitic loop capacitance correction and a transmitter drift correction, as well as ideal waveform deconvolution. These implementations have helped improve the accuracy of the measured earth-response particularly in the earliest portions of the off-time EM decay.
Results of the full waveform VTEM helicopter system implementation over the Spiritwood Valley aquifer, in southern Manitoba, have shown a significant improvement in quantitative VTEM data at earlier times than previously achieved – as early as 18 μs after the current turn-off. This has resulted in improvements in the model space that include better definition of the near-surface heterogeneity and also a more compact resistive anomaly associated with the buried valley aquifer that is in good agreement with previous seismic and resistivity results.
Introduction
Early time or high frequency airborne electromagnetic data (AEM) are desirable for shallow sounding or mapping of resistive areas. Yet many time-domain AEM systems have problems obtaining quantitative early-time data due to a variety of issues, such as system bandwidth, system calibration and parasitic loop capacitance.
The helicopter-borne Versatile Time Domain Electromagnetic (VTEM) system (Witherly et al., 2004; Witherly and Irvine, 2006) is a geophysical instrument which has been in continuous development since its inception in 2002, utilizing the most recent advances in digital electronics and signal processing for deeper penetration, higher spatial resolution, better resistivity discrimination, and increased detection of a broad variety of conductive targets.
Although primarily known in mineral exploration, VTEM has also been used for near-surface and groundwater applications (Martinez, et al, 2008; Van den Berg, 2009; Legault et al., 2010 and 2011) However, although the VTEM system has progressively achieved marked improvements in its deep penetration characteristics, where the focus is on the quality of late-channel/time data, its near-surface imaging capability has been limited by its early time data.
Up until recently, research in shallow electromagnetic sounding had confirmed the calibration accuracy of VTEM mid to late delay time (>100 μsec to 10 msec) data – to within 2% of predicted values (Macnae, 2008; Davis and Macnae, 2010). At the same time, others have also identified quantitative incompatibility issues with VTEM earliest time-decay data (<100μsec) and near-surface conductivity layering (Davis and Groom, 2009 and 2010; Macnae and Baron-Hay, 2010; K. Martinez, pers., comms., 2011; Bedrosian et al., 2011). Macnae and Baron-Hay (2010) used experiments in deconvolution of early-time data at high altitudes to identify issues in VTEM early time data that were interpreted to be caused by parasitic capacitive current leakage in the transmitter loop circuit (similar to those found in ground TEM systems) as well as the limited frequency bandwidth of the system. They showed modeling the effect of loop capacitance would allow quantitative VTEM data at early delays in the 10-20 μsec range. However the required waveform deconvolution was not implemented in existing VTEM systems – a new VTEM system modification was required.
In an effort to address this issue, a continued system design strategy, aimed at improving its early-channel VTEM data, produced a dedicated early time receiver system in late 2010 (Legault et al., 2011). In 2011 further advancements in hardware and new digital signal processing techniques have now achieved fully calibrated, quantitative measurements closer to the transmitter current turn-off, while maintaining reasonably optimal deep penetration characteristics of the VTEM system. This development has led to a new model VTEM system, known as the “full waveform” system.
Theoretical Development
Accurate deconvolution of measured data to predict the response to an ideal waveform has several requirements. An essential physical requirement is that the system response be linear, which is the case for VTEM. Practical considerations arise in that the algorithms to do deconvolutions in the frequency domain require continuously sampled (streamed) data to produce frequency domain responses via FFT, and then do operations of the form:
R(ω) = D(ω) * I(ω) / A(ω) (1)
where R(ω) is the deconvolved receiver response (in frequency domain) corresponding to receiver data sample D(t) whose FFT is D(ω), I(ω) is the FFT of a reference or “Ideal waveform” and A(ω) is the FFT of the actual waveform. Deconvolution of airborne AEM to step response was first proposed by Annan (1986) for the “Prospect” fixed-wing system, which evolved into the Spectrem AEM system, and was later implemented in the Saltmap and Tempest AEM systems (Lane et al, 2000).
In a practical system, a factor in the received FFT D(ω) is the transfer function (complex frequency response) of the receiver sensor and the data acquisition system that records its output. Likewise the transmitter current FFT A(ω) is affected by the transfer function of the current monitor sensor and the data acquisition system. Consequently, R(ω) is affected by the transfer functions of the receiver, current monitor, and data acquisition system. For purposes of interpretation and inversion, it is desirable for R(ω) to be independent of these sensor characteristics. To achieve this, the responses recorded in all channels of the data acquisition system are corrected to a common transfer function:
D(ω) = ( HC(ω) / HD(ω) ) DR(ω) (2)
A(ω) = ( HC(ω) / HR(ω) ) AR(ω)
where HC(ω) is the common transfer function, HD(ω) is the transfer function of the receiver and data acquisition system, HR(ω) is the transfer function of the current sensor and data acquisition system, and DR(ω) and AR(ω) are the FFT’s of the raw receiver and current sensor responses recorded by the data acquisition system. It can be seen that changing the corrected common transfer function HC(ω) does not affect R(ω) because the contributions to R(ω) cancel in equation (1).
An added benefit of this processing step is that the system bandwidth can be increased by appropriate selection of the common response, if the S/N ratio permits. This requires accurate knowledge of the response of each channel at each frequency present in the signal. After this sensor response calibration correction, D(ω) and A(ω) are ready for deconvolution processing.
The first step in deconvolution processing is the correction for transmitter waveform drifts, which occur slowly due to temperature changes, and rapidly with “jitter” between the timing signals controlling the transmitter switching and the receiver sampling. We chose typically a high-altitude average actual waveform C(t) as a reference and take its FFT to be C(ω). The actual transmitter waveform A(t) at every fiducial suffers from minor drift and timing jitter and, thus, its FFT A(ω) is not absolutely identical to C(ω). Correcting the data in frequency domain by the ratio of C(ω)/ A(ω) provides an almost perfect drift and timing jitter correction. Writing the RHS of equation (1) as:
R(ω) = D(ω)*( I(ω)/C(ω) )*( C(ω)/A(ω) ) (3)
we see that the ratio of I(ω)/C(ω) provides deconvolution to an ideal response, while the ratio C(ω)/A(ω) provides drift and jitter corrections. It may look as if C(ω) appears on the top and bottom line of equation (3) and could simply be cancelled, leaving I(ω)/A(ω), as in equation (1), but we need to intersperse a correction process before final deconvolution.
After drift and jitter correction, a constant parasitic response may be subtracted from the receiver data. The details of how the parasitic response is measured are beyond the scope of this paper, but its cause is displacement current leakage through stray capacitance between the transmitter cable wires, and its waveform approximates the time-derivative of the transmitted waveform that flows galvanically in the loop wire (Macnae and Baron-Hay, 2010).
The third step in deconvolution processing is transformation of drift, jitter and parasitic corrected data to a more ideal waveform using (again) equation 1. We redefine I(ω) as the FFT of a desired waveform such as a step or a clean ramp, successively get the actual waveform A(ω) from each halfwave response measured at high altitude or on survey line. Again, only odd harmonics with adequate S/N ratios are used in this transformation.
Because of system bandwidth constraints, it is impossible to deconvolve to a perfect step or impulse response, since these contain higher frequencies than the measurement hardware collects. Considerable testing has been required to ensure that the “Ideal waveform” that is the target of deconvolution does not contain large discontinuities. The consequence is that deconvolution in FFT domain provides considerable quantitative improvement, without achieving perfect results.
Spiritwood Valley Acquifer
To test the full waveform VTEM system implementation, the Spiritwood Valley was chosen as a test area based on the availability of previous airborne and ground EM, seismic, borehole geophysical and well-log data from the study of a shallow freshwater aquifer by the Geological Survey of Canada (Oldenborger et al., 2010 and 2011; Oldenborger, 2010a and 2010b). The Spiritwood Valley is a 10-15km wide northwest-southeast trending, buried bedrock valley that extends between Killarney and Cartwright (Figure 1) and extends 500km from Manitoba, across North Dakota and into South Dakota.
The valley lies within a till plain with little topographic relief but has been defined by a series of borehole transects and seismic reflection data collected north of Killarney. The stratigraphy within the valley is variable but includes a basal, shaly sand and gravel, and overlying clay-rich and silty till units. But the sand and gravel is only found in incised valleys, making for a valley-within-valley morphology. The underlying bedrock is a conductive, fractured, silicious shale. According to borehole resistivity log results (Figure 2b), the simplified electrical section consists of three main units: 1) till (40-50 Ohm-m); sand & gravel (70-200 Ohm-m); and shale bedrock (5-50 Ohm-m). The estimated water resistivity within the sand and gravel unit is 25-110 Ohm-m. The relatively high resistivity of the sand and gravel unit makes it a marker unit for the incised valleys that are of significant interest for groundwater management (Oldenborger et al., 2010).
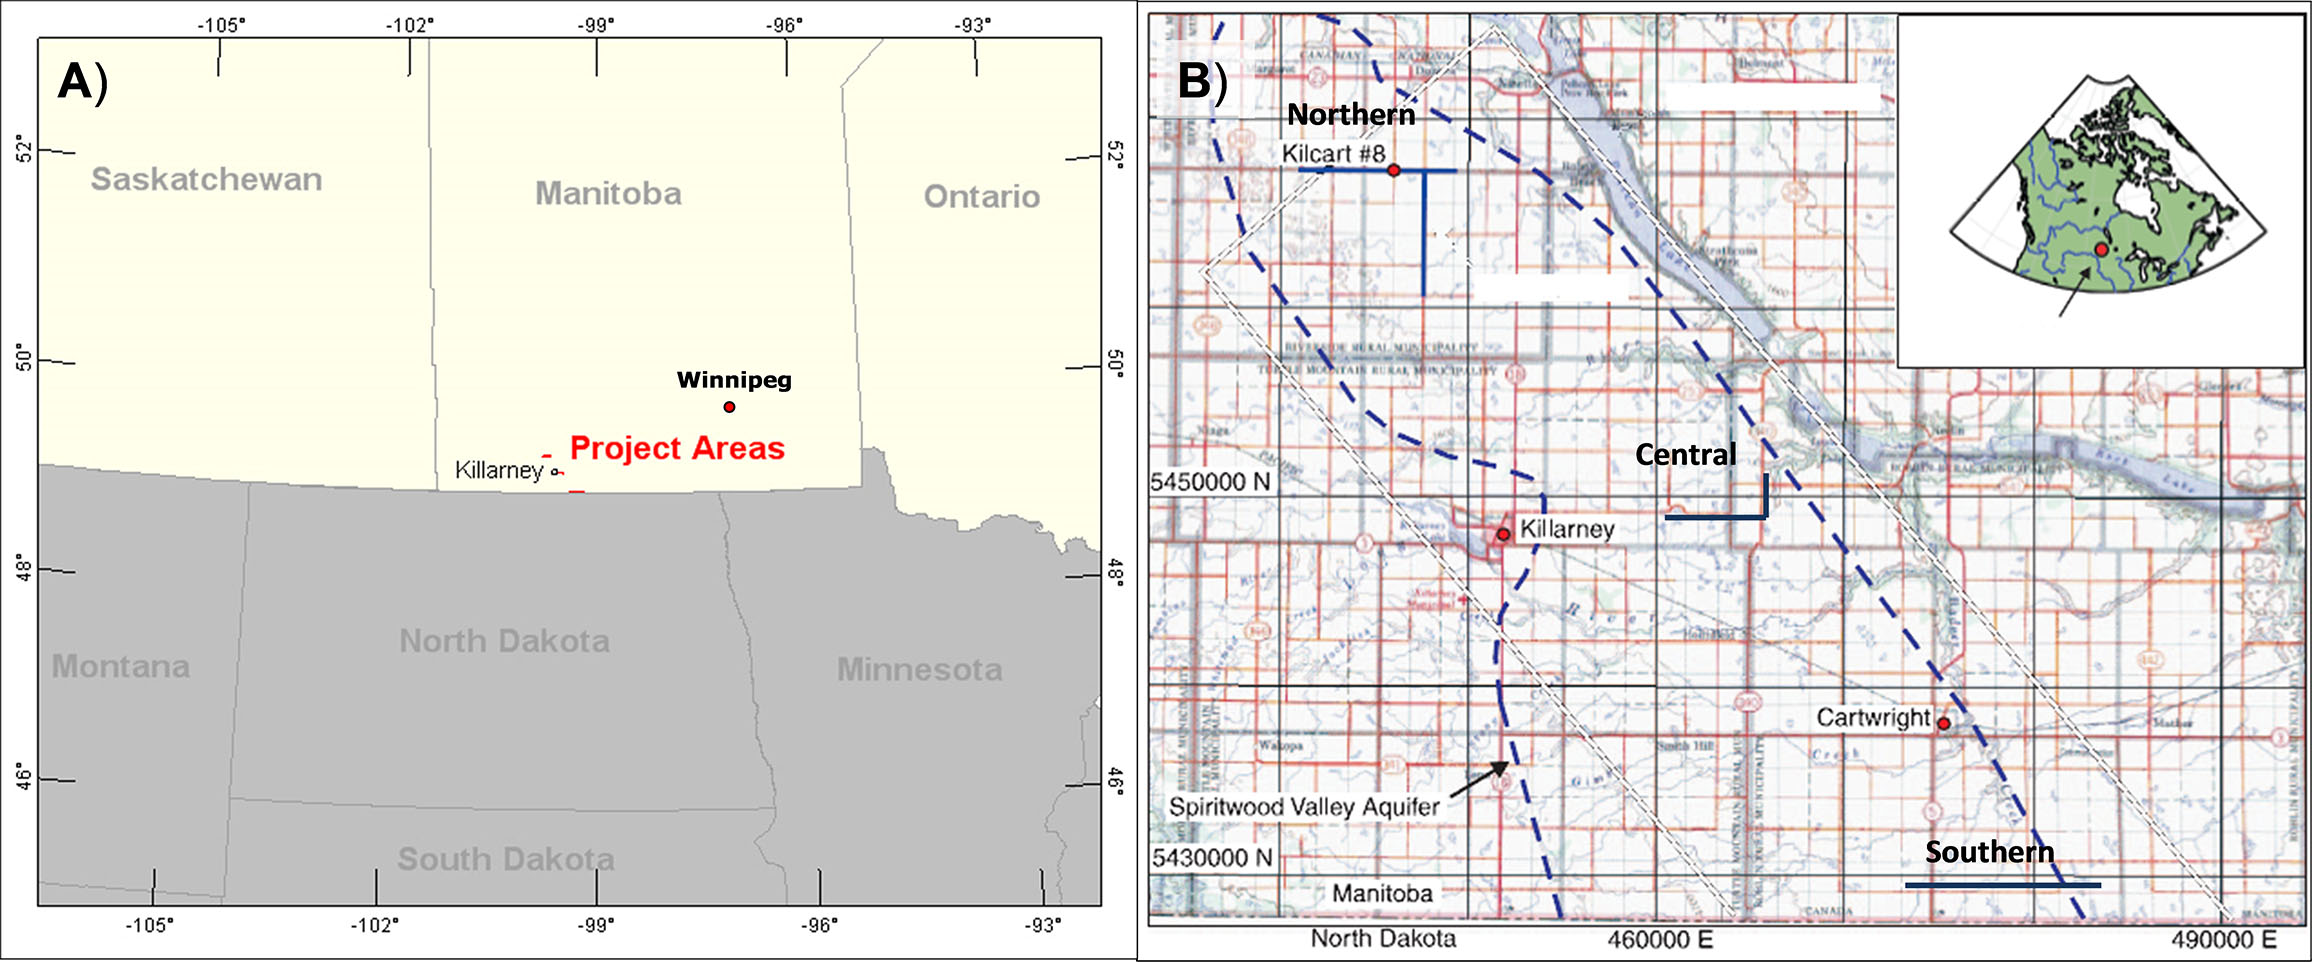
Figure 1: A) Spiritwood Valley survey general location map, B) Outline map of the Spiritwood Valley aquifer based on overburden thickness, showing VTEM survey lines (modified after Oldenborger et al., 2010).
Figure 2 shows an example of an inverted resistivity model for ground electrical tomography (ERI) and airborne electromagnetic (AEM) data, acquired below the northernmost EW profile of the current VTEM survey area (see Figure 1), and compares it to the 3-component (3C) seismic reflection data. The resistivity results show the relatively higher resistivities associated with the deepest part of the valley, suggesting that these sediments are potential aquifer targets. Synthetic modelling of the inversion results shows that the channel anomaly is consistent with erosion of both a supra-bedrock layer (till) and bedrock.
The results indicate that ERI provides superior spatial resolution, with layer-depths that compare well with the seismic, while the AEM has more limited dynamic range (i.e., true unit conductivities and resistivities not well recovered). However because of the denser coverage provided by AEM, in combination with ERI and seismic, groundwater path flows, hydraulic barriers and hydraulic connections are more easily inferred and provide the sense of a full valley geometry. Calibration of the AEM is necessary to accurately map information with depth (Oldenborger et al., 2011).
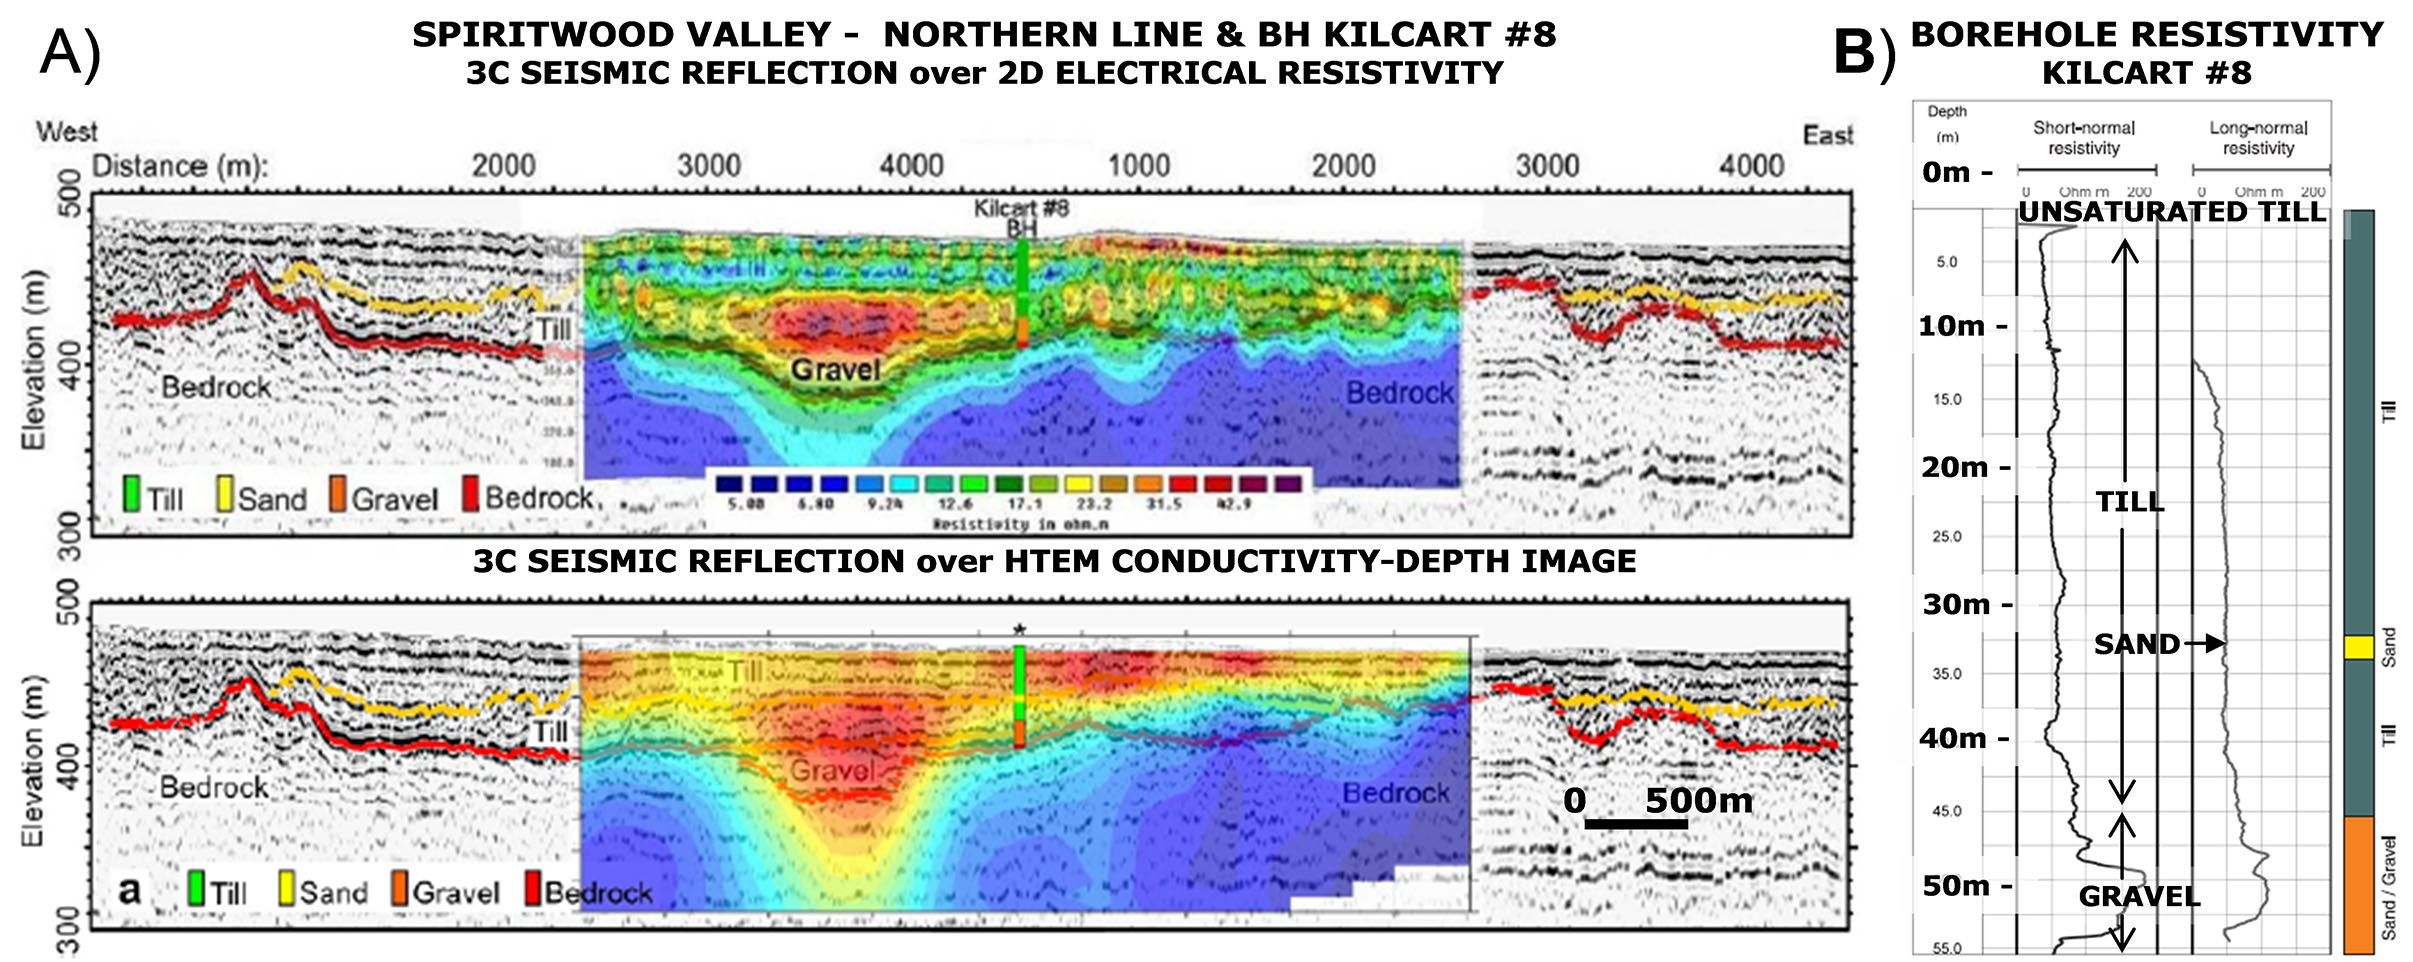
Figure 2: A) P-wave seismic section at the north end of the area, overlain with the surface electrical resistivity inversion (ERI) results (above) and airborne EM conductivity-depth image (below). Borehole Kilcart #8, located in the centre of this section, encountered ~15 m of sand and gravel above bedrock (from Oldenborger et al., 2011). B) Borehole resistivities from short- and long-normal logs for Kilcart #8, showing high resistivities in freshwater-rich sand and gravel layer. Influence of lower resistivity bedrock shale observed at base (~60m) of borehole log (after Oldenborger et al., 2010).
Full Waveform VTEM System and Data Processing
The VTEM system (Witherly et al., 2004) has a 26 metre diameter, vertical axis, 4 turn transmitter coil that produced over 531,000 NIA of dipole-moment, giving it its deep penetration capability. The standard VTEM (VTEMPLUS) system configuration consists of a 2- or 3-axis (Z-vertical, X-horizontal along line, and optional Y-horizontal across line) induction type (dB/dt) EM receiver coils deployed in the middle of the transmitter coil and two (2) optically pumped caesium magnetometers/ gradiometers suspended above it (Figure 3). The horizontal in-loop transmitter-receiver geometry (coincident-coplanar) produces a symmetric response that is well suited for sounding applications – with the standard (100 turn x 113m2) and early time (25 turn x 28.3m2) receiver coils both utilized (only standard VTEM results shown here). During the Spiritwood survey the helicopter was maintained at a mean height of 75 metres above the ground with a nominal survey speed of 80 km/hour. This allowed for an average EM sensor terrain clearance of 43 metres and a magnetic sensor clearance of 61 metres.
The VTEM transmitter is digitally controlled and can easily operate in a variety of base frequencies, using different pulse widths and shapes. The pulse shape is trapezoidal and elongated to approximate a step response. At Spiritwood, a 4.073 millisecond pulse width was utilized. The digital acquisition system at the EM receiver utilizes 24 bit A/D sampling at 192 kHz. The data recording rates at output are 0.1 second for electromagnetics and magnetometer, as well as 0.2 second for altimeter and GPS. This translates to a geophysical reading about every 2 metres along flight track. Navigation is assisted by a WAAS enabled GPS receiver and data acquisition system, with a positional accuracy of 1.0-1.8m, and which reports GPS co-ordinates as latitude/longitude and directs the pilot over a pre-programmed survey grid. The EM dBZ/dt and calculated BZ-field decays are derived using forty four (44) time measurement gates in the 18 to 9977 μs range after the end of the pulse (Figure 3b).

Figure 3: a) VTEM helicopter system, showing time-domain EM system and magnetic sensor configuration in flight (top) and b) VTEM “ideal” transmitter current waveform, after deconvolution, and off-time receiver time-gate positioning in off-time (bottom).
The full waveform VTEM system was developed in late 2011 for improved early time data using standard VTEM as well as VTEM early time systems. The significant features of the full waveform system are: a) streamed half-cycle recording of transmitter and receiver waveform data, and, during the post-processing stage, b) continuous sensor response calibration, c) transmitter drift & parasitic noise correction, and d) ideal waveform deconvolution.
The accuracy of quantitative EM data interpretation of the geology at depth depends greatly on the knowledge of the uppermost part of subsurface. In EM methods, data at high frequencies (for frequency domain methods) and at early times (for time-domain methods) are most responsible for obtaining near-surface information.
Yet there are two main sources of distortion of early-time data in time-domain technique: first, the low-pass filters applied in the receiver electronics (Auken et al., 2000) and, second, the transmitter current turn-off. Special procedures have been developed for the VTEM system which correct for the consequences of the factors and are described below.
The sensor response calibration procedure uses a precisely known test waveform to measure the sensor channel responses at each frequency within the system bandwidth before flight. The measured responses are used to correct the half-cycle waveforms acquired on a survey flight. The half-cycle waveforms of each channel are corrected to obtain the waveforms that would be recorded if the time-domain responses of all the channels, including the reference channel, were the same ideal Gaussian-like response. The ideal response is defined by its bandwidth.
A streamed current monitor and streamed receiver data are used for transmitter drift correction and ideal waveform deconvolution (Figure 3b). The deconvolution procedure corrects one complete period for linear system imperfections including transmitter current drift through the following operation:
Where R(t) in equation 4 is the desired response (corresponding to R(w) in frequency domain), C is the instantaneous current monitor and C0 the averaged high altitude reference current monitor measurement, B the instantaneous survey data and H0 the averaged high-altitude data respectively. W(w) is an ideal waveform for which the response is desired (Macnae and Baron-Hay, 2010).
After the calibration and deconvolution procedures, standard digital filtering processing were then applied to the VTEM data to further reject major sferic events and to reduce noise levels.
The successive improvements that result from the various stages of the full waveform VTEM processing are illustrated in the following examples from the Spiritwood Valley survey.
1) VTEM sensor response correction procedure clears the data from the influence of low-pass filtering. The results of the procedure are frequency response corrected data, as shown in Figure 4.
Figures 4a and 4b compare the VTEMPLUS dBz/dt decay curves, before and after the sensor response correction has been applied. Prior to the correction, only VTEMPLUS data in the >90 us range would normally be considered to be reliably unaffected by the sensor response (Figure 4a). However, as shown in Figure 4b, after the sensor response correction, reliable EM decays might be inferred to extend as early as 34 us (based on the increasing slope/linearity of the response) and possibly earlier. As well, comparing Figures 4a & 4b, there are visible differences in the dB/dt response that also extend to later than the 0-245 us decay window shown. Clearly, therefore, the system response calibration correction has had a significant impact on the accuracy of the early time data from the VTEM system.
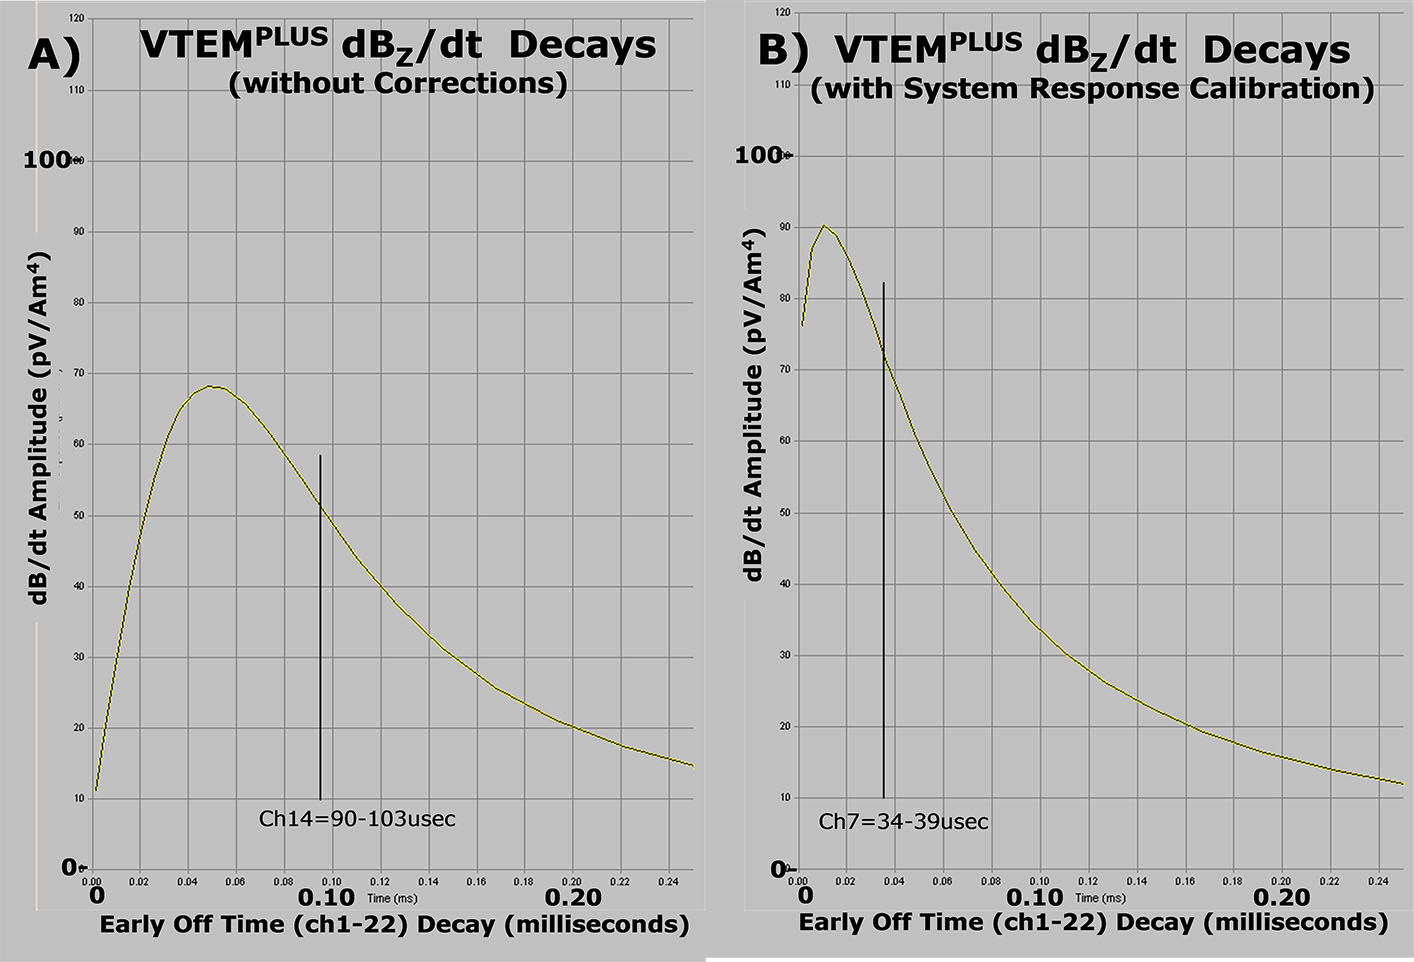
Figure 4: Early off-time VTEM dBz/dt decays before (top – A) and after (bottom – B) system response calibration correction.
2) The Ideal waveform deconvolution procedure removes the effects of remanent “parasitic” currents and transmitter drift from the data, which results in a reduced secondary EM response. The results are shown in Figures 5 and 6.
Figures 5a and 5b compare the initial waveform, before deconvolution, and the ideal waveform, after deconvolution. Figure 5c compares the primary voltage measured at the receiver from the initial and ideal waveforms. The effect of the deconvolution is exhibited in 3 ways: First, as indicated in Figure 5a, the presence of current flow in the loop at the end of the current turn-off is obvious in the non-deconvolved data, whereas it is greatly reduced in the deconvolved data in Figure 5b. Secondly, the loop current flow is reduced to zero more quickly in the deconvolved versus the non-deconvolved waveforms. And thirdly, the speed of the current turn-off is faster in the deconvolved data relative to the non-deconvolved, resulting in a steeper turn-off ramp, as shown in Figure 5c. All of which contributes to more accurate, uncontaminated EM decays closer to the end of the current turn-off.
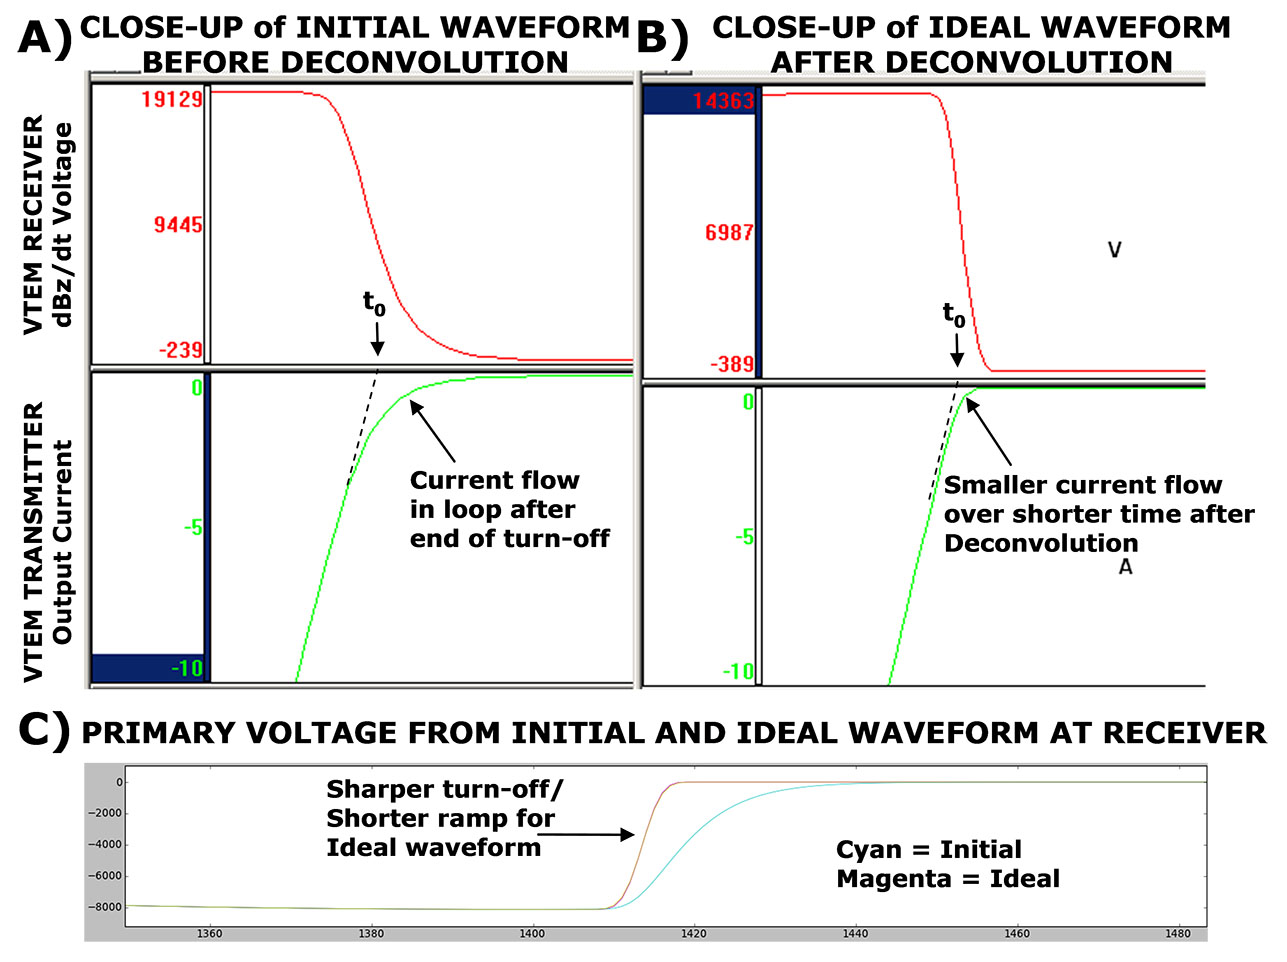
Figure 5: Early time VTEM dBz/dt transmitter and receiver waveforms before (above top) and after (above middle) ideal waveform deconvolution; as well as the effect on the primary field measured at the receiver (bottom).
Figures 6a and 6b compare the VTEMPLUS dBz/dt decay curves, before and after the ideal waveform deconvolution has been applied. Prior to the deconvolution, the VTEMPLUS data in the >34 us range appear to be reliably unaffected by parasitic current flow and transmitter drift (Figure 6a). However, as indicated in Figure 6b, after the ideal waveform deconvolution, reliable EM decays appear to extend as early as 18 us after the end of the current turn-off. Clearly, the parasitic noise and transmitter drift corrections that have been obtained during the deconvolution process have resulted in considerably more of the EM decay to be sampled in early times from the VTEMPLUS system.
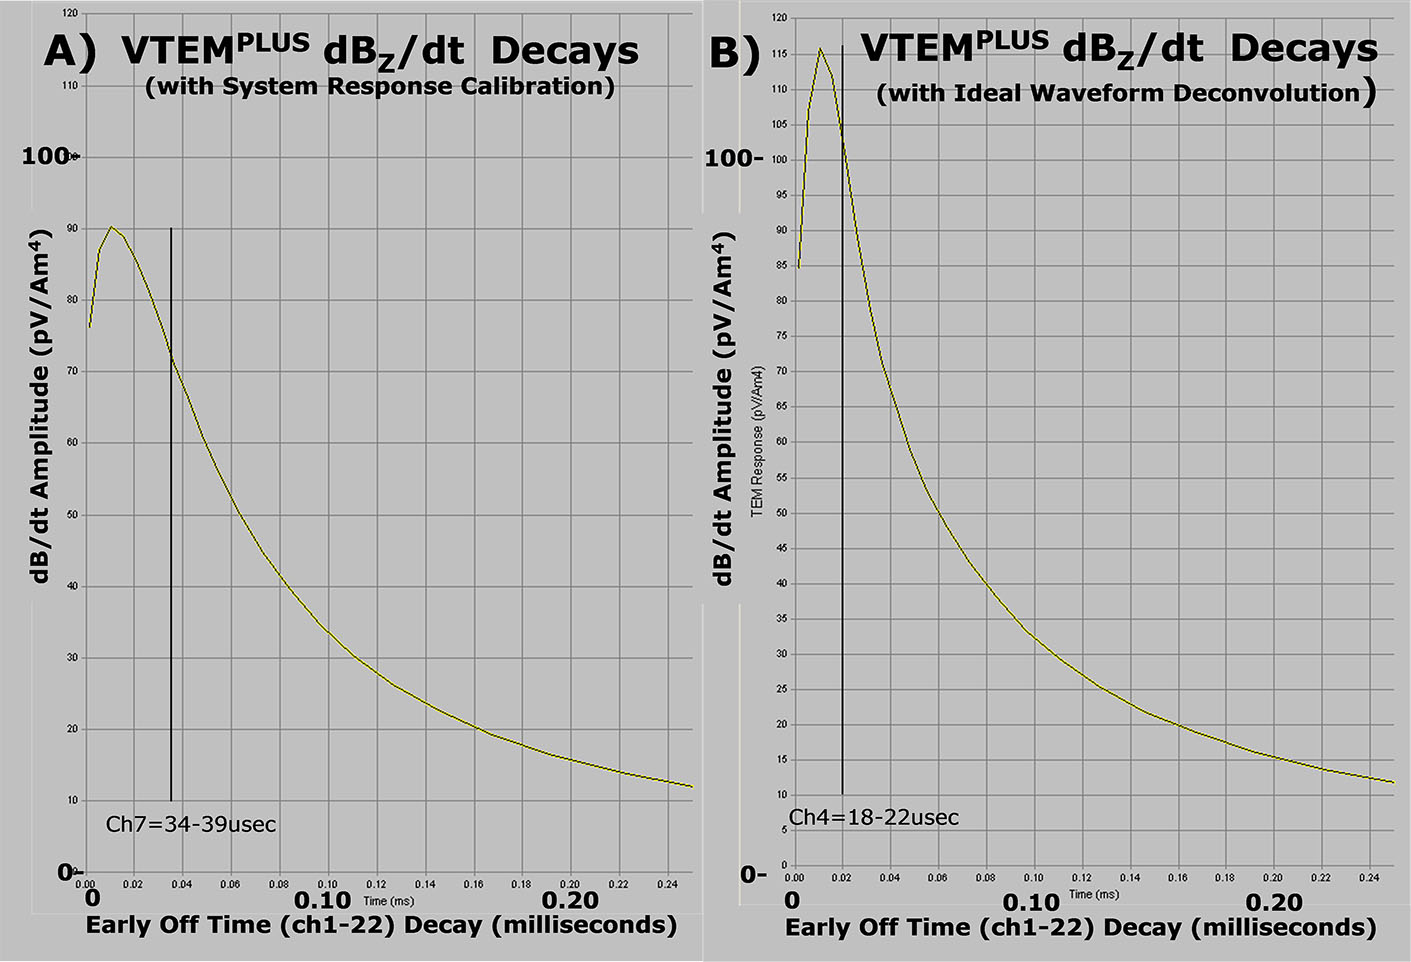
Figure 6: Early off-time VTEM dBz/dt decays before (top – A) and after (bottom – B) system calibration correction and ideal waveform deconvolution.
Figure 7a and 7b illustrate the differences between 1d inversion results obtained from regular (non calibrated and non-deconvolved) VTEMPLUS data (a – left) and from the same VTEMPLUS data after the repairing procedures obtained after the full waveform processing (b –right). Both inversions used identical 5-layer starting models (Figure 8).
As shown, although at first glance, the final 1D model from the regular (non-calibrated and non-deconvolved) VTEM data, in Figure 7a, appears normal, in fact, the resistivity-thickness parameters in Figure 7b, from the full waveform processed VTEM data, are closest to actual real earth layering. The following limitations have been exposed in the regular VTEM, due to its 96 us earliest time data, in relation to the full-waveform VTEM, with its EM decay data as early 20 us, and the known geology: First, although both models show similar resistive upper layers, in fact, not only are the regular VTEM model and data not sensitive to the first resistive layer but, as well, unlike the full-waveform VTEM, the model-data fits for regular VTEM are clearly poor in early times. Second, the thickness of the second layer is overestimated by 20 metres in the regular VTEM inversion model relative to the known geology and the full-waveform VTEM model. And third, the depths of the next two layers are overestimated accordingly in the regular VTEM model, as compared to known geology and the inversion model from the full waveform processed VTEM data.
These inversion results are good examples of how the accuracy of near-surface model, as provided by the earliest possible EM decay data, can indeed affect the accuracy of the deeper parts of the subsurface layered earth model, as indicated earlier. The practical result is that the Spiritwood valley will be imaged more accurately (i.e., not overly deep) based on the full waveform VTEM results.
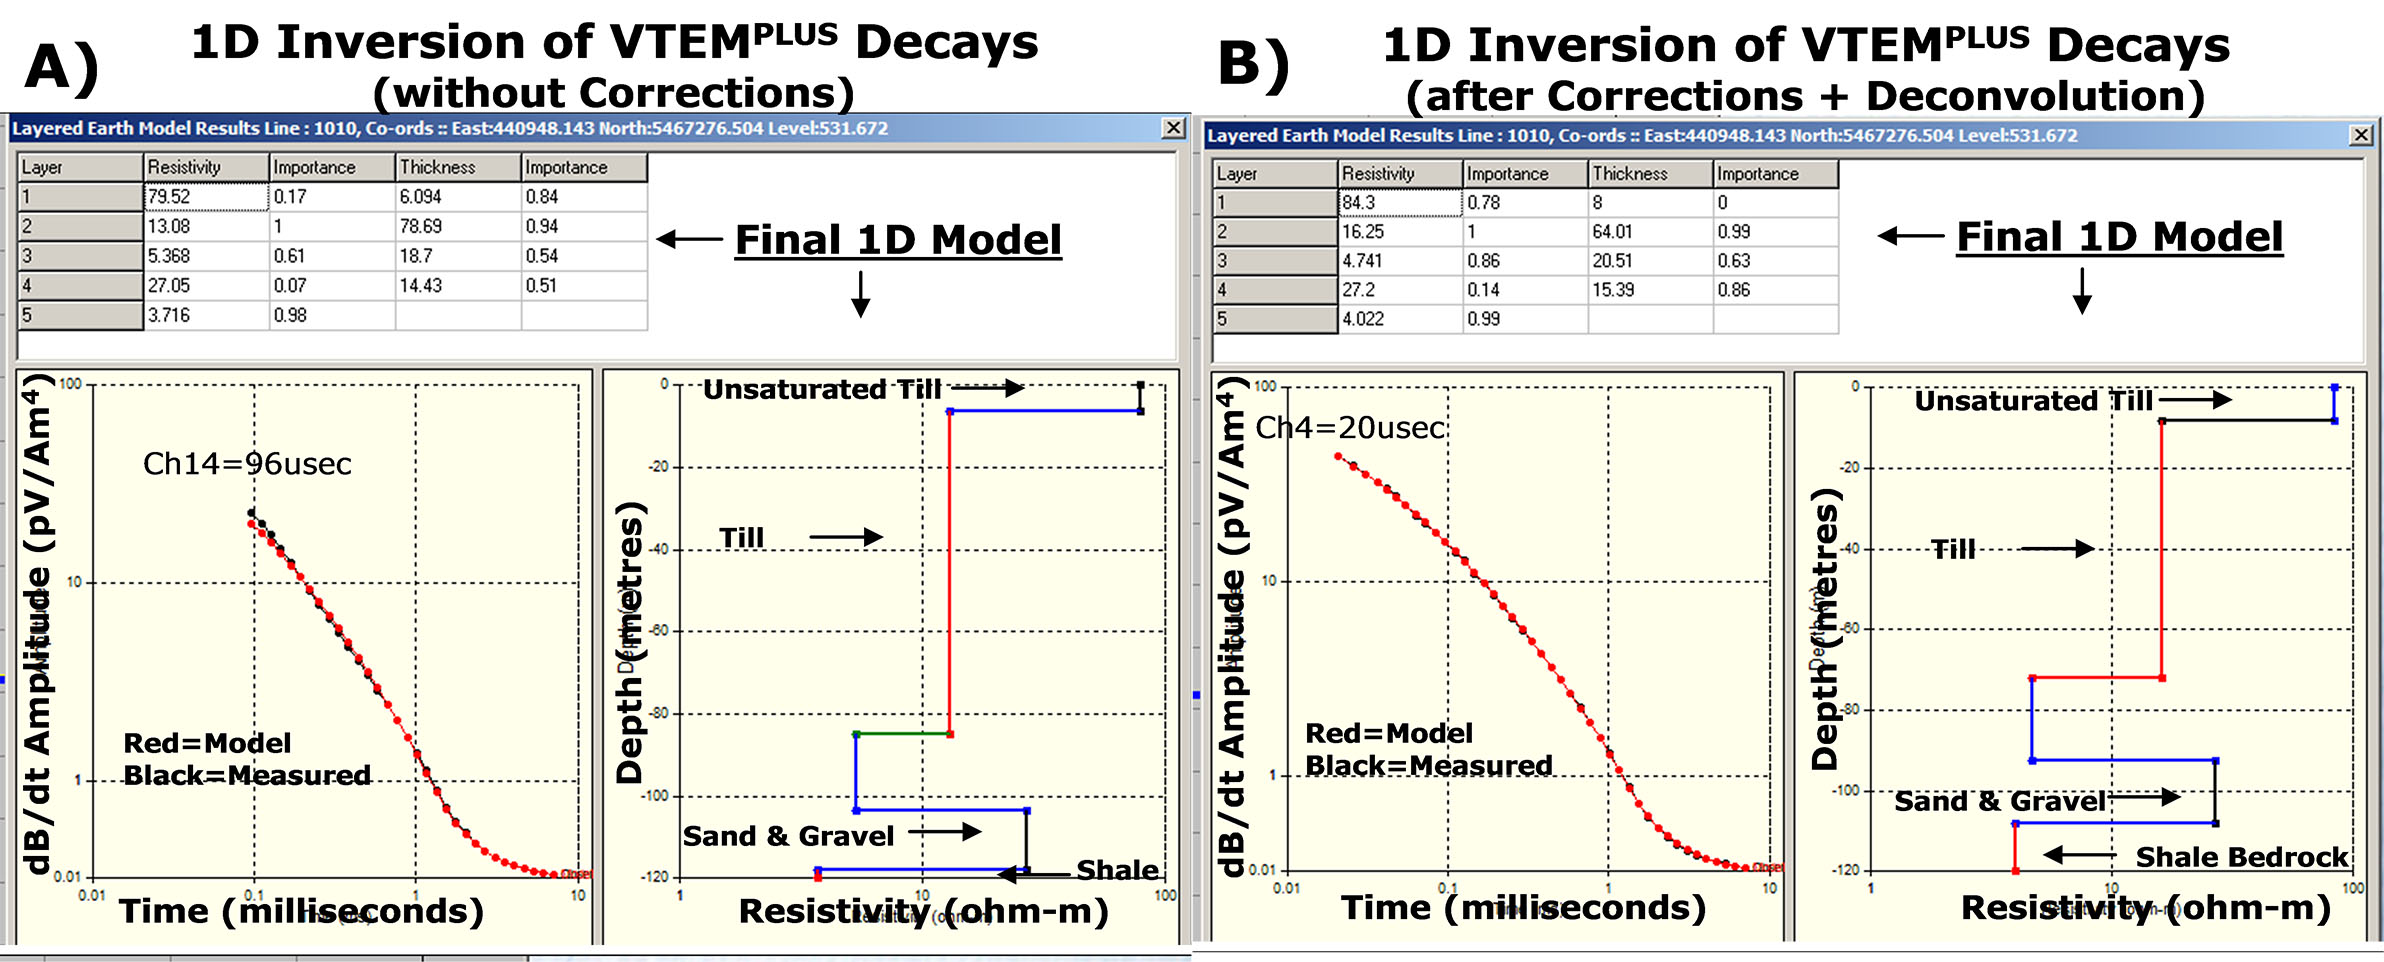
Figure 7: 1D inversion of VTEM dBz/dt decays before (a – left) and after (b – right) system calibration correction and ideal waveform deconvolution.
Full Waveform VTEM System Testing at Spiritwood Valley
During Fall, 2011, Geotech conducted a helicopter-borne geophysical survey over the Spiritwood Valley test area that extends from approximately 20 km north to nearly 28km of Killarney, Manitoba (Figure 1). The survey was conducted across three separate reconnaissance test areas that matched ground seismic and ground resistivity survey work undertaken previously by the GSC (Oldenborger et al., 2010 and 2011) and consisted of three sets of east-west and 1 set of north south lines. Both the standard VTEM and VTEM early time systems were repeatedly flown over each set of lines, for a total of 217km surveyed.
The VTEM survey results were initially processed using standard methods, with the system calibration correction and the parasitic-noise/transmitter-drift/ideal-waveform-deconvolution corrections applied in a separate post-processing step using the full-waveform data. The VTEM data were then treated with 1D laterally constrained-inversions (LCI) using an in-house developed heuristic laterally constrained inversion (HLCI) that is based on the AirBeo layered earth 1D TEM inversion code (2007, CSIRO/AMIRA). Shown below are examples of VTEM inverted data for northern, central and southern Spiritwood Valley test lines (see Figure 1).
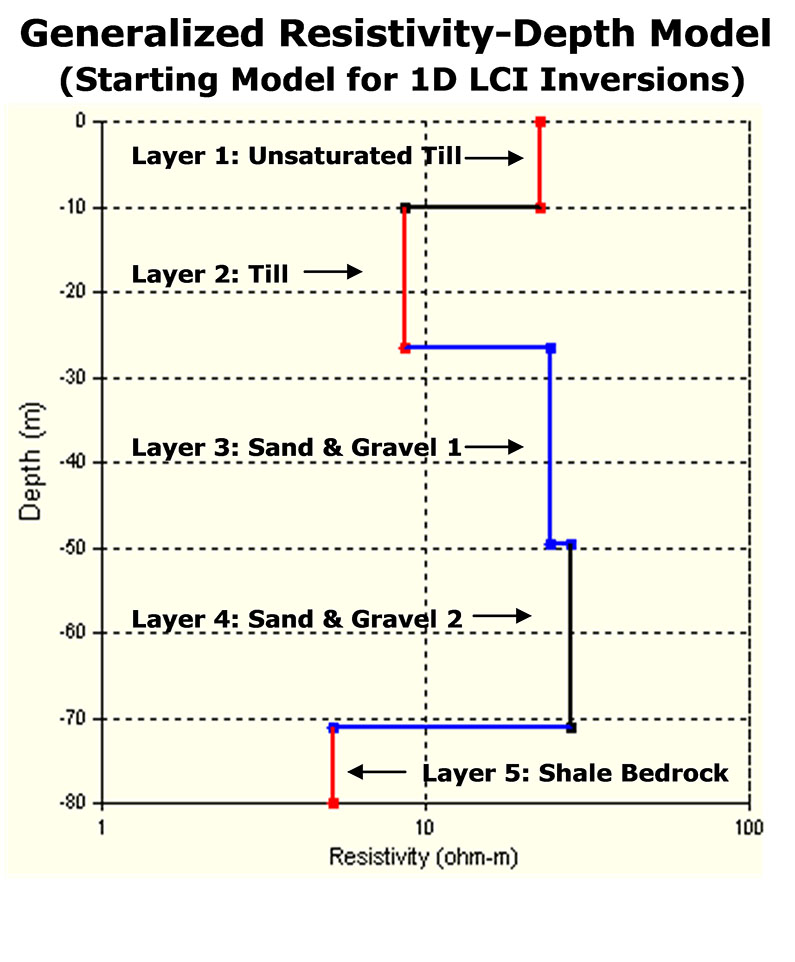
Figure 8: Generalized resistivity-thickness model based on ground ERI resistivity results from northern survey line
Figure 8 presents a general resistivity-thickness model for the northern part of the aquifer based on the ground data previously shown in Figure 2. Figure 9 presents an example of the inverted resistivity model for the ERI data acquired at the northern end of the AEM survey area (see Figure 1), and compares it to the seismic reflection data acquired along that line. The resistivity results show the relatively higher resistivities associated with the deepest part of the valley, suggesting that these sediments are potential aquifer targets. Synthetic modelling of the inversion results shows that the channel anomaly is consistent with erosion of both a supra-bedrock layer (till) and bedrock. Synthetic modeling suggests that the resistive valley fill has a true resistivity of ~40 Ω m and that the shale bedrock has a true resistivity of ~5 Ω m.
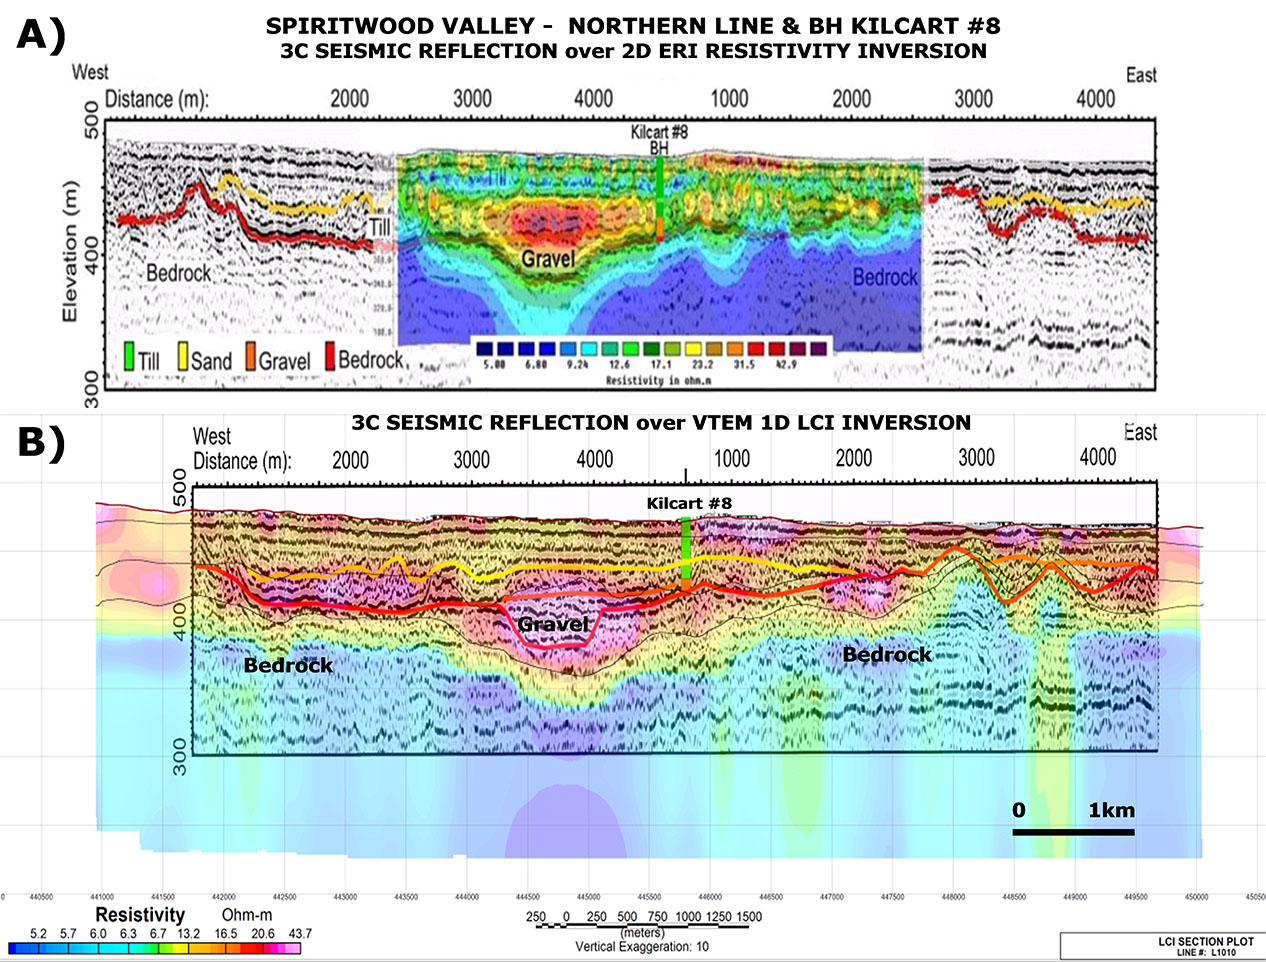
Figure 9: A) P-wave seismic section at the north end of the area, overlain with the surface electrical resistivity inverted data (top section). Borehole Kilcart #8, located in the centre of this section, encountered ~15 m of sand and gravel above bedrock. B) VTEM LCI inversion section overlain with seismic section (seismic and ERI data from Oldenborger et al., 2011).
Comparing the ground ERI and VTEM resistivity sections in Figure 9a and 9b, respectively, the high resistivity resolution of VTEM data is noticeable, i.e., the range of resistivities of the geological units changes across very narrow range (1-45 Ohm-m). As well, the inverted VTEM data resolve layering in the uppermost parts of the subsurface, less than a few tens of metres of thickness, and these resistivity features correspond well to similar features obtained from ground ERI sounding data.
More importantly, the VTEM resistivity section clearly and accurately defines the top and base of the resistive incised gravel aquifer that lies above the shale bedrock and below the conductive till layer. As such it compares favourably with the ground ERI and seismic results.
The next example in Figure 10 is from central part of the Spiritwood Valley aquifer, approx. 1 km to the east from Killarney (Figure 1). In this example, two gravel channels are observed in the seismic results, a deeper one, labeled c, and a shallower channel, unit e (Oldenborger et al., 2011).
For the LCI, shown in Figure 10b, a 4-layer starting model was used. As shown, there is very good match between layer thicknesses and border depths obtained from VTEM and seismic data. In particular the interface between sand and gravel channel and the bedrock shale is very well defined in the incised valley (unit c). The c and e gravel channels also both coincide with prominent resistivity high anomalies in the LCI results.
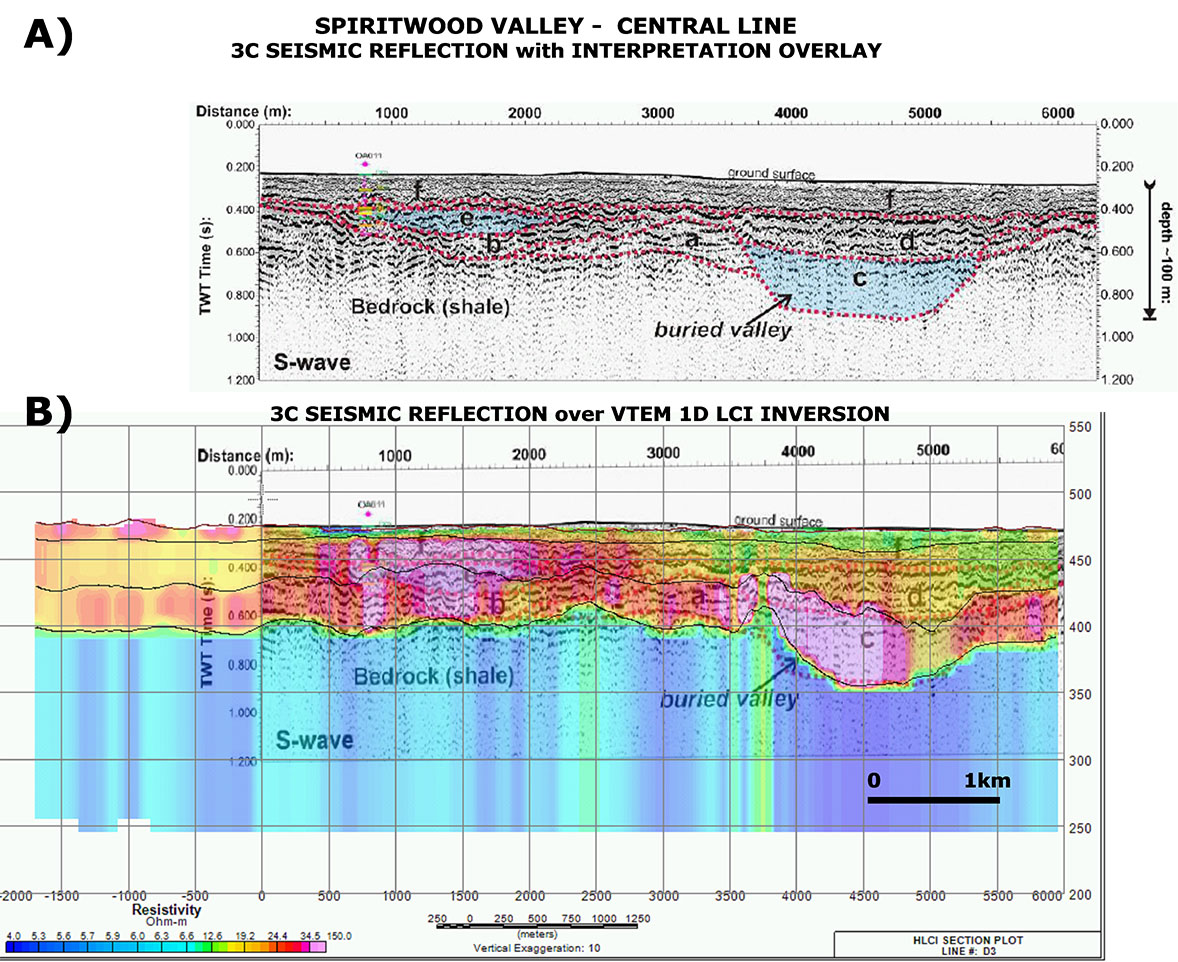
Figure 10: S-wave seismic section from the central part of the area. Units e and c are interpreted to be aquifer channels filled with sand and gravel (top section). The bottom section is combined VTEM LCI inversion with the seismic data. Initial model for the inversion consists of 3 layers plus basement (thin black lines are inverted borders; seismic section from Oldenborger et al., 2011).
The results from southern part of the Spiritwood Valley Aquifer are presented in Figure 11, with a detailed portion that covers the center of a longer seismic survey line (Figure 1). In this example, two resistive channel fills, also seen in the AEM data, are identified as units b and f that are infill channels cut into bedrock to >100m depths below surface.
Figures 11a and 11b presents the results of VTEM RDI resistivity-depth image and the more accurate LCI resistivity-depth inversion that both clearly define the locations of the buried resistive valley aquifers (b and f) which lie directly below the till units (g-e-a) and above the bedrock shale. The LCI in Figure 11b also appears to
accurately define their thicknesses and layer boundaries. These include the till-sand & gravel interface and the alluvial-bedrock interface which agree very well with the seismic results (Figure 11c). In addition, an intermediate channel (unit c), that had been defined in the seismic results but had remained undetected in previous AEM results, is also defined the VTEM LCI as a smaller, less resistive zone at depth. This channel had previously been interpreted to be filled with coarse-grained diamictons (conductive) and likely act as a hydraulic barrier between channels b and f. The VTEM results suggest, instead, that it is possibly a thinner sand and gravel deposit.
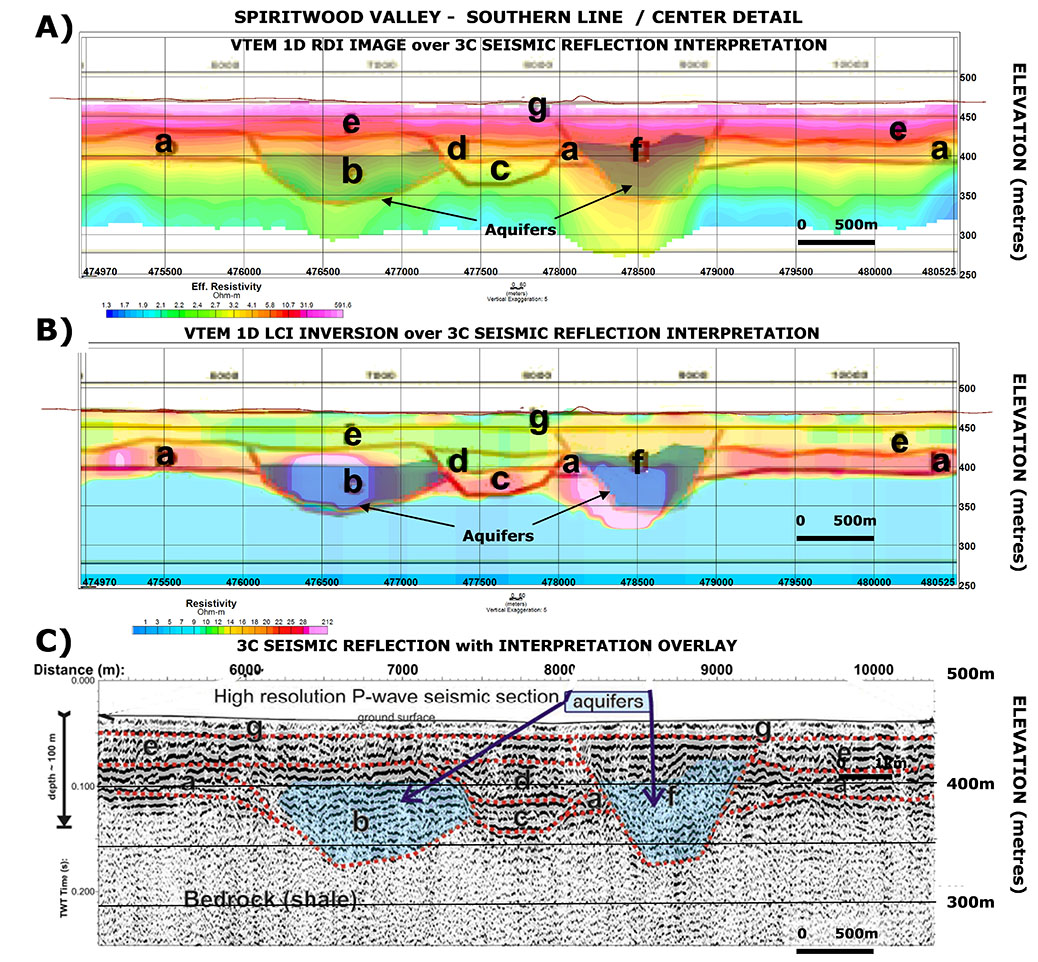
Figure 11: Detailed portion from center of southern line, showing: A) VTEM RDI section and B) LCI section with interpreted seismic borders and C) interpreted P-wave seismic section (seismic data and overlay from Oldenborger et al., 2011).
Conclusion
In an effort to improve the shallow imaging capability of the VTEM helicopter EM system, by obtaining the most accurate early-time data possible, a full waveform system has been developed and tested over the Spiritwood Valley aquifer. The full wave VTEM system combines the half-cycle recording of the transmitter and receiver waveforms, with post-processing that includes:
a) continuous system response calibration,
b) transmitter drift and parasitic noise correction
c) deconvolution to an ideal source waveform
This implementation results in an increased system bandwidth that reduces early-time distortion and thereby enables shallower depth resolution and mapping of higher resistivity features in the near-surface, both of which are of great importance in groundwater exploration.
Results of the full waveform VTEM survey over the Spiritwood Valley aquifer have shown a significant improvement in quantitative VTEM data at earlier times than previously achieved – as early as 18 μs after the current turn-off and as late as 9.977 ms (ch 4-47). These, in turn, have also led to improvements in the model space that include better definition of the surficial till layer and also more compact resistive anomalies associated with the buried valley aquifers that are in good agreement with previous seismic and resistivity results. The ultimate goal is the more accurate subsurface information at depth from airborne geophysics and better characterization of the electrical properties of the valley fill sediments.
Additional comparisons with follow-up drilling, borehole geophysics, and ground geophysics, particularly transient EM soundings and ground ERI sections, are still required for proper calibration of the AEM data. Nevertheless the improvements in accuracy of the survey results obtained are likely to be significant for future groundwater resource management purposes.
References
Annan, A. P., 1986, Development of the PROSPECT 1 airborne electromagnetic system, in Palacky, G. (ed), Airborne resistivity mapping: Geol Surv of Can. paper 86-22.
Auken, E., Sorensen, K.I., Thomsen, P., and Efferso, F.,2000, Optimized model resolution using low pass filters in TDEM soundings, Expanded abstract, 11TH SAGEEP symposium and annual meeting of Environment and Engineering Geophysical Society, EEGS, Arlington, VA, 8 pp.
Bedrosian, P.A., Minsley, B., Auken, E., Christiansen, A.V., and Abraham, J., 2011, An intercomparison of airborne electromagnetic systems for hydrogeologic studies, a poster presented at 24TH SAGEEP symposium and annual meeting of Environment and Engineering Geophysical Society, EEGS, Charleston, SC.
Lane, R., Green, A., Golding, C., Owers, M., Pik, P., Plunkett, C., Sattel, D., and Thorn, B., 2000, An example of 3D conductivity mapping using the TEMPEST airborne electromagnetic system, Exploration Geophysics 31, 162-172
Legault, J.M., Berardelli, P., Abraham, J., Cannia, J., and Martinez, K., 2010, Groundwater evaluation using VTEM helicopter electromagnetics in the South Platte NRD, Sidney, Nebraska, Expanded abstract, 23RD SAGEEP symposium and annual meeting of Environmental and Engineering Geophysical Society, EEGS, Keystone, CO, 11 pp.
Legault, J.M., Prikhodko, A., Kumar, H., and Tishin, P., 2011, An improved early-channel VTEM helicopter system for near-surface applications, a paper presented at 24TH SAGEEP symposium and annual meeting of Environment and Engineering Geophysical Society, EEGS, Charleston, SC.
Macnae, J., and Baron-Hay, S., 2010, Reprocessing strategy to obtain quantitative early-time data from historic VTEM surveys, Expanded abstract, 21ST International Geophysical Conference & Exhibition, ASEG, 5 pp.
Macnae, J., and Davis, A., 2010, An AEM system calibration, Expanded abstract, 21ST International Geophysical Conference & Exhibition, ASEG, 5 pp.
Macnae, J., 2008, Broadband AEM systems, Expanded abstract, AEM2008: 5TH International Conference on Airborne Electromagnetics, Haikko, Finland, 10 p.
Martinez, K., Lo, B., Ploug, C., Pitcher, D. and Tishin, P., 2008, Water resources applications with the VTEM system, Expanded abstract, AEM2008: 5TH International Conference on Airborne Electromagnetics, Haikko, Finland, 6 p.
Oldenborger, G.A., Pugin, A.J.-M., Hinton, M.J., Pullan, S.E., Russell, H.A.J., and Sharpe, D.R., 2010, Airborne time-domain electromagnetic data for mapping and characterization of the Spiritwood Valley aquifer, Manitoba, Canada, Geological Survey of Canada, Current Research 2010-11, 13p.
Oldenborger, G.A., Pugin, A. J.-M., and Pullan, S.E., 2011, Buried valley imaging using 3-C seismic reflection, electrical resistivity and AEM surveys, Expanded abstract, GeoHydro 2011: Joint meeting of the Canadian Quaternary Association and the Canadian Chapter of the International Association of Hydrogeologists, Quebec City, Canada, 6p.
Oldenborger, G.A, 2010a. AeroTEM III Survey, Spiritwood Valley, Manitoba, parts of NTS 62G/3, 62G/4, Manitoba. Open file (Geological Survey of Canada); 6663. Scale 1:50 000, 4 maps.
Oldenborger, G.A, 2010b. AeroTEM III Survey, Spiritwood Valley, Manitoba, parts of NTS 62G/3, 62G/4, 62G/5, 62G/6, Manitoba. Open file (Geological Survey of Canada); 6664. Scale 1:50 000, 4 maps.
Van den berg, H., 2009, Some applications of VTEM for environmental studies, Expanded abstract, 11TH SAGA biennial technical meeting and exhibition, South African Geophysical Association, Swaziland, 120-130.
Witherly, K., and Irvine, R, 2006, The VTEM airborne electromagnetic system – benchmarking continuous improvement via repeat surveys over time, SEG Expanded Abstracts, 25, 1273-1277.
Witherly, K., Irvine, R., and Morrison, E.B., 2004, The Geotech VTEM time domain helicopter EM system, SEG Expanded Abstracts, 23, 1217-1221.
