Presented at SAGEEP 2010
For a PDF of this paper click here
Abstract
A VTEM™ time domain helicopter-borne electromagnetic survey was undertaken for groundwater evaluation in western Nebraska with the objective to map the extent of deep freshwater aquifers. The VTEM system combines near surface high resolution resistivity imaging and deep penetration making it a low cost, rapid reconnaissance mapping tool in areas with thick, conductive terrain. The survey was preceded by a synthetic computer modeling study that proved its resolution and penetration capability below 200m depth. The test survey that followed used a new X-Z component system and caesium mag-netometer that covered a 165 square km region of the South Platte NRD in two short survey days. Data analysis using a variety of 1D (layered-earth) inversion and conductivity-depth imaging (CDI) tools in-dicate that, in spite of significant presence of man-made culture (powerlines and metallic structures), the moderately conductive Ogallala Group aquifer was successfully mapped to a known depth of 160m above the conductive White River Group Brule Formation bedrock aquitard. Simulated penetration depths in excess of 200m appear to have been easily reached, suggesting the use of VTEM to be extend-ed into deeper, more conductive aquifers within the Natural Resource Districts of Nebraska.
Introduction
Groundwater in the Lodgepole Creek area around Sidney, western Nebraska is sometimes insuf-ficient and alternate water sources are limited in extent. The U.S. Geological Survey (USGS) and the South Platte Natural Resources District (NRD) recently began a cooperative study to evaluate the ground water near Sidney (Steele et al., 2007). One of the initiatives was to fly the region using helicop-ter electromagnetic (HEM) surveys to determine the extent of sand and gravel aquifers in the area. Fre-quency domain EM systems have been used successfully in the region but lack the penetration necessary to map the base of the deeper and more conductive aquifers in the region (Smith et al, 2009).
In March, 2009, the USGS contacted Geotech Ltd. (Aurora, Ontario, Canada) to undertake 1D layered-earth forward modeling as a proof of concept in the use of its VTEM (versatile time-domain electromagnetic) helicopter system for mapping the base of deep aquifers in Nebraska. A VTEM test survey soon followed in April, 2009 over a survey block located near the town of Sidney in Cheyenne County in the South Platte NRD of Nebraska (Figure 1). The survey objectives were to map the base of the Tertiary Ogallala Group aquifers that extends from near surface to below 130m (400ft) depth above the Tertiary White River Group Brule Formation bedrock. Subsequent 1D layered earth inversion and conductivity depth imaging were performed to map the extent of the Ogallala aquifer, with the final re-port (Bournas et al., 2009) submitted in early June, 2009. This paper presents a case history detailing the forward model simulation, the eventual EM survey and the results of the inversion modeling study.
Survey Location and Description
The center of the Sidney Block (41° 21.745’N, 103° 1.143’W) is located approximately 25 kilometres north of the town of Sidney, Nebraska. The 40.4 km long NS survey block extends from Cheyenne County into southern Morrill County (Figure 1).
Topographically, the Sidney Block exhibits moderate relief; with an elevation ranging from 1151 to 1328 metres above sea level over an area of 165 square kilometres (see Figure 1). The survey area consists primarily of irrigated farmlands with many small drainages running throughout that covers a network of rural roads (generally on every side of each square mile), highways and railway lines. Other more notable cultural features running through the survey block include two major northwest-southeast electrical transmission lines and NW-SE pipeline that cross-cut the survey block (see Figure 7).
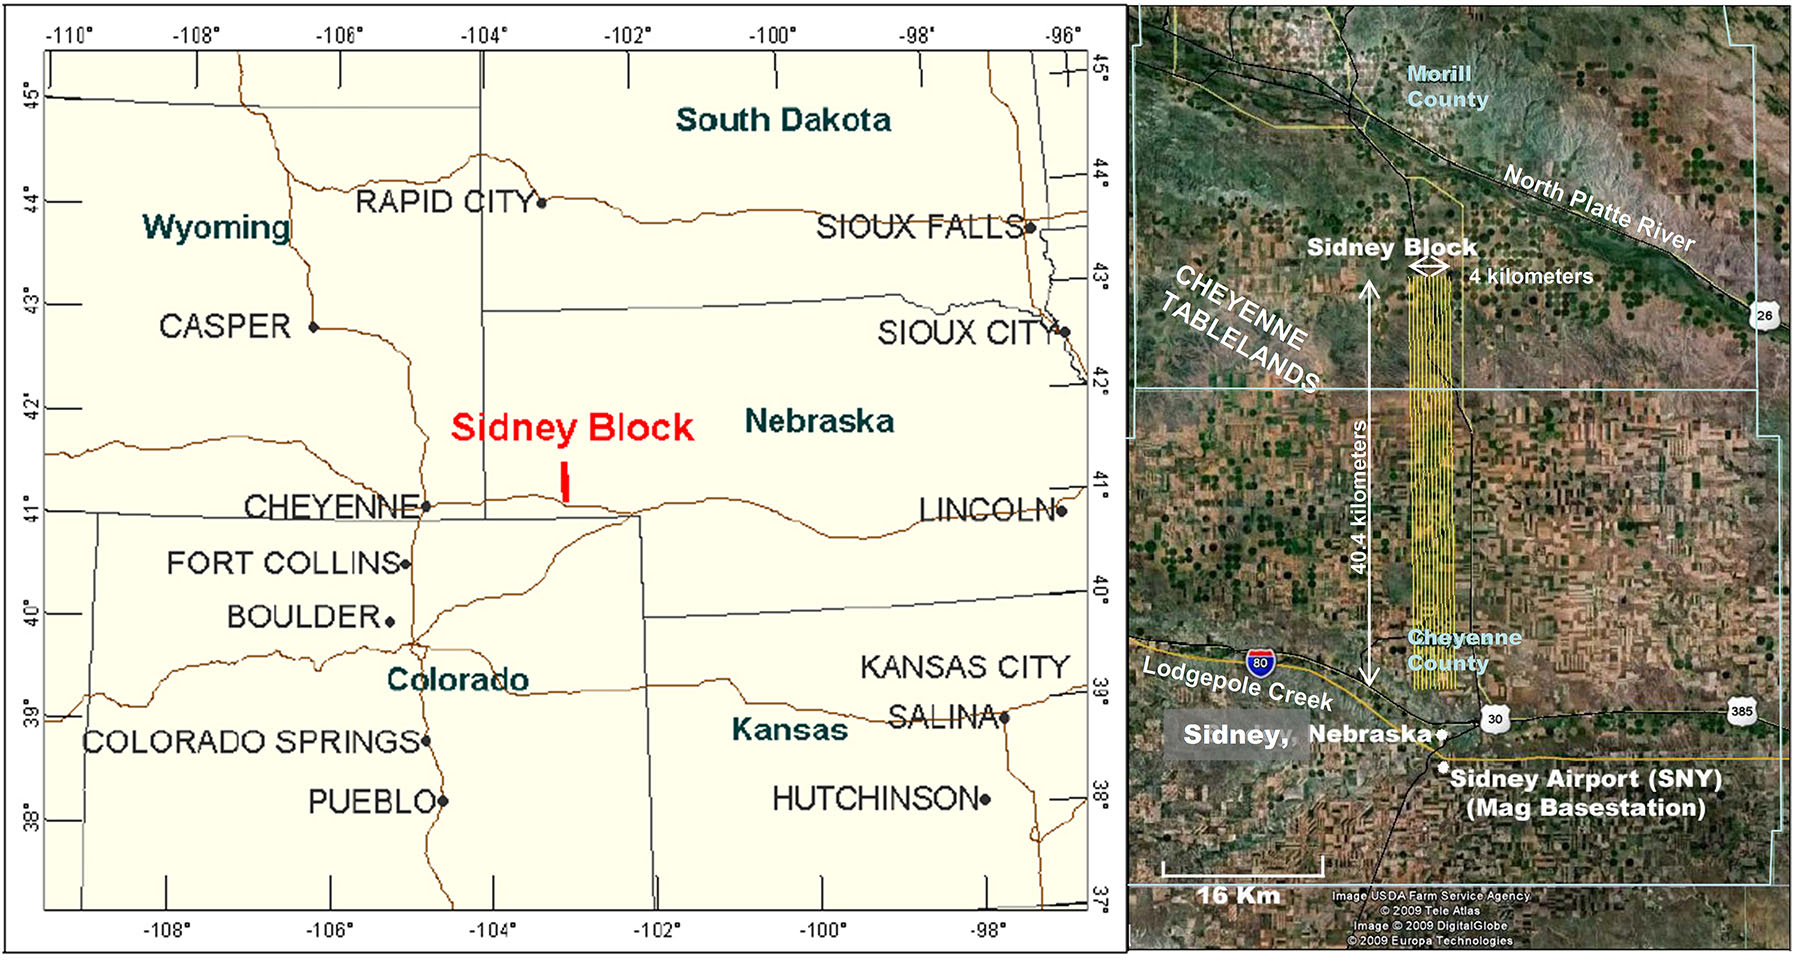
Figure 1: Sidney Block general property location in southwest Nebraska (left) and VTEM survey flight line planning for region north of Sidney, NE, showing agricultural land use, in Google Earth (right).
Geology and Geophysical Properties
The geologic stratigraphy of the Sidney survey area consists of Quaternary alluvium overlying the Tertiary Ogallala Group which contains a mixture sand, gravel and sandstone aquifers and Tertiary White River Group bedrock (Figure 2). The Holocene and Pleistocene age Quaternary alluvium is mainly found in the Lodgepole valley and consists of unconsolidated silt, sand and gravel boulders, up to 10 metres in thickness, with a resistivity of 30 to 70 ohm-metres. The Tertiary (Miocene) Ogallala Group is mainly composed of interbedded layers of clay, silt, fine to coarse-grained sand, gravel, conglomerate, calcareous sandstone and volcanic ash, with a thickness up to 120 metres, and resistivity of 50 to 100 ohm-metres. The bedrock layer (Tertiary, Lower Oligocene) consists of White River Group, Brule For-mation brown siltstone and mudstone, which are rich in volcanic glass shards. The thickness of this layer is over 180m with a resistivity of 8 to 18 ohm-m (Steele et al., 2007; Cannia et al., 2006).
Hydrogeology
Lodgepole Creek is the predominant watercourse in the South Platte NRD and it is intensively used for irrigation with wells open to aquifers in the fractured Brule Formation and the overlying alluvial aquifer (Figure 2a). In contrast, irrigation wells in the Cheyenne tablelands that lie in the VTEM survey area are developed in the Ogallala Group and to a lesser extent in deep wells into sand and gravel channel deposits (Brule Sands) in the Brule Formation (Figure 2b). The Brule Formation, composed mainly of siltstones, otherwise does not yield substantial quantities of water unless fractured. The Ogallala, because it contains individual beds of unconsolidated sand and gravel up to 20 metres or more, is an important aquifer north of Lodgepole Creek in the tablelands. The water table of the tablelands generally trends northeast towards the North Platte River. In the project area the water table can be up to 60m (200ft) deep. Specific conductance of the water is generally not a factor in the electrical signature. A median conductivity of 405 μ S/cm has been reported for water from the Ogallala Group. Quaternary alluvium deposits are relatively thin and are not regarded as a source of water (Steele et al., 2007).
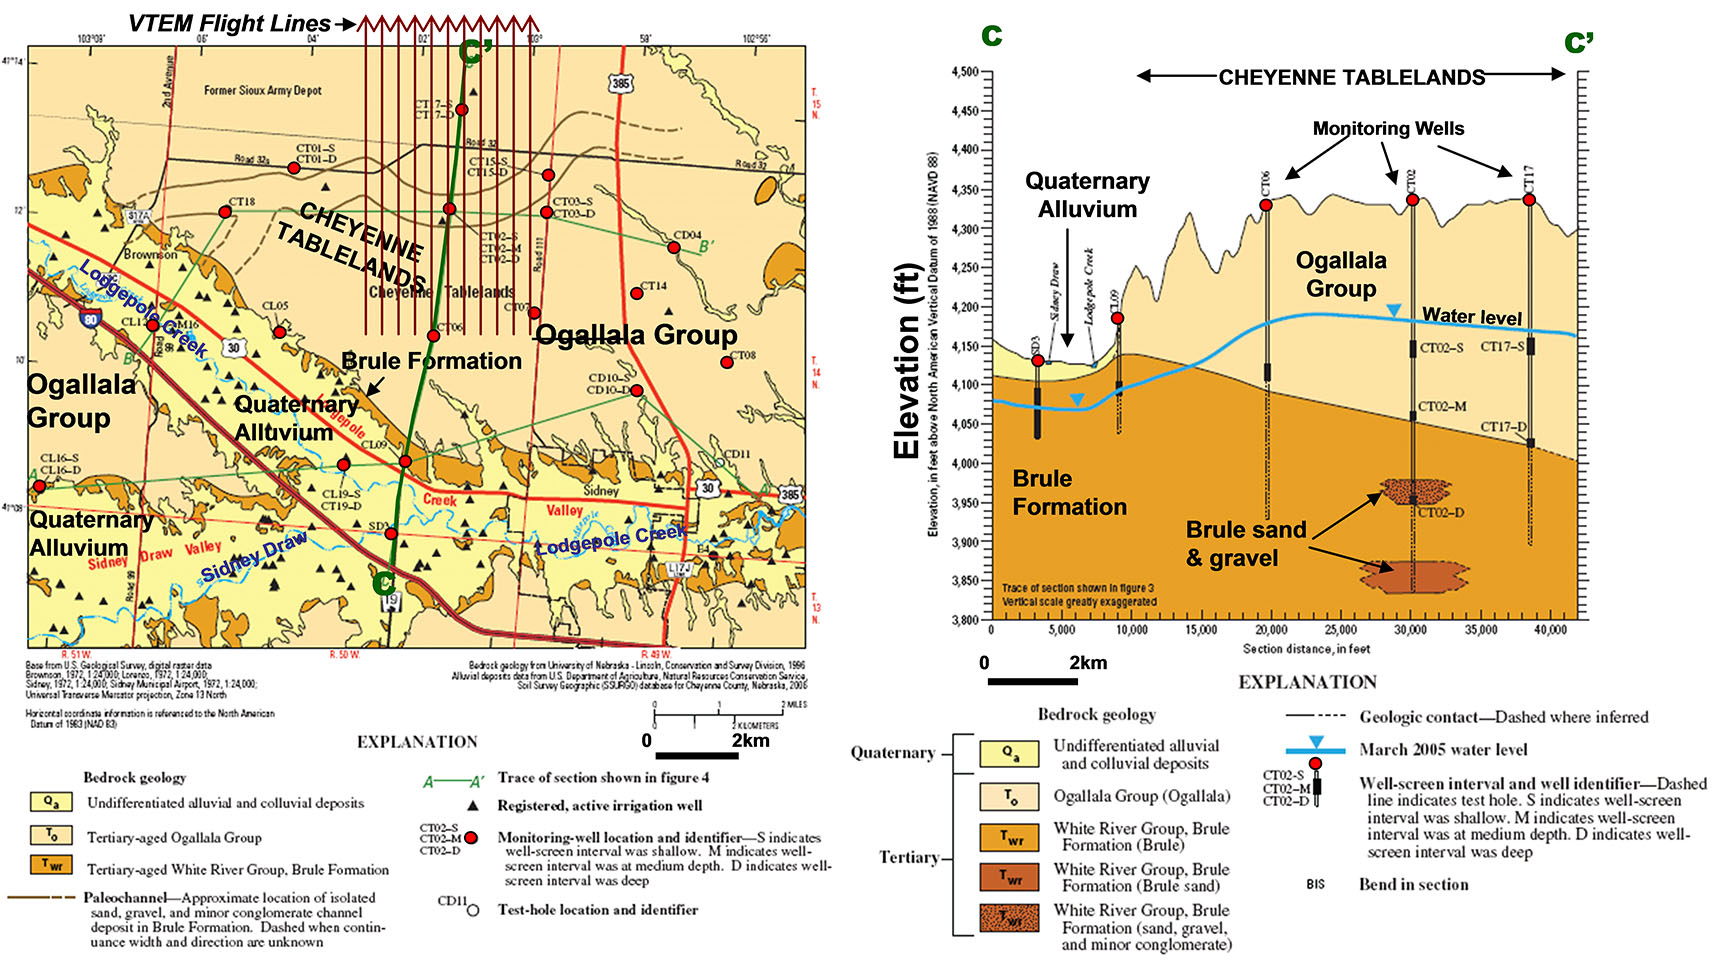
Figure 2: (Left) Generalized bedrock geology plan in Sidney region showing monitoring wells and ap-proximate locations of VTEM survey lines; (Right) Geologic cross-section in southern VTEM survey area (both modified after Steele et al., 2007).
VTEM System
The VTEM system (Witherly et al., 2004) has a 26 metre diameter, vertical axis, 4 turn transmit-ter coil and can produce over 500,000 NIA of dipole-moment, giving it its deep penetration capability. The VTEM system configuration consists of a 2-axis (Z-vertical & X-horizontal) induction type (dB/dt) EM receiver coils deployed in the middle of the transmitter coil and optically pumped caesium magne-tometer suspended above it (Figure 3). The horizontal in-loop transmitter-receiver geometry (coincident-coplanar) produces a symmetric response is well suited for sounding applications. During the Sidney Block survey the helicopter was maintained at a mean height of 76 metres above the ground with a nom-inal survey speed of 80 km/hour. This allowed for a nominal EM sensor terrain clearance of 41 metres and a magnetic sensor clearance of 63 metres.
The VTEM transmitter is digitally controlled and can easily operate in a variety of base frequen-cies, using different pulse widths and shapes. The pulse shape is trapezoidal and elongated to approxi-mate a step response that is optimal for layered-earth response modeling. At Sidney Block, a 7.2 milli-second pulse width (43% duty cycle) was utilized. The digital acquisition system at the receiver utilizes 24 bit A/D sampling at 2500Hz. The data recording rates at output are 0.1 second for electromagnetics, magnetometer and 0.2 second for altimeter and GPS. This translates to a geophysical reading about eve-ry 2 metres along flight track. Navigation is assisted by a CDGPS receiver and data acquisition system, which reports GPS co-ordinates as latitude/longitude and directs the pilot over a pre-programmed survey grid. The EM dB/dt and calculated B-field decays are derived using twenty-four (24) time measurement gates centered 120 to 6578 μ sec after the end of the pulse (Figure 3).
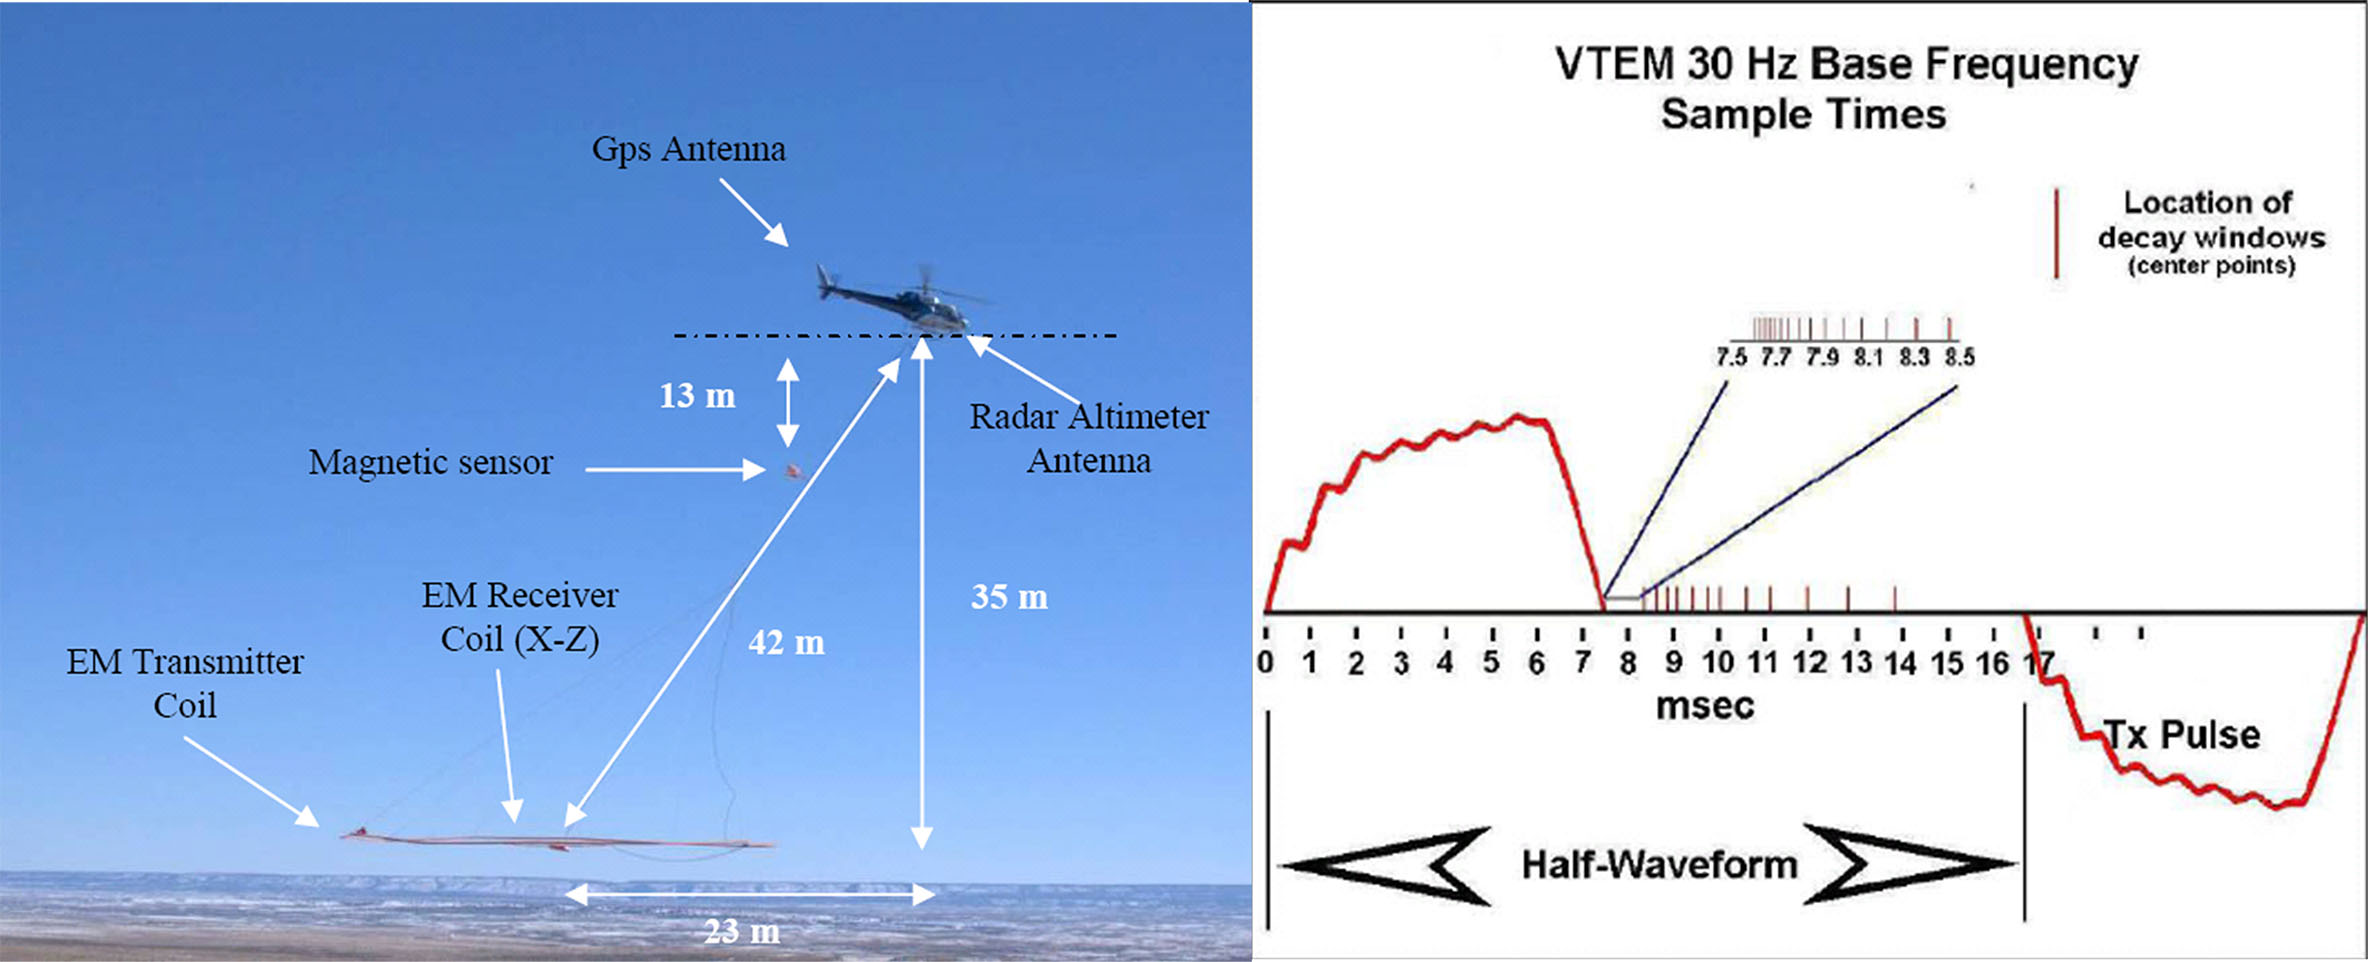
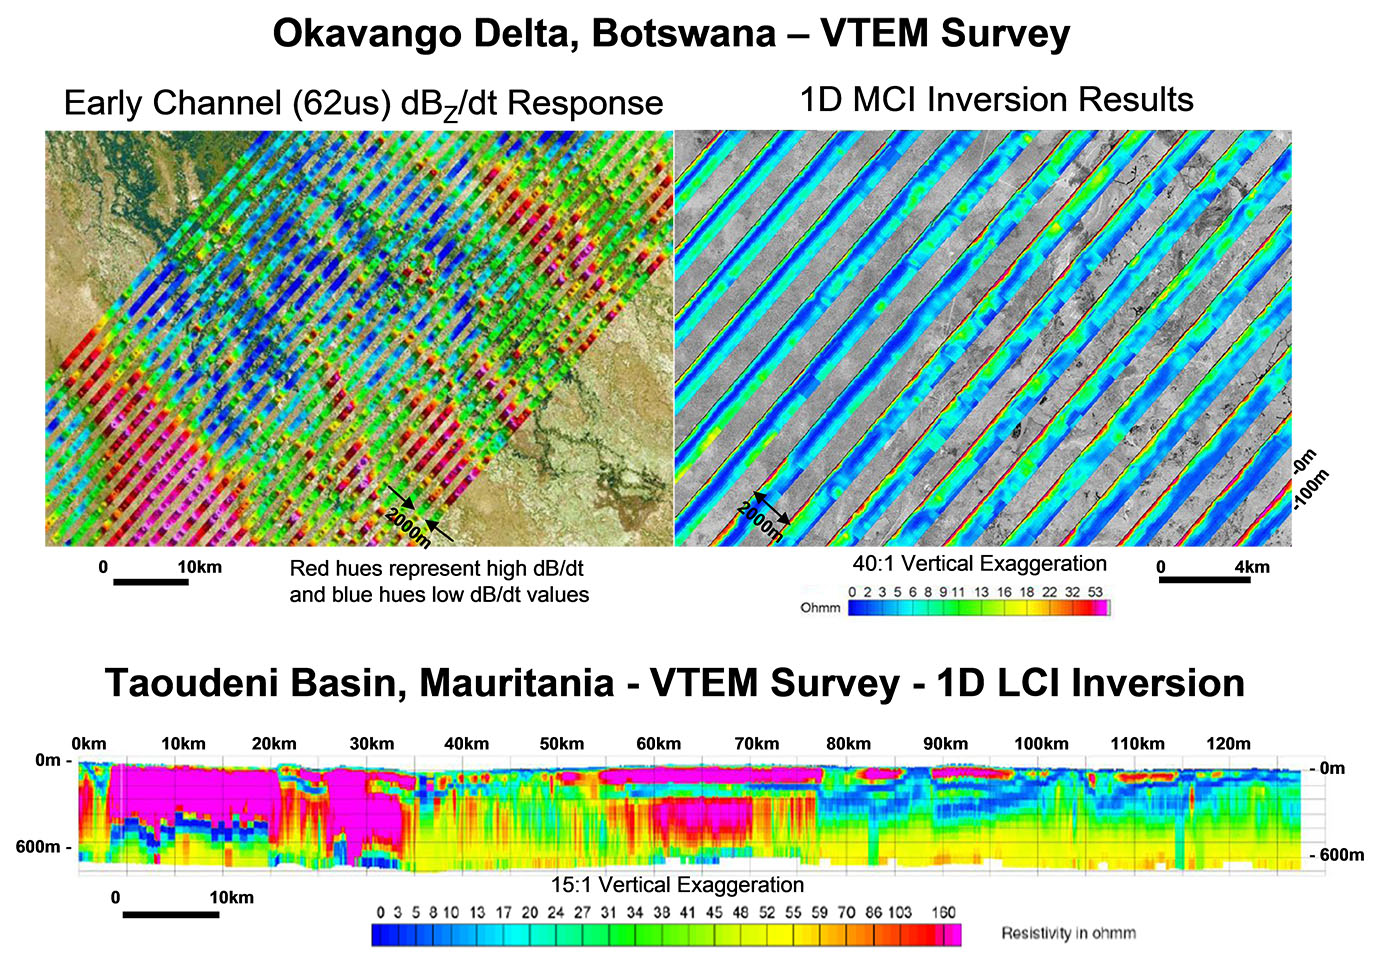
Figure 4: VTEM ground water examples from: a) Okavango Delta, Botswana, showing VTEM dBz/dt EM decay strength as grid contours (top left) and Stacked mutually-constrained (MCI) 1d inversions as stacked 2D resistivity sections in plan (top right); b) 1D laterally-constrained inversions (LCI) from Taoudeni Basin, Mauritania (bottom) as a 2D resistivity section (modified after Martinez, et al. (2008).
The VTEM system has been designed for mineral exploration with a wide conductivity aperture optimized to detect and resolve poor to good sulphide conductors, ranging from zinc-rich(0.1 S/m) to nickel sulphides (>1000 S/m). The low base frequency, long pulse width, and the derived B-field are techniques used to better detect and resolve high conductivity targets.
The interest for water resources airborne electromagnetic surveys include high-resolution mapping of resistivities both at the near-surface as well as at great depth. Near-surface imaging requires an early time acquisition capability not normally needed in mineral surveys but obtainable with VTEM. Depth penetration is required to give water resource managers a new look into more complex deep-lying hydrogeology targets of interest. With a proven depth-detection capability for conductive bodies below 300-600m (Witherly and Irvine, 2006), the VTEM system is ideally suited for deep conductive aquifer mapping. Examples of successful applications of VTEM for water resource objectives include the Oka-vango Delta region of Botswana and in the Taoudeni Basin of Mauritania (Figure 4), both complex and conductive brackish-freshwater environments (Martinez et al., 2008).
1D Forward Modeling
As a proof of concept, the applicability of VTEM system to map the Sidney Block hydrogeology was evaluated using synthetic Layered Earth model testing. VTEM responses (Z component of dB/dt) were calculated synthetically for a variety of layered-earth models chosen by USGS and were then in-verse-modeled to derive the expected responses. The proposed models for the study consisted of 2 and 3 layers with resistivities and thicknesses that were appropriate for Sidney groundwater resource objec-tives. Particular emphasis was to resolve the base of the Ogallala aquifer to 200 metres (Figure 5).
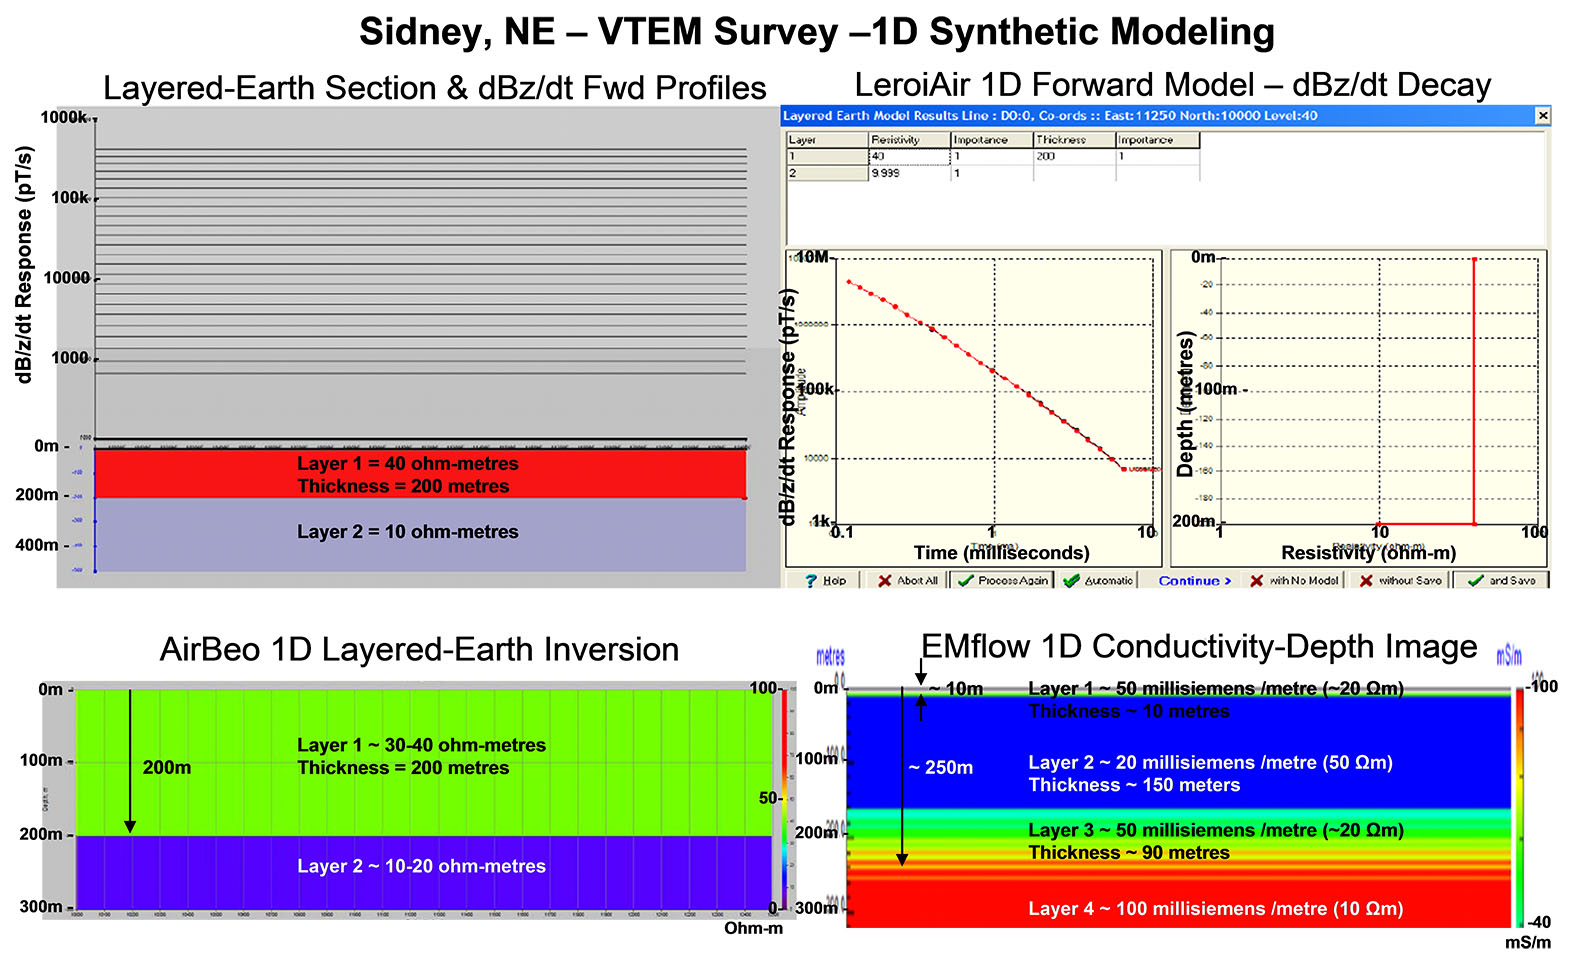
Figure 5: 1D Layered-earth model simulation of VTEM for Sidney hydrogeological model: a) Synthetic 1D forward model VTEM data calculated using LeroiAir for 200m thick Ogallala aquifer above Brule basement (above); b) Predicted 1D layered-earth model for forward model VTEM data using Airbeo 1D LE inversion (bottom-left) and EMflow CDI conductivity-depth image (bottom-right).
The forward modeling was carried out with Leroi Air algorithm (CSIRO, North Ryde, NSW, Australia) that is integrated into the Maxwell software platform (EMIT Technology Pty, Midland, WA, Australia). 1D Inversions of the synthetic forward model data were performed for the VTEM system configuration and waveform using two different tools: 1) Conductivity depth imaging (CDI) using the EMflow software (Pitney-Bowes/Encom Technology Pty., Sidney, NSW, Australia) and 2) 1D discrete-layer inversion using Airbeo (CSIRO). Modeling and inversion results of one of the proposed synthetic models, a thick Ogallala Group 30 ohm-metre aquifer extended to 200m below surface above the con-ductive (10 ohm-m) Brule Formation basement, is illustrated in Figures 5. The results indicate that the VTEM system would be successful in detecting and resolving aquifer thicknesses below 200m depths.
The study showed that the theoretical VTEM decay responses for all models proposed were above the noise levels (~500 pT/s). 1D inversion results obtained with Airbeo were able to satisfactorily replicate/reproduce the initial forward model parameters. Similarly, conductivity-depth images obtained using EMflow showed a good agreement with the initial models, but generally demonstrated poor re-solving power, in comparison with 1D inversion, particularly in the case of weaker resistivity contrast between adjacent layers. Inversion artifacts, such as apparent thin near-surface conductive layers and transitional resistivity layering above the basement units, were also observed (see Figure 5b)
VTEM Survey Results
Following the successful synthetic modeling study, a VTEM test survey was commissioned in April, 2009, over a 4 x 40km block in the Cheyenne tablelands north of Sidney, Nebraska (Figures 1 and 2). The survey extends from the South Platte NRD of Cheyenne County into the North Platte NRD of Morill County where Ogallala Group thicknesses were expected to exceed 160m depths, based on well-hole data (Figure 6). The Sidney Block was flown in a north to south (N 358° E) direction along eleven (11) 40.4 kilometre length survey lines, totaling 444km (165km2) at a line spacing of 400 metres.
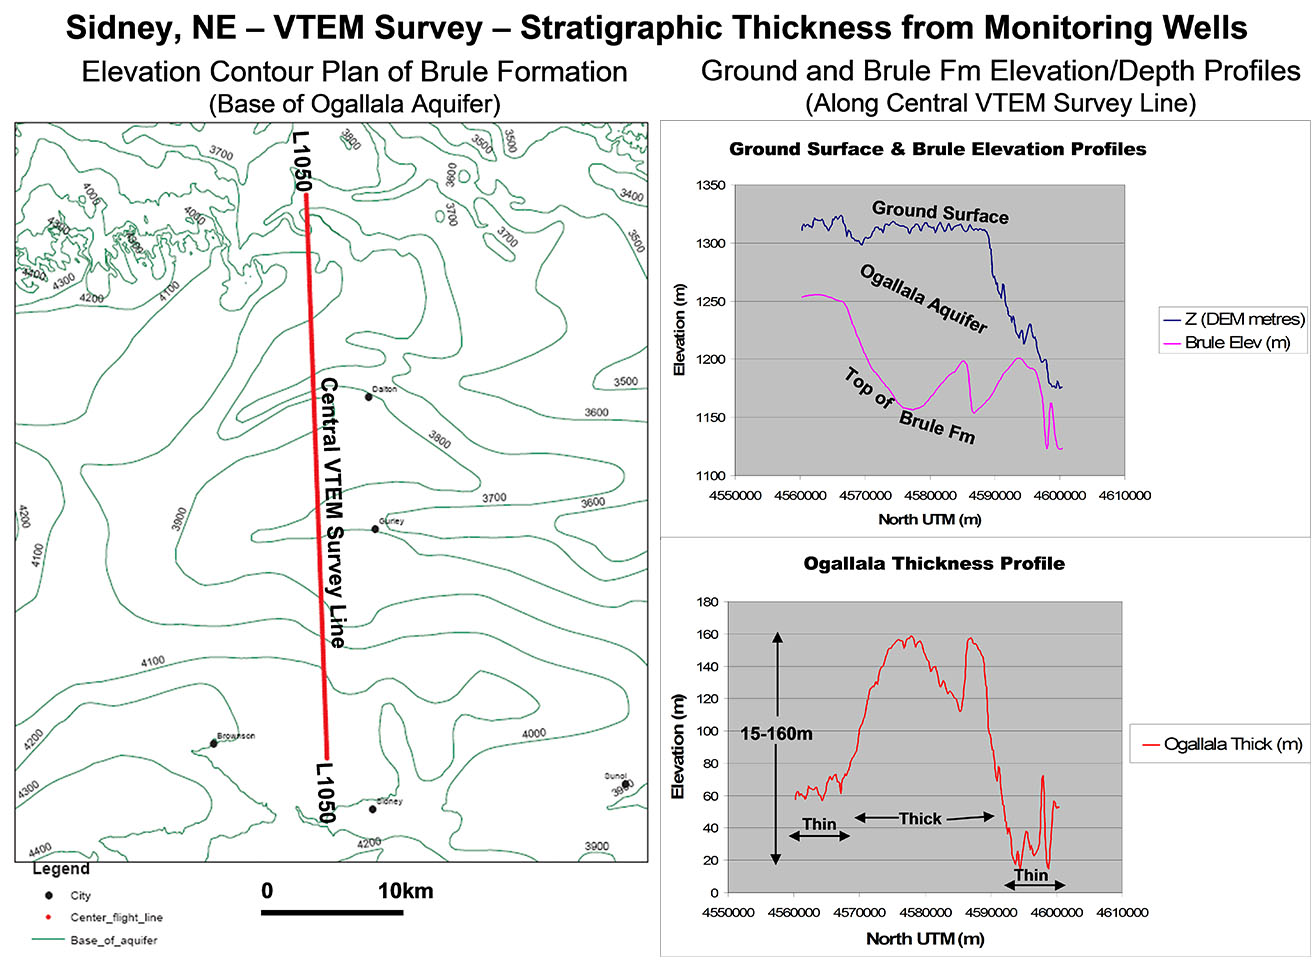
Figure 6: Stratigraphic elevations & thickness from wells along central VTEM line (Cannia et al, 2006).
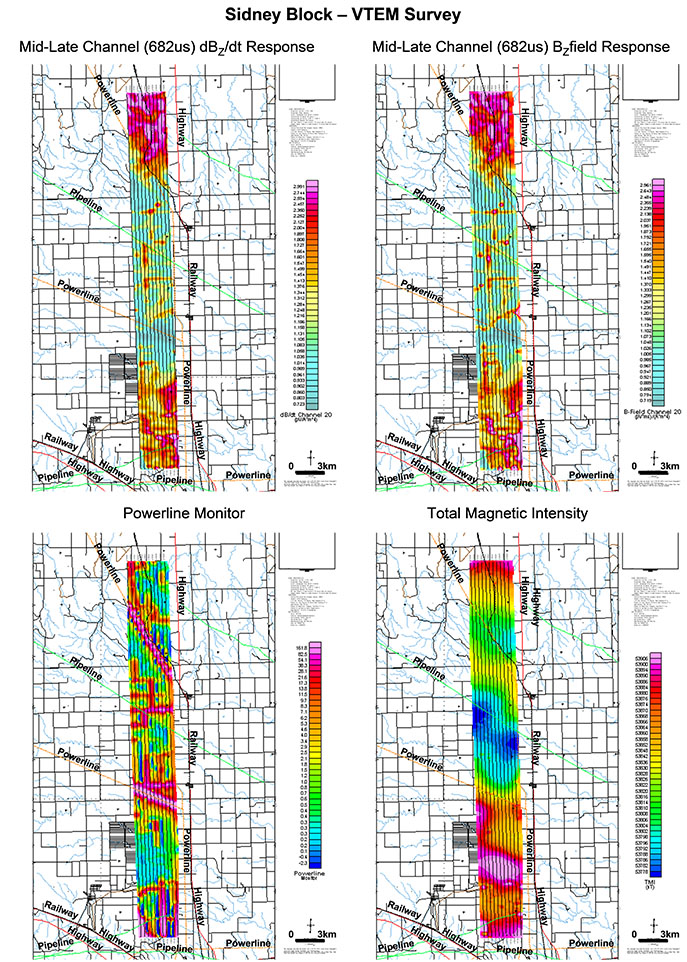
Figure 7: VTEM survey results shown in plan for Sidney Block: a) Middle to late channel (ch20 = 682 μ sec delay) vertical component (dBz/dt) EM signal strength (above left), showing conductive response highs in red, resistive low responses in blue; b) Identical channel/gate EM signal for vertical calculated B-field (Bz) response (above right); c) Powerline monitor (below left) signal strength, showing cultural noise sources in red; d) Total magnetic intensity (below right), showing magnetic susceptibility highs in red and magnetic lows in blue.
The VTEM survey results over Sidney Block are presented as plan view contours in Figure 7. The dB/dt EM response and calculated B-field are shown for a mid-late time decay channel (ch20 = 682 μ seconds) in the upper panel, and powerline monitor and total magnetic intensity (TMI) in the lower panel. The overall response pattern indicates more conductive bedrock to the north and south; which is consistent with the known depth-to-top of the more conductive Brule Formation basement rocks, as il-lustrated in Figure 6. The more resistive rocks in the central survey area correspond to regions of thicker, more resistive Ogallala Group aquifer in the central Cheyenne tablelands. Numerous thin conductive lineaments that overprint the VTEM response are evidence of pervasive man-made metallic and power-line cultural features that cross-cut the area, some of which are confirmed by their similarity to the pow-erline monitor, while others are non-60Hz (Figure 8) and likely correspond to grounded fences or buried metallic infrastructure. In spite of the abundance of man-made culture, the VTEM results are character-ized by their high data quality that is required for accurate 1D layered earth imaging and inversion to great depth.
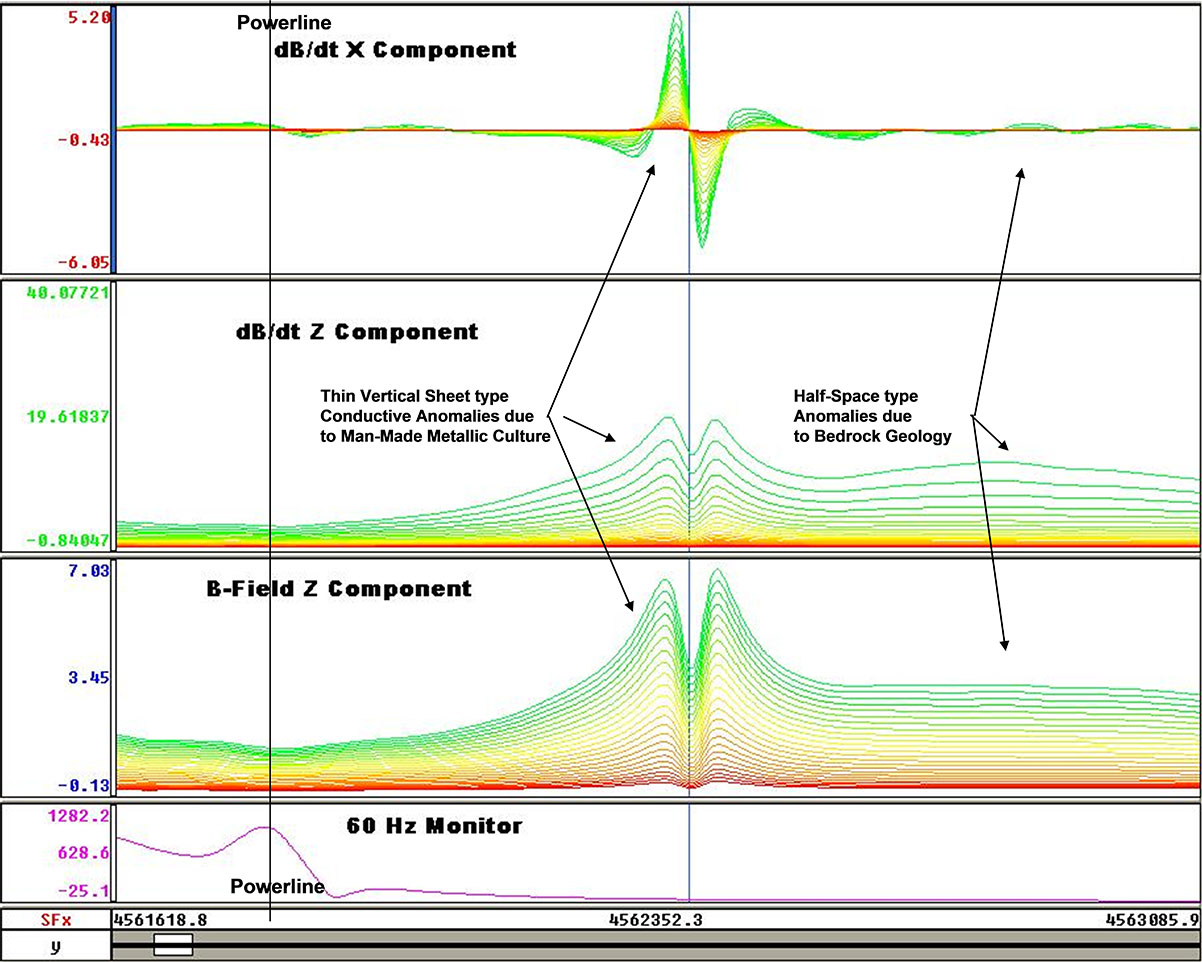
Figure 8: VTEM profile data from Sidney block showing powerline effect with minimal noise, man-made metallic culture (highly conductive, thin vertical plate type responses) and bedrock (weakly conductive, wide-prism/half-space type) signatures.
1D Inversion Modeling
Conductivity depth imaging (CDI) and 1D layered-earth (LE) EM Inversions were performed on all lines at the Sidney Block (11 lines) using the EMflow and Airbeo platforms, identical to those used in the earlier synthetic forward modeling study. The VTEM electromagnetic data were also inverse-modeled for comparison purposes using the pseudo 2D laterally-constrained inversion (2D LCI) based on Auken and Christensen (2004) and employed by COWI A/S (Lyngby, Denmark) that was previously used in the Okavango Delta and Taoudeni Basin VTEM groundwater studies, described in Martinez et al. (2006).
A comparison of the various inversion and imaging results is presented in Figure 9, for L1050, the central profile in the Sidney Block VTEM survey. A 3 layer model was used to fit the data in the Airbeo 1D LE inversion model (Figure 9-top) which matches the thin conductive Quaternary alluvium at the top, the more resistive Ogallala sediment aquifer in the middle and conductive Brule Tertiary bed-rock at bottom. The Airbeo resistivity cross-section displays significant variability that appears to coin-cide with cultural distortion of the VTEM data, based on the powerline monitor. For points away from obvious culture, the depth to basement estimates range from approximately 60 to 160 metres, which is close to the 15-160m range indicated in the well data (Figure 6). The Brule basement resistivity ranges between 8-20 ohm-metres. Airbeo 1D LE inversion depth-to-basement and basement resistivity results for all lines have been combined as plan view grid contours in Figure 10.
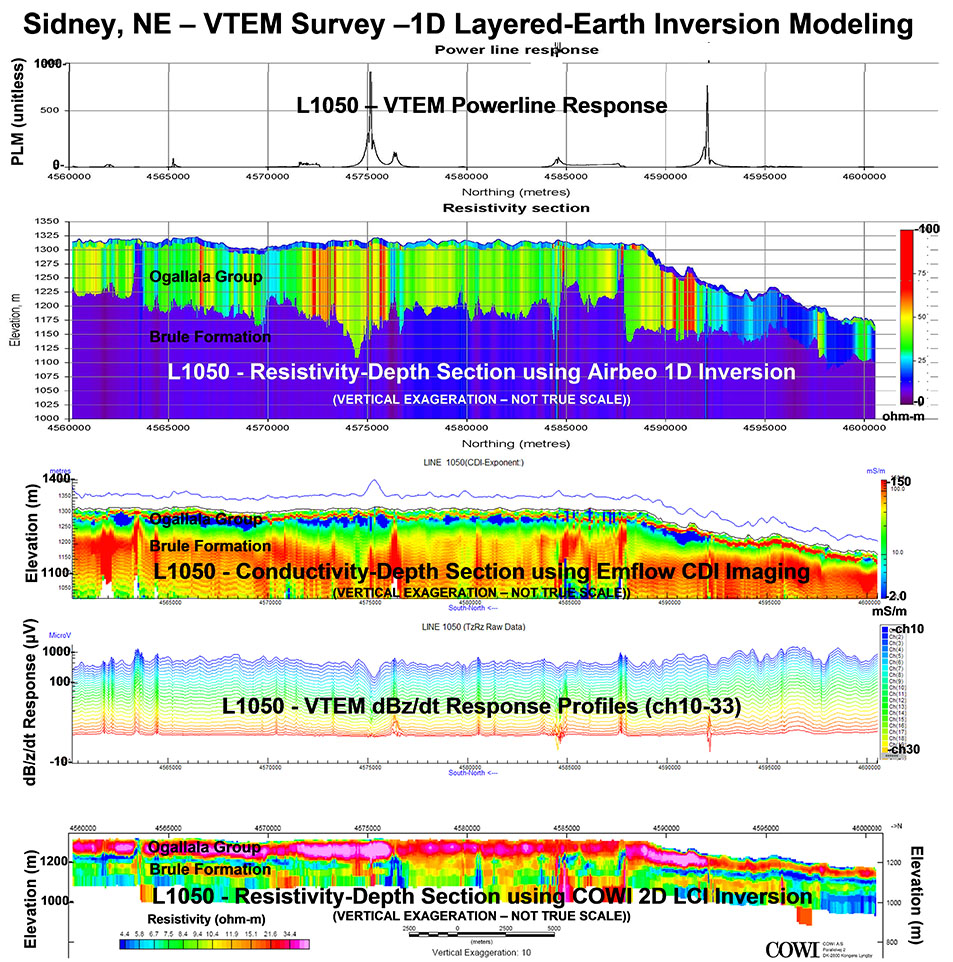
Figure 9: 1D Layered earth inversion modeling results for VTEM central line (L1050) in Sidney Block: a) Powerline monitor profile (top), showing peak responses that coincide with anomalous VTEM data and disrupted 1D layered-earth behaviour; b) Resistivity-depth section from Airbeo 1D LE inversion (2ND from top), showing discrete 3-layer model results; c) Conductivity-depth from EMflow CDI imaging (middle), showing smooth-model (multi-layer) representation; d) VTEM dBz/dt profiles (2ND from bottom) showing alternating peak responses that correspond to metallic and powerline culture, and later-ally smooth responses over bedrock geology; e) Resistivity-depth section from COWI 2D LCI inversion (bottom) showing laterally continuous model (19-layer), with sharper layer boundaries than CDI.
The EMflow CDI section for L1050 (Figure 9-middle) is surprisingly similar to that obtained from the Airbeo 1D LE inversion; However the CDI voltage transformation lacks the accuracy, appearing to underestimate the depth-to-basement, and also containing spurious near-surface layering that suggest inversion artifacts. The pseudo 2D LCI smooth inversion (Figure 9-bottom) used a 19 layer model as a simplified starting model not based on any geological or hydrological parameters. The 2D LCI displays more lateral continuity along section than the 1D LE results and sharper layer boundaries relative to the CDI. Similar LCI results along adjacent lines indicate data continuity. The L1050 2D LCI shows a distinct boundary between a higher and lower resistivity layer at 50-125 m depth along the line, which is slightly underestimated relative to the Airbeo 1D LE results and known geology based on well data.
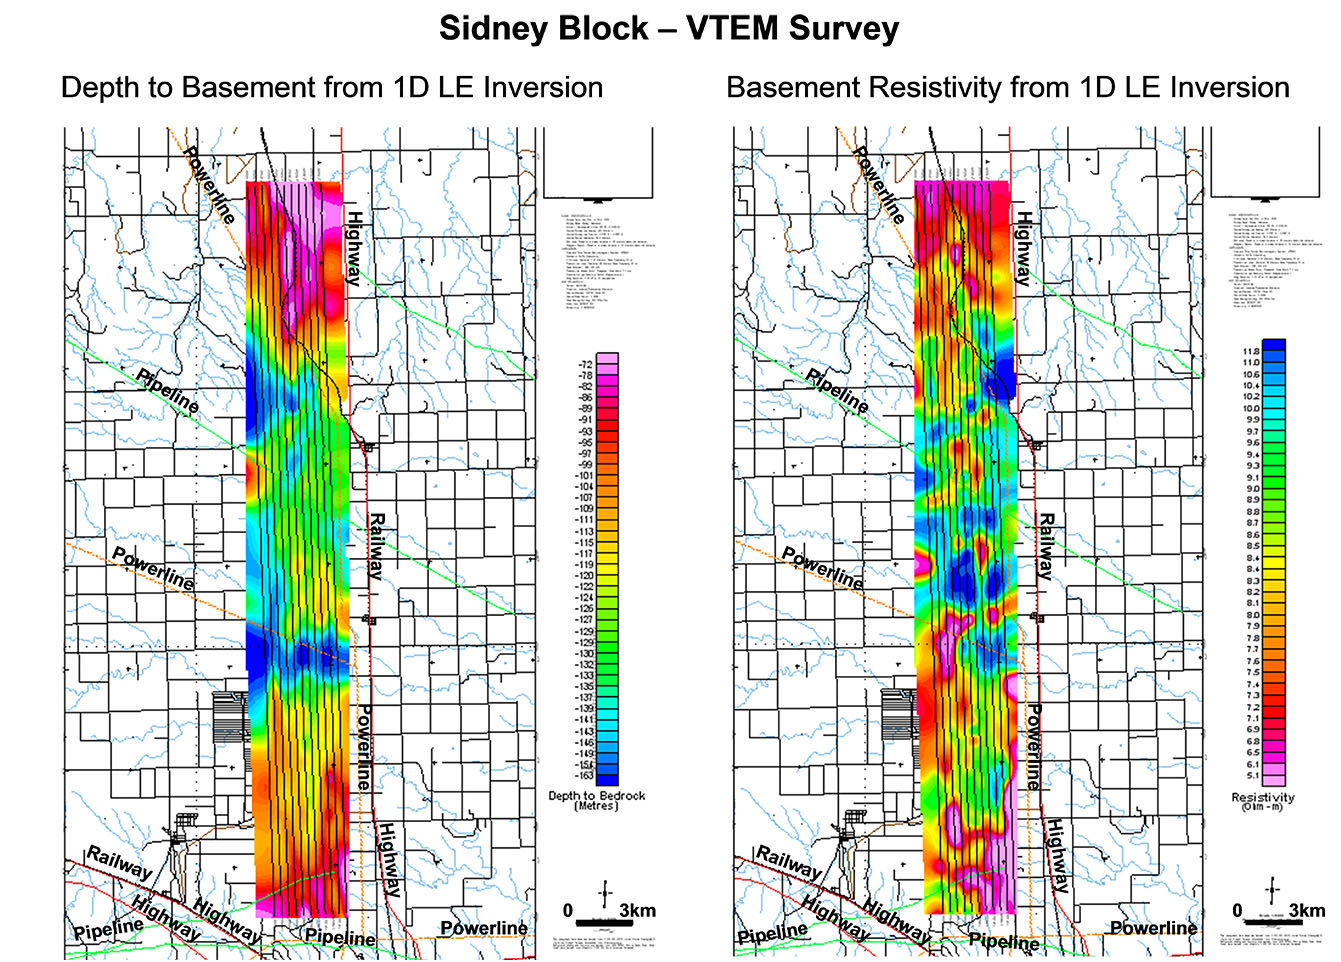
Figure 10: 1D LE Layered earth inversion modeling results for Sidney Block VTEM data shown in plan: a) Depth to basement (left) showing 55-185m thickness variation in Ogallala+Quaternary across survey area; b) Basement Resistivity (right), showing 2-14 ohm-metre variation in Brule Formation.
Conclusions
In the South Platte NRD region of Cheyenne County, in western Nebraska, standard frequency domain helicopter EM systems lack sufficient penetration to adequately map deep aquifers that extend below 160m depths in the Cheyenne Plateau north of Sidney, NE. Synthetic layered-earth model testing showed that the VTEM helicopter time-domain EM system would be capable of mapping the base of the Ogallala Group sand and gravel units above the White River Group Brule Formation siltstone basement rocks to depths below 200 metres. VTEM time-domain EM data were collected from a 4x40km test block where well logs place the base of the Ogallala at 160m depth. In spite of abundant man-made me-tallic culture that distorts the VTEM data locally, good quality data were obtained. The VTEM data were analyzed using layered-earth (LE & LCI) 1D inversions and conductivity-depth imaging (CDI). Inversion results indicate that the conductive basement at the base of the Ogallala aquifer was successfully mapped to depths estimated at 60 to 160 metres above the Brule basement rocks, which are consistent with the well log data. Based on simulated penetration depths in excess of 200m, VTEM could be extended into deeper, more conductive aquifers in other natural water resource districts of Nebraska.
Acknowledgements
The authors thank Geotech Ltd., COWI A/S and the United States Geological survey for allowing the presentation of the survey and study results.
References
Auken, E., and Christensen, A.V., 2004, Layered and laterally constrained 2D inversion of resistivity data, Geophysics, 69, 752-761.
Bournas, N., Legault, J.M, and Steffler, E., 2009, Report on helicopter-borne versatile time-domain elec-tromagnetic (VTEM) geophysical survey, Sidney Block, Nebraska, for United States Geological Survey, internal report (9148) by Geotech Ltd., June, 2009, 67 p.
Cannia, J.C., Woodward, D., and Cast, L.C., 2006, Cooperative hydrology study COHYST hydrostrati-graphic units and aquifer characterization report, Cooperative Hydrology Study, http://cohyst.dnr.ne.gov/, 96 p.
Martinez, K., Lo, B., Ploug, C., Pitcher, D. and Tishin, P., 2008, Water resources applications with the VTEM system, Expanded abstract, AEM2008: 5TH International Conference on Airborne Elec-tromagnetics, Haikko, Finland, 6 p.
Smith, B. D., Abraham, J.D., Cannia, J.C., and Hill, P., 2009, Helicopter electromagnetic and magnetic geophysical survey data for portions of the North Platte River and Lodgepole Creek, Nebraska, June 2008, US Geological Survey Open-File Report 2009-1110, 27 p.
Steele, G.V., Sibray, S.S., and Quandt, K.A., 2007, Evaluation of ground water near Sidney, Western Nebraska, 2004-05, Scientific Investigations Report 2007-5086, U.S. Department of the Interior and U.S. Geological Survey, 64 p.
Witherly, K., and Irvine, R, 2006, The VTEM airborne electromagnetic system – benchmarking contin-uous improvement via repeat surveys over time, SEG Expanded Abstracts, 25, 1273-1277.
Witherly, K., Irvine, R., and Morrison, E.B., 2004, The Geotech VTEM time domain helicopter EM sys-tem, SEG Expanded Abstracts, 23, 1217-1221.