For a PDF of this paper click here
Summary
Survey results from ground IP-Resistivity, Spectrem air-borne electromagnetics and magnetics, and ZTEM™ tipper AFMAG helicopter electromagnetics are compared over the Pebble porphyry copper deposit, in southwest Alaska. The IP data display higher amplitudes associated with the increased sulphides over the Pebble alteration halo that vector towards the deposit. Lower resistivities are associated with the chargeable alteration halo and slightly higher resistivities occur in the less chargeable core at Pebble West. The deeper Pebble East was not detected in IP due to insufficient penetration. The airborne EM surveys, Spectrem and ZTEM, appear to map the resistivity contrast with more resolution than the ground IP resistivity survey, due to higher sampling and better depth of investigation. Spectrem conductors coincide with the rich pyrite mineralization, sulphide veins and alteration, but the depth of investigation is at the detection limit of Pebble East. The ZTEM tipper AFMAG survey appears more sensitive to weak resisitivity contrast especially at depth. Both Pebble West and East are well detected in the ZTEM results.
Introduction
The Pebble deposit that is managed by the Pebble Partnership, a joint venture between Northern Dynasty Mines and Anglo American plc, is a calc-alkalic copper-gold-molybdenum porphyry located in the Bristol Bay region of southwest Alaska, 320 km southwest of Anchorage and 27 km west-northwest of the village of Iliamna. Pebble is reputed to be the 1ST largest gold and 6TH largest copper deposit in the world. This study compares the ground IP-Resistivity results, Spectrem airborne electromagnetic (Macnae et al., 1991; Legatt et al., 2000), and ZTEM tipper electromagnetic (Lo and Zang, 2008; Lo et al., 2009; Legault et al., 2009ab) results over the Pebble porphyry.
General Geophysics
Geological, geochemical, and geophysical surveys have been conducted in the Pebble project area since 1985. Induced polarization (IP) and resistivity surveys in 1988-2001 defined a chargeability anomaly within Cretaceous rocks about 91 km2 in extent that measured approximately 21 km north-south by up to 10 km east-west. It contained 11 distinct centres reflected by stronger chargeability anomalies, many of which were later demonstrated to be coincident with extensive copper, gold and molybdenum soil geochemical anomalies. All known zones of mineralization of Cretaceous age in the Pebble district occur within the broad IP anomaly (Rebagliati et al., 2009).
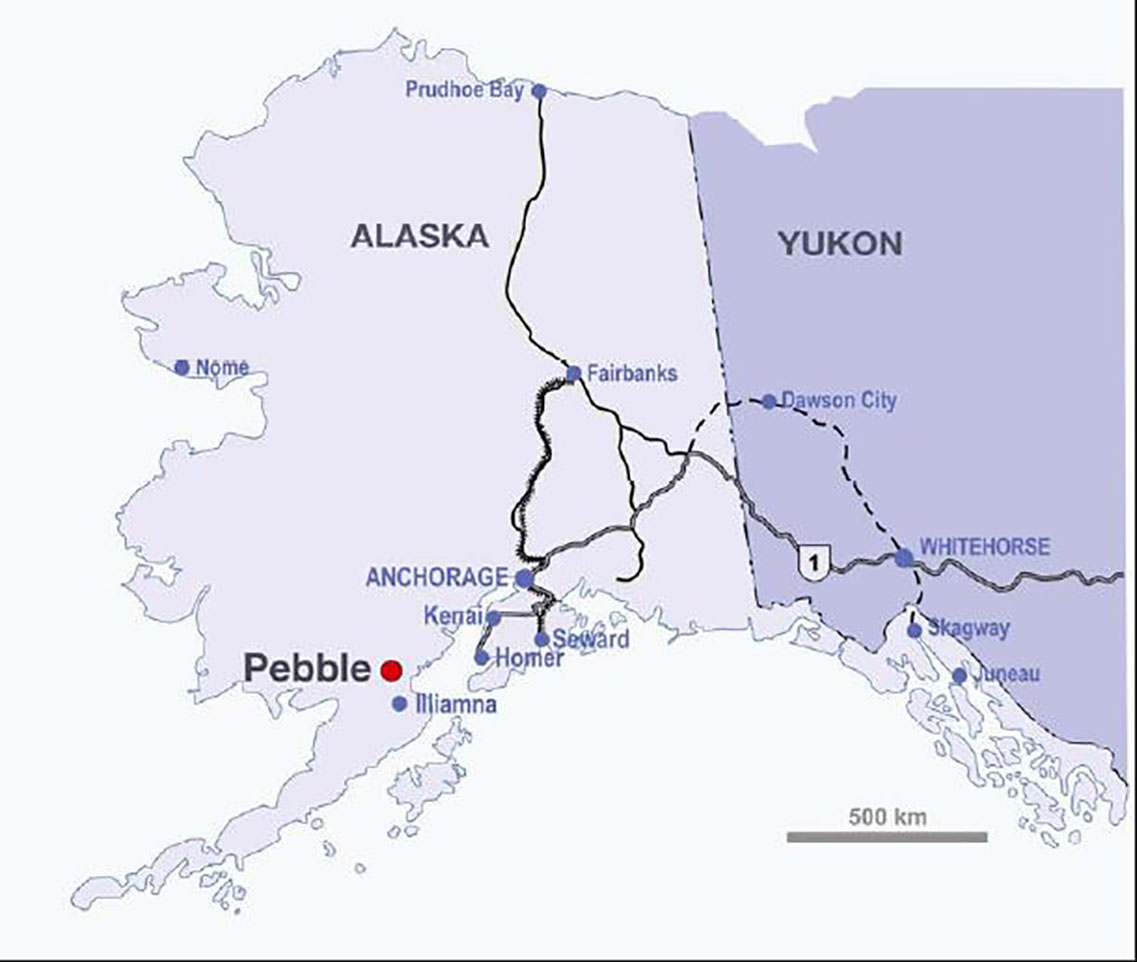
Figure 1: Pebble property location in southwest Alaska
From 1988-2001, IP-Resistivity surveys utilized both the dipole-dipole and pole-dipole configurations, with separa-tions of n=1 to 5, 7 or 8, a-spacings of 500ft, and line-separations of 300m-1km. Both time-domain and Phase IP were employed. In 2009, a Zonge time-domain IP survey utilized a larger, more deeply penetrating array with 400m a-spacing, with n-1 to 7, 8 to infill at a minimum of 500m line-spacing (Paré, 2010).
From 8-30 July, 2009, Spectrem Air Limited conducted an airborne electromagnetic, magnetic and radiometric survey over the Pebble project in Alaska. A total of 3,840 line kilometres were surveyed. The survey was done in two stages; a regional survey at 1500m flight-line spacing, cov-ering an area of approximately 30 x 12 km, and a more detailed survey at 250m flight-line spacing along strike of the current deposit. A base frequency of 45Hz was used. The transmitter (Tx) height was 107m above ground and the transmitter-receiver (Tx-Rx) vertical and horizontal separa-tions were 37.1m and 122.2m. (Klinkert et al, 2009).
On Sept. 4TH, 2009, a Geotech helicopter-borne geophysical survey was carried out over the Pebble Property. Principal geophysical sensors were a Z-Axis Tipper electromagnetic (ZTEM) AFMAG system, and a caesium magnetometer. A total of 250 line-kilometres were flown at a flight-line spacing of 200m and covered 60 square kilometres. During the survey the helicopter was maintained at mean height of 163m above the ground, allowing for a nominal EM sensor terrain clearance of 89m (Acorn et al, 2009).
General Geology
The Pebble property is underlain by Jura-Cretaceous to Eocene igneous and sedimentary rocks. The Pebble deposit is a calc-alkalic copper-gold-molybdenum porphyry deposit which formed in association with granodiorite intrusions emplaced at roughly 90 Ma. The deposit comprises the contiguous Pebble West and Pebble East Zones (Figure 2), discovered in 1986 and in 2005, respectively. Mineralization at Pebble West occurs around small granodioritic stocks that intrude the country rocks. The Pebble East mineralization occurs within a granodioritic stock and in sills that cut the country rocks. Pebble West extends to surface and Pebble East is entirely overlain by east-thickening, younger volcano-sedimentary cover, up to 600m thick. Pebble is bounded to the SE by the major ZG1 dip-slip fault, east of which the deeper Far East Zone (Figure 2) has been recently identified at >1.5km depths.
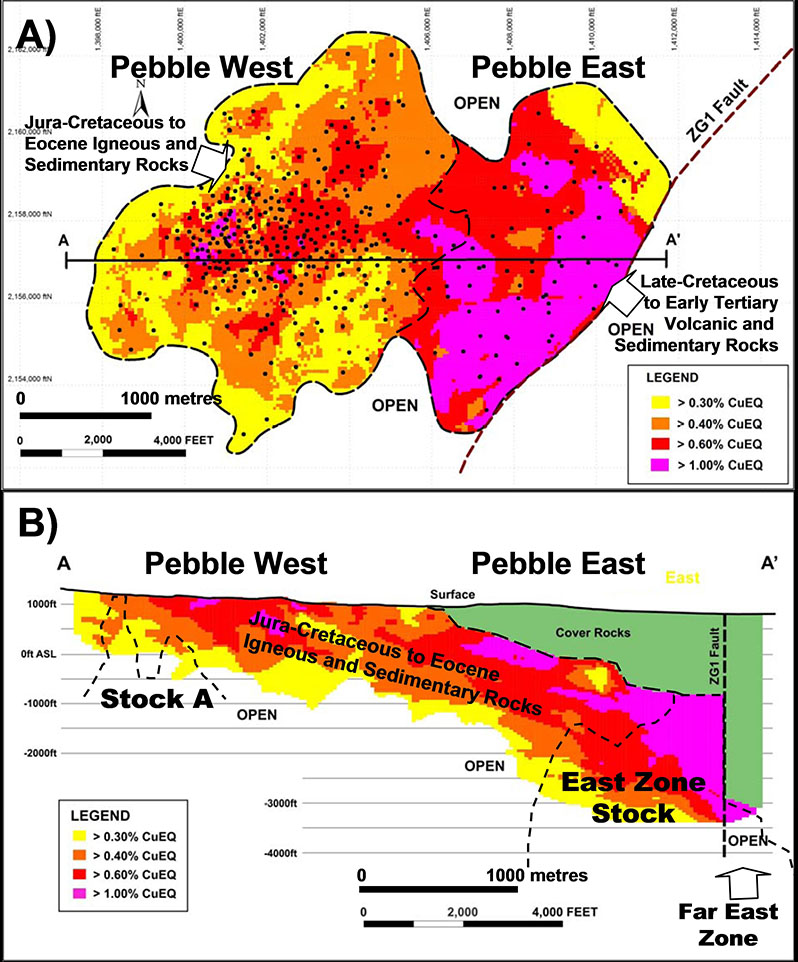
Figure 2: A) Plan view and B) Cross Section of Pebble Deposit showing general geology and grade distribution across Pebble West and Pebble East zones (modified after Rebagliati et al, 2009).
The deposit hosts K-silicate alteration and associated quartz-sulphide veins, overprinted by phyllo-silicate alteration. Sulphides mainly consist of hypogene pyrite, chalcopyrite, molybdenite and bornite; supergene and thin oxide zones also occur at Pebble West. High grade mineralization at Pebble East is associated with advanced argillic alteration. The Cu-Au-Mo mineralization, as it is currently known, extends over an east-elongated area of 4.9 by 3.3 km, and to a depth of 610m at Pebble West and at least 1525m at Pebble East. The deposit is open to the east, south, NW and SE; a larger zone of strong alteration and low grade mineralization extends to the north, south and west. The Pebble Deposit mineral resource, at a 0.30% copper equivalent cut-off, consist of 5.94 billion tonnes of measured and indicated resources grading 0.42% Cu, 0.35 g/t Au and 250 ppm Mo (Rebagliati et al., 2009).
IP-Resistivity Survey Results
The IP signature over the Pebble property shows a large scale anomaly (Figure 3) of roughly 100 km-sq that extends 4km from south up to north of Pebble deposit. There is a severe north-south break in the IP response just to the east of Pebble West representing a drastic drop in the chargeability value. It appears to be explained by the thicker post mineral cover and a major structure. The strongest response is ob-served in the vicinity of Pebble West surrounding the north, west and south part, with chargeability values ranging from 70-100msec (Paré, 2010).
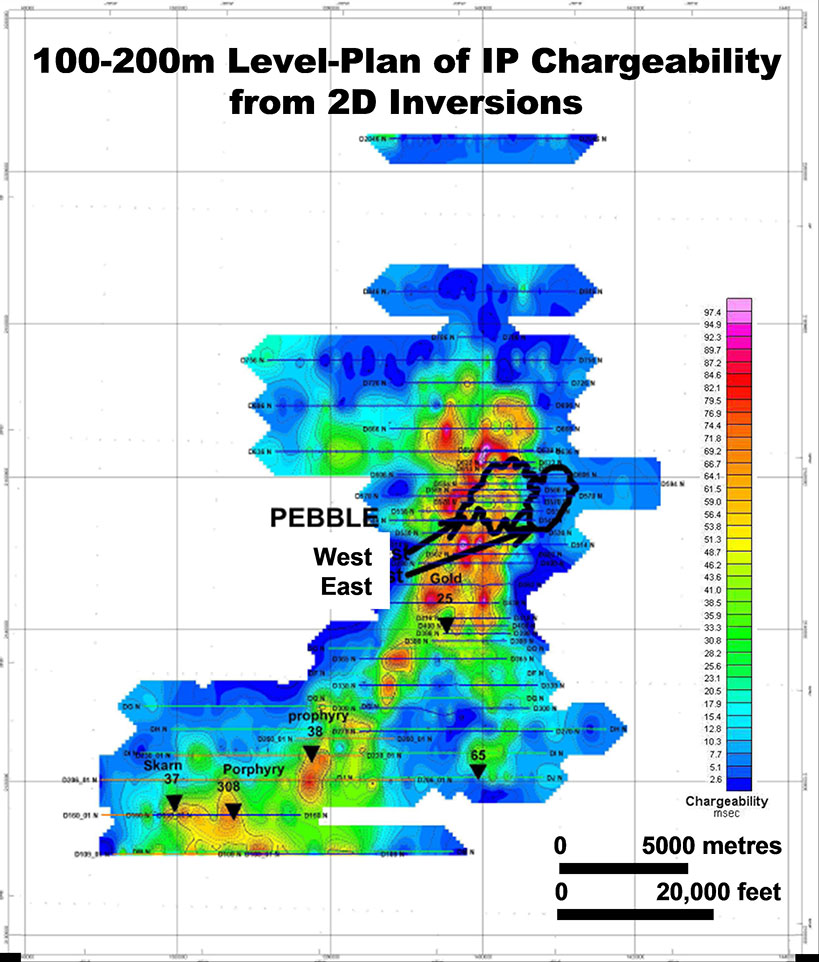
Figure 3: Level plan (100-200m elevation) of the chargeability over Pebble Deposit from 2D inversion.
The resistivities at Pebble range from 10 to 1000 Ohm-m (Figure 4). The Pebble tenement does not host a very high resistive background. The resistivity contrast across the property correlates well with the amount of sulphides-Py (increase) and alteration. The lowest resistivity signature is located just to the north of Pebble West. The upper north part of the survey coverage (from Pebble deposit to the north) suggests a lower resistivity environment than the southern part. The other mineralized areas discovered outside Pebble are associated with a high resistivity (property background). Other resistivity lows further south are not associated with significant chargeability anomalies.
These results indicate that chargeability response does not direct detect the economic mineralization at Pebble. The IP surveys have mostly mapped pyrite and alteration which are a vector leading toward the economic mineralized zone. The Pebble West deposit is surrounded by a strong response related to Py enrichment and alteration halo. The core of the deposit is characterized by a lower chargeability response. The same tendency is observed with the resisitivity data set; low resistivity associated with strong chargeability and slightly more resistive and less chargeable in the core. The Pebble East ore body has not been detected by the existing IP-Resistivity surveys, which were performed before the discovery of Pebble East and thus the geometry of their configurations were not designed to see at this depth.
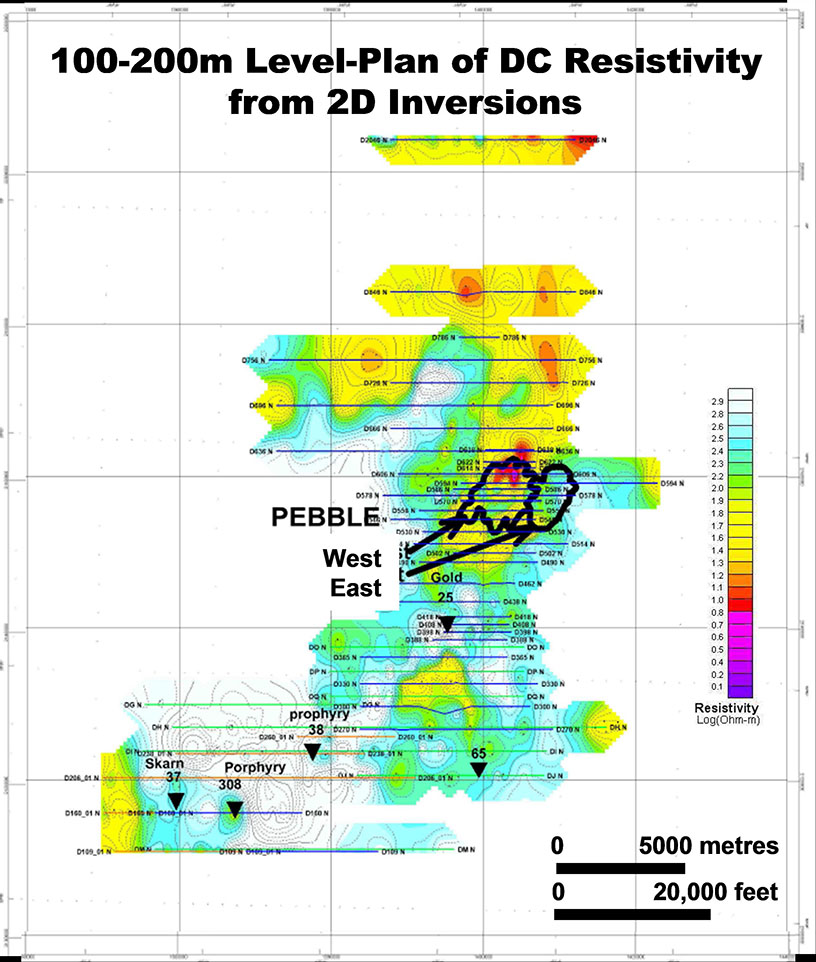
Figure 4: Level plan (100-200m elevation) of the resistivity over Pebble Deposit from 2D inversion.
Spectrem Survey Results
The Spectrem Air electromagnetic survey in combination with the magnetics over the Pebble area were to assist in identifying and delineating major structures that control the deposit location and high grade mineralization (i.e., ZG1 and ZE faults, etc.), as well as understanding the alteration zones and their distribution. Lastly the Spectrem EM survey was expected to help define possible sulphide enrichment zones, to 500-600m depths.
The Spectrem electromagnetic survey (Figures 8-9) has returned some interesting results regarding its capability to map resistivity contrasts. The time constant map (TAU) in Figure 5 shows an indication of the conductive pattern of the property mapped regardless to the depth and the size of the conductors. Generally the TAU map presents an excellent match with the ground resistivity survey results.
In Figure 8, the anomaly picking of the EM profiles has detected a number of conductors mostly located just north of Pebble West and in the northern portion of Pebble East that coincide with the rich pyrite mineralization, sulphide veins and alteration. The conductors appear to be from an inductive source and have a very well defined shape in the profile. A circular conductive feature of moderate to good conductor has been picked up at the exact location where a flat lying magnetic body is interpreted. This conductive feature is also mapped in the resistivity survey.
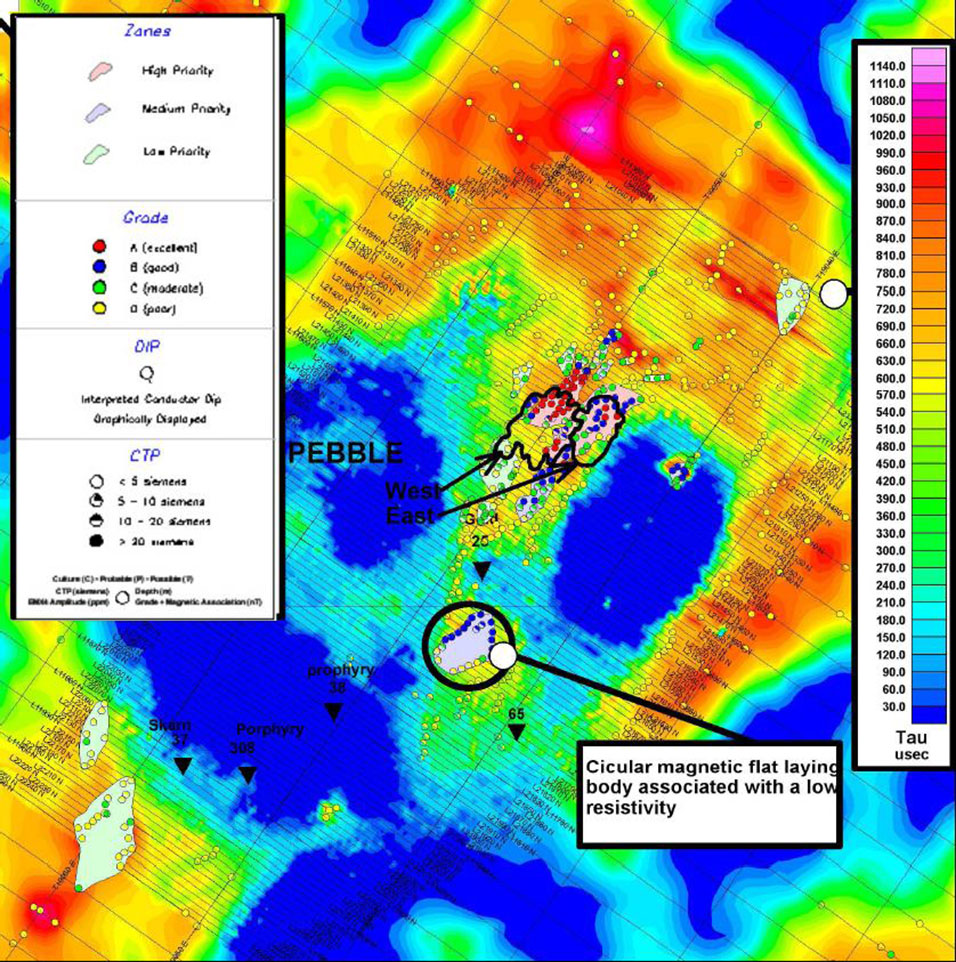
Figure 5: Spectrem time-constant (Tau) map, with picked EM anomalies.
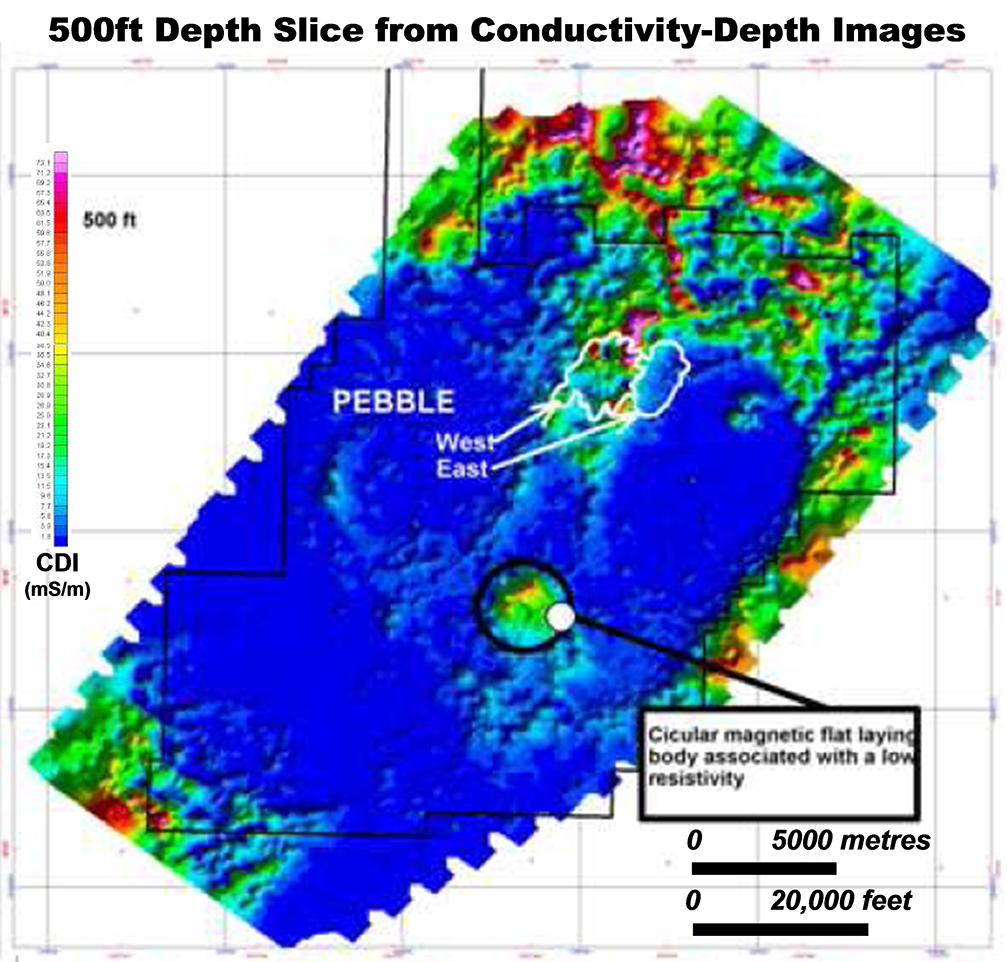
Figure 6: Spectrem depth slice at 500ft from CDI imaging.
Figure 6 shows the conductivity depth image (CDI) at 500 ft depth below surface. At depths greater than 1000ft the limit of the investigation of the survey drops drastically in conductive areas. The depth slice indicates stronger conductivity in the north and southwest property and north of Pebble. Pebble East has no signature in the 500ft CDI slice but starts appearing at 1000ft. The Pebble East low resistivity response is probably due to its alteration. Based on the EM conductivity response and the ground IP survey, the Spectrem survey appears to be generally unable to map the disseminated sulphides (as expected) but has better sensi-tivity to resistivity contrast associated with alteration.
ZTEM Survey Results
The main objectives of the ZTEM (AFMAG; Ward, 1959; Labson et al., 1985) over Pebble were to test its ability to map the porphyry deposit from surface to depth, based on resistivity contrasts and to establish a comparison study with previous geophysical surveys (Spectrem and IP).
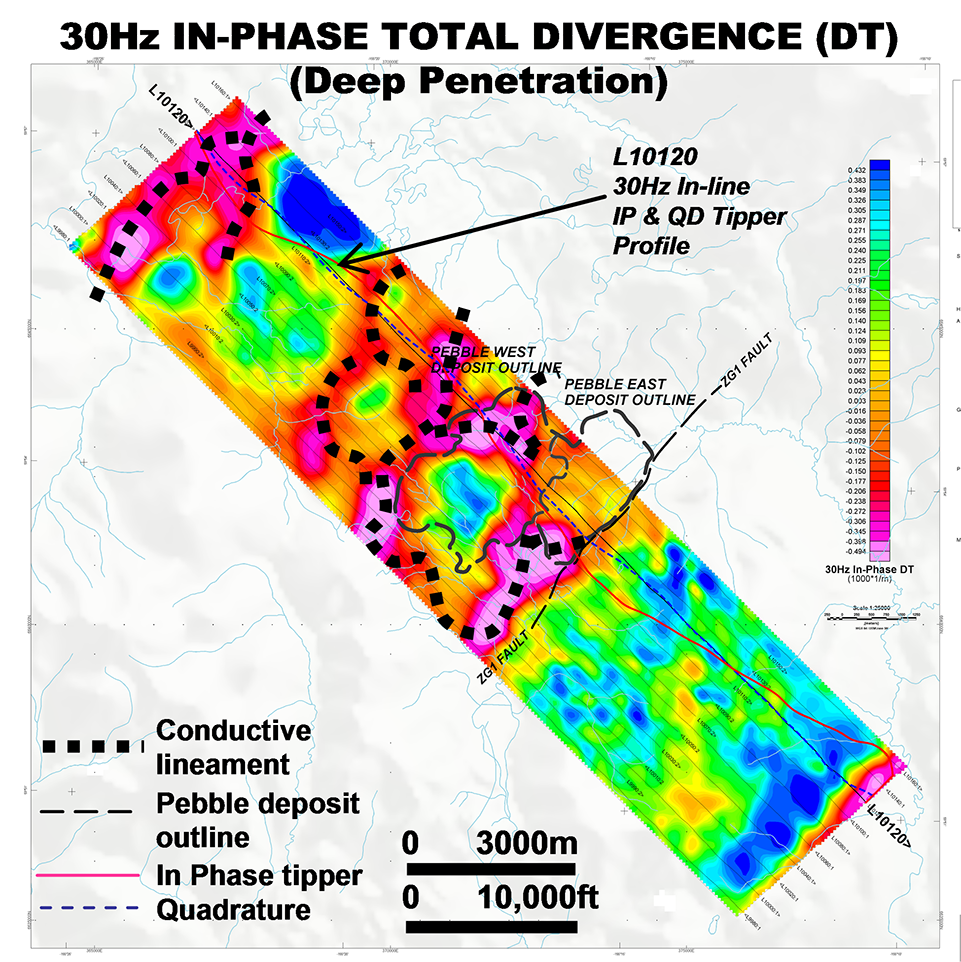
Figure 7: ZTEM Total Divergence of In-Phase tipper at 30Hz.
Figure 7 presents the ZTEM tipper results in plan shown as a Total Divergence (DT) image (Lo et al., 2009; analogous to Peaker parameter of Pedersen (1998) that converts the tipper cross-overs into peaks) of the In-Phase component with the outline of the Pebble East and West Zones overlain. The Pebble deposit is nearly invisible in the 360Hz high frequency data likely due to its limited penetration and poor relative contrasts in this skin depth range; However in the deeper, lower frequency 30Hz image, the Pebble deposit is better contrasted with the surrounding rocks. The 30Hz DT image indicates more resistive rocks in the center that correlates with the mineralized potassic-altered core; and the lower resistivities outside the deposit coincide with the surrounding clay-altered pyrite halo.
Figure 11 present the 2D cross-sectional resistivity results obtained from the Zvert2D inversion (Legault et al., 2009b) of the In-Line (Z/X) ZTEM tipper data for L10120 directly over the Pebble West and Pebble East deposits, from surface to 1.5km depths. Pebble West is defined as a shallower, more resistive body surrounded by lower resistivity rocks at depth and further west, which is consistent with the K-silicate alteration and surrounding lower grade pyritic clay-altered halo. Pebble East is defined as a deeper resistivity low that is consistent with its stronger argillization, which lies below more resistive metasedimentary cap-rocks. East Zone appears to extend below 1km.
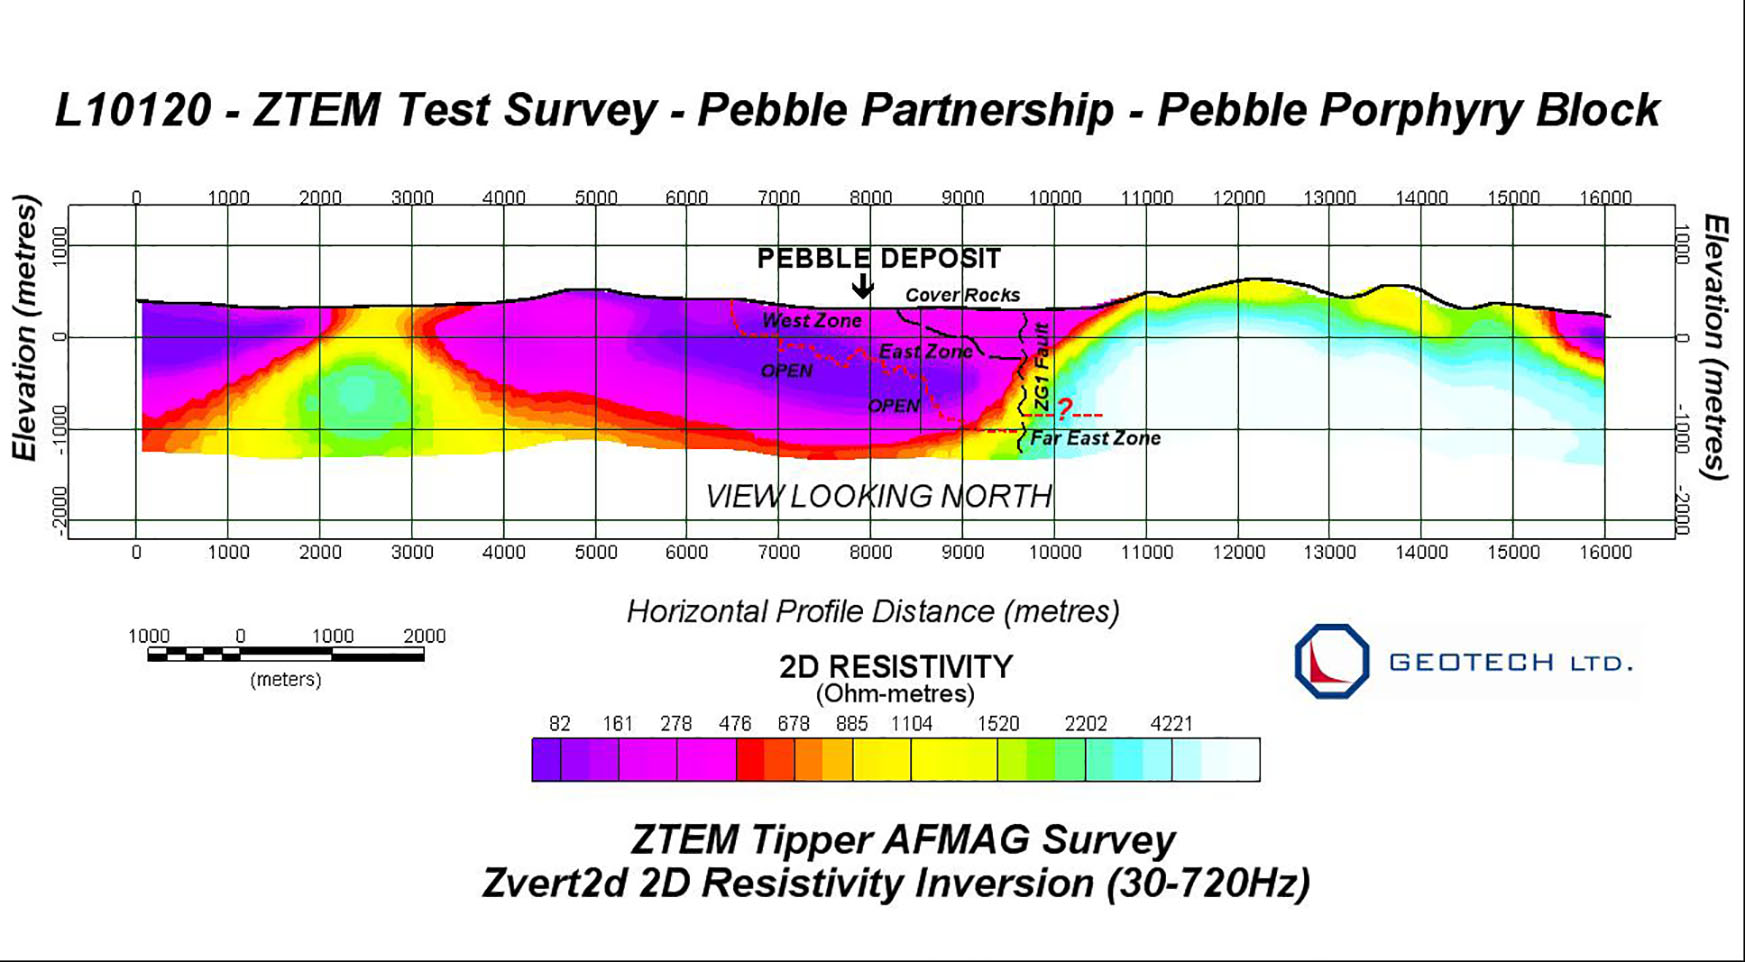
Figure 8: ZTEM L10120 2D resistivity inversion over Pebble.
Conclusion
All surveys performed over the Pebble property brought significant amount of information that improved the understanding of the geology,alteration and mineralization of the system. The IP survey remains an important tool in the exploration program over Pebble. Without IP, disseminated sulphides will not be contrasted if the country rock has a similar resistivity as the mineralized rock. Pebble East was not detected by IP due to lack of penetration of the survey configurations previously utilized.
The airborne surveys, Spectrem and ZTEM, have mapped the resistivity contrasts with more resolution than the ground resistivity survey. Their higher density sampling and better depth of investigation improved on the ground IP work (pre-2009). Spectrem conductors coincide with the rich pyrite mineralization, sulphide veins and alteration. However, as expected, Spectrem was unable to detect the disseminated mineralization in the system compared to the chargeability measurement or to properly estimate the thickness of the tertiary cover, due to the lack of physical property contrasts. The Spectrem survey depth of investigation is at the limit of detection of Pebble East.
The AFMAG (ZTEM) survey over Pebble deposit area correlates with the Spectrem data in defining geological features and structures based on lateral resistivity contrasts. The frequency bandwidth range of the ZTEM maps the near surface while the lower frequency allows for greater depth of investigation. The ZTEM AFMAG tipper is more sensitive to weak resisitivity contrast than those observed on the Spectrem survey especially at depth. Both the Pebble West Zone and East Zone are detected in the ZTEM results based on resistivity contrasts due to alteration, lithology and structure. Physical properties measurements are key in the improvement of the inversion of the AFMAG data.
Acknowledgements
The authors thank Anglo American Exploration (Canada) Ltd., Northern Dynasty Mines Ltd., and Geotech Ltd. for generously allowing us to present these results.
References
Acorn, W., R. Coyoli, H. Kumar and J.M. Legault, 2009, Report on helicopter-borne Z-axis tipper electromagnetic (ZTEM) and aeromagnetic geophysical survey, Pebble Property, Lliamna, Alaska, for Pebble Partnership, internal report by Geotech Ltd., 56 pp.
Klinkert, P.S., S. Letts, J. Smit, and L. Polome, 2009, Spectrem survey of the Pebble area (Alaska), for Pebble Limited Partnership, internal report by Spectrem Air Ltd., 75 pp.
Labson, V. F., A. Becker, H. F. Morrison, and U. Conti, 1985, Geophysical exploration with audio-frequency natural magnetic fields, Geophysics, 50, 656–664.
Leggatt, P.B., P.S. Klinkert, and T.B. Hage, 2000, Case History: The Spectrem airborne electromagnetic system—Further devel-opments, Geophysics, 65, 1976-1982.
Legault, J.M., H. Kumar, B. Milicevic, and L. Hulbert, ZTEM airborne tipper AFMAG test survey over a magmatic copper-nickel target at Axis Lake in northern Saskatchewan, SEG Expanded Abstracts, 28, 1272-1276.
Legault, J.M., H. Kumar, B. Milicevic, and P. Wannamaker, 2009, ZTEM tipper AFMAG and 2D Inversion results over an un-conformity uranium target in northern Saskatchewan, SEG Expanded Abstracts, 28, 1277-1281.
Lo, B., and Zang, M., 2008, Numerical modeling of Z-TEM (airborne AFMAG) responses to guide exploration strategies, SEG Expanded Abstracts, 27, 1098-1101.
Lo, B., J.M. Legault, P. Kuzmin, P., and M. Combrinck, 2009, Z-TEM (Airborne AFMAG) tests over unconformity uranium deposits, ASEG Extended abstracts, 6 pp.
Macnae, J.C., R. Smith, B.D. Polzer, Y. Lamontagne, and P.S. Klinkert, 1991, Conductivity-depth imaging of airborne electro-magnetic step-response data, Geophysics, 56, 102-114.
Paré, P., 2010, Pebble Project – Report on a compilation\interpretation of the IP-Resistivity, Spectrem and ZTEM Surveys, internal report by Anglo American Exploration (Canada) Ltd., 61 pp.
Pedersen, L.B., 1998, Tensor VLF measurements: Our first experiences, Exploration Geophysics, 29, 52-57.
Rebagliati, C.M., J. Lang, E. Titley, D. Rennie, L. Melis, D. Barratt, and S. Hodgson, 2008, Technical report on the 2008 program and update on mineral resources and metallurgy, Pebble copper-gold-molybdenum project, Iliamna Lake area, southwestern Alaska, USA, for Northern Dynasty Minerals Ltd., NI-43 101 report, 170 pp.
Ward, S. H., 1959, AFMAG—Airborne and ground: Geophysics, 24, 761–787.