For a PDF of this paper click here.
PRESENTED AT AEGC 2018
SUMMARY
The Athabasca Basin’s major uranium deposits and mines are generally proximal to graphitic conductors (reducing environment) and accompanied by an alteration ‘halo’ which is usually a resistive low, but can also be silicified (resistivity high). The sandstone environment is normally highly resistive which makes things ideal for EM detection of weaker graphitic conductors at depth.
The Triple R deposit on Fission Uranium Corp’s Patterson Lake South Property is located in Canada’s Athabasca Basin, home to the world’s richest uranium mines. It is the only major, high-grade deposit in the region that is potentially open-pitable and is the largest mineralized trend in the region – currently standing at over 3 km in length.
Patterson Lake South is unconventional in that virtually all the major high grade uranium deposits have been inside the basin margins and were on the east side of the Athabasca Basin; whereas Patterson Lake South lies outside the basin margins and is on the west side of the Basin.
The Patterson Lake South discovery is chronicled from the initial airborne radiometric and EM surveys, to ground follow-up using DC resistivity and induced polarization, horizontal loop EM, moving loop TEM and radon survey, leading up to the discovery holes. The deposit shows excellent correlation with a VTEM conductive ‘bright spot’, an interpreted conductor and a resistivity low segment. Also significant is the evidence of cross structure seen in the resistivity at the west side of the displayed deposit outline.
The continued success of the resource delineation and expansion is attributed to the dedicated Fission staff for their work to bring the project forward. From Discovery to Resource Estimate, the Triple R Deposit was achieved in just two years of drilling.
Key words: uranium, unconformity, Athabasca Basin, EM, resistivity
INTRODUCTION
The Triple R Deposit (Ross, 2015) on Fission Uranium Corp’s Patterson Lake South (PLS) property is located in Canada’s Athabasca Basin (Figure 1), home to the world’s richest uranium mines. The deposit is accessible by all-weather Highway 955 which continues north to the UEX-AREVA Shea Creek and to the Cluff Lake uranium mine. It is the only major, high-grade uranium deposit in the region that is potentially open-pitable and is the largest mineralized trend in the region – currently standing at over 3 km in length. Growth is driven by a highly skilled, award-winning technical team and successful entrepreneurial management. Fission has 100% ownership of the PLS Property, which comprises 17 claims totalling 31,039 ha. The indicated uranium resource at Triple R is estimated at 2.2 Mt @ 1.58 U308 and 0.51 g/t Au (Ross, 2015).
The PLS discovery, in November, 2012, has been previously documented (Bingham, 2016) and some content is borrowed from the presentation at the 2012 Saskatoon Geological Open House (Ainsworth et al., 2012), 2013 Saskatoon Geological Open House(McElroy and Ashley, 2013) and the Fission Uranium Web Site (http://www.fissionuranium.com).
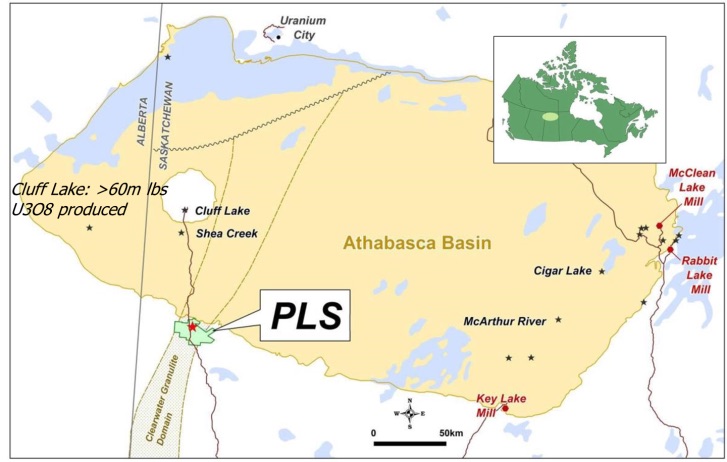
Figure 1: Patterson Lake South and Canada’s Athabasca Basin, with property location in western Canada shown in inset (www.fissionuranium.com).
Athabasca Deposit Geophysical Character
The uranium deposits in the Athabasca region of northern Saskatchewan are of the unconformity-type, whose fundamental aspects are: 1) Reactivated basement faults and 2) Two types of hydrothermal fluids (oxidizing and reducing; Ross, 2015). There are two end members of unconformity-type uranium deposits (Figure 2a): 1) Egress-type hosted in sandstone (i.e., Cigar Lake and Midwest), and b) Ingress-type hosted in basement rocks (Collins Bay and Eagle Point), but variants between both end-members can also exist (Figure 2b; Ross, 2015). The Triple R is a basement-hosted, structurally controlled, high grade Athabasca unconformity-type uranium deposit.
The east side of the Athabasca basin hosts virtually all the major high grade deposits with the exception of Cluff Lake and the deep Shea Creek deposits and now the new deposits in the Patterson Lake Corridor (Figure 1). Cluff Lake is an anomalous abnormal occurrence and is located on the Carswell dome, not within the Athabasca basin. Exploring outside of the basin margins is somewhat unconventional as there is no present unconformity surface, but there may have been in geological history. The recent uranium discoveries at Millennium (Fayek et al., 2010) and Roughrider deposits (Doerksen et al., 2011), which are both basement-hosted uranium deposits, showed these deposit-types are not to be ignored.
Unconformity uranium deposits are generally proximal to graphitic conductors (reducing environment) and accompanied by an alteration ‘halo’ which is usually a resistive low, but can also be silicified (resistivity high). The sandstone environment is normally highly resistive which makes things ideal for EM detection of weaker graphitic conductors at depth (Bingham, 2016).
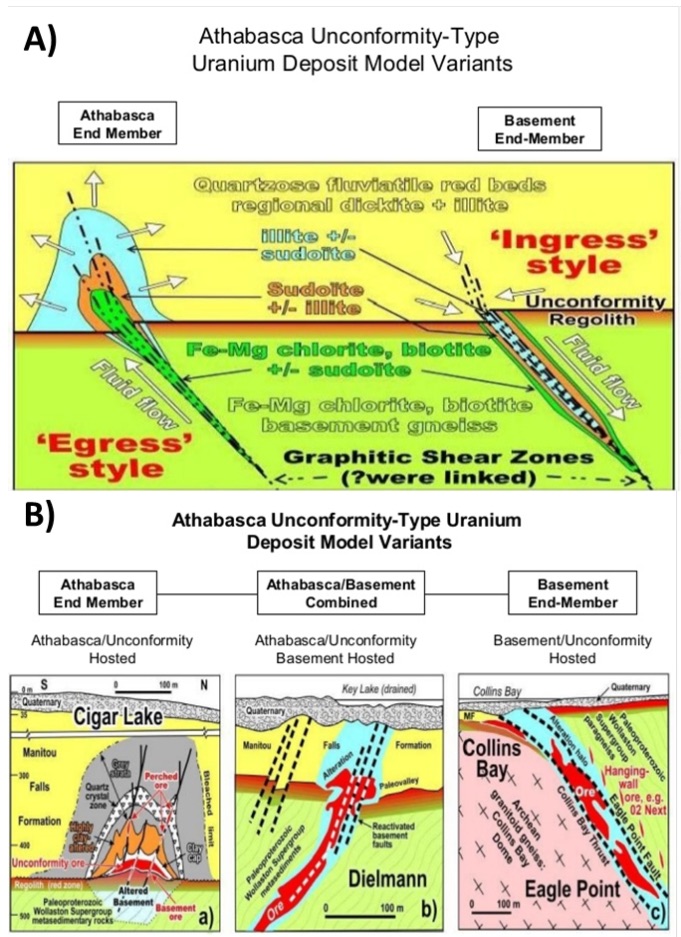
Figure 2: Unconformity Deposit Models and Examples (after Jefferson et al., 2007).
Events Leading to Discovery
The initial phase of work leading to the discovery consisted of research. A review of historical assessment reports (late 1970’s) showed strong radon anomalies coincident with EM conductors 3 to 4 km west of the deposit. A subsequent airborne radiometric & magnetic survey was instrumental in focussing ground prospecting for radioactive boulders (Figure 3). Follow up prospecting and trenching with quaternary geological analysis developed a conceptual section for potential mineralization (Figure 4). The conceptual section was invaluable in planning further work and selecting targets. Airborne and ground geophysical surveys identified a number of prospective target areas and drill testing resulted in the massive pitchblende discovery in November 2012 (Bingham, 2016).
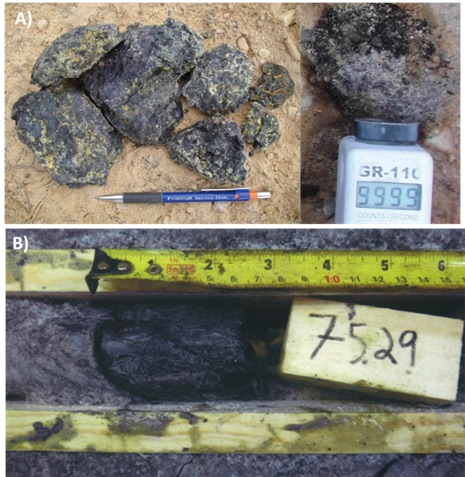
Figure 3: a) Massive Pitchblende Boulders, b) Discovery Hole PLS12-22 Massive Pitchblende (after Ainsworth et al., 2012; Bingham, 2016).
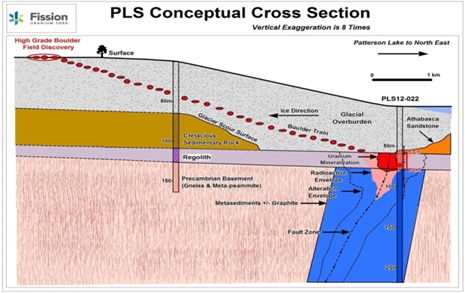
Figure 4: – Conceptual quaternary and bedrock geologic cross-section over PLS deposit (after Ainsworth et al., 2012).
METHOD AND RESULTS
2009-2012 Airborne Geophysics
Airborne geophysics consisted of an initial property wide fixed wing LiDAR, radiometric and high resolution magnetic survey, in October, 2009. A low level tight drape flight pattern at 50m line spacing’s was used for extremely detailed coverage. The survey was carried out by Special Projects Inc., of Calgary Alberta, Canada (Ross, 2015). The aeromagnetic results successfully delineated different basement lithologies and the traces of basement faults, shears zones and areas of structural complexity. Some innovative proprietary focused crystal arrays were used on a small fixed wing aircraft (Bingham, 2016). The airborne radiometric results were instrumental in locating the boulder field, outlining a number of uraniferous hot spots within a 3.9 km x 1.4 km wide area (Figure 5). The radioactive boulder field contained massive to semi-massive uranium oxide mineralized boulders (see Figure 3).
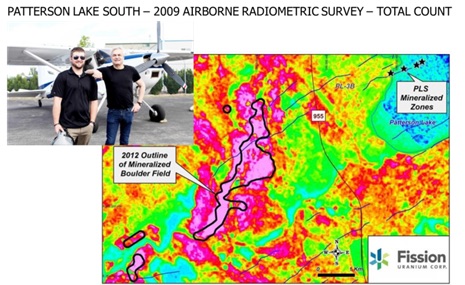
Figure 5: 2009: Airborne Radiometric Survey Results, showing total count pseudo-colour image, outline of mineralized boulder field and location of PLS deposit. Inset shows Special Project Inc. survey crew and aircraft (after Bingham, 2016).
Initial ground horizontal loop frequency domain EM (HLEM) surveying using the MaxMin instrument (Apex Parametrics Ltd., Uxbridge CAN) encountered conductive overburden response, from clay lodgement till and Cretaceous mudstones west of Patterson Lake that masked bedrock features (Ainsworth et al., 2012). As a result, a property wide VTEM (Witherly et al., 2004; Prikhodko et al., 2010) helicopter TDEM survey was conducted in 2012 using the VTEM Plus system with Z and X component EM measurements and horizontal magnetic gradiometry over the entirety of the property. Flight lines totalling 1,711.3 line-km and oriented at 135° were flown at 200 m line spacings. The VTEM survey successfully outlined numerous conductors throughout the property. In many cases the relatively shallow depth of EM conductors provided sufficient resolution for direct drill targeting. However in other cases complex nature and sometimes flat lying conductor geometry could not be adequately resolved without ground geophysical follow-up (Ross, 2015).
The Auto Tau apparent conductivity estimate from the VTEM data was used as an initial indicator in defining priority drill targets (Figure 6). The apparent conductivity estimate is based on the VTEM decay time constant of the Z component (TAU). The Z component is used for this calculation as it is the stronger and cleaner response. The conductivity peaks do not appear at the location of sub-vertical conductors but are on the shoulder of the Z component response. Of considerable interest was the conductive ‘bright spot’ anomaly in an up-ice (north-east) direction (see Figure 6) from the radioactive boulder train along a complex PLS main conductor trend.
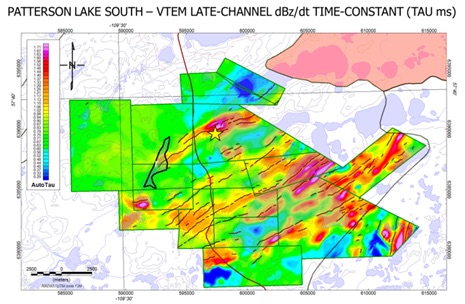
Figure 6: February 2012 – VTEM late-channel dBz/dt decay time constant (Tau), showing location of anomalous boulder train (black polygon), the PLS discovery (yellow star) and the associated conductive bright spot up ice to the northeast (after Bingham, 2016).
2011 – 2012 Ground Geophysics
The initial interpretation of the airborne VTEM encountered complex multiple sub vertical conductors which are poorly resolved with the in-loop geometry of the VTEM EM system. There was also some difficulty correctly spotting drill targets over the complex areas. Further ground geophysics prior to discovery and during delineation consisted of DC Resistivity and EM surveys.
DC Resistivity
In the Athabasca unconformity uranium deposits, mineralization is typically accompanied by a conductor and an alteration halo observed as a resistivity low in the lower sandstone. In the absence of the sandstone layer, at Triple R, the alteration takes on a different character consisting of a widening and /or increases in intensity of the basement resistivity.
In the Athabasca area, the very high input/contact resistances result in poor current injections and poor to marginal chargeability measurements. Moreover, personal experience of limited studies in other areas of the Athabasca Basin has shown no correlation of chargeability and mineralization. A modified pole-dipole resistivity array, known as “Enhanced” or “Double Density” (Figure 7), resulted in better resolution and improved data quality. For an enhanced array measurement, the current electrodes are moved along the profile at ½ of the “a-spacing” (50m for 100m a-spacing) in order to double the data density at almost no extra cost. This results in an excellent spatial sampling of data along the line. The high density data of the enhanced array both increases the resolution and improves data quality. The X2IPI toolbox (Lomonosov Moscow State University, Russia) for processing 2D electrical resistivity tomography data is efficient and smartly removes current and potential electrode noise (Bingham, 2016). A total of 93.9 km of pole-dipole DC resistivity surveys were conducted at Patterson Lake South (Figure 8).
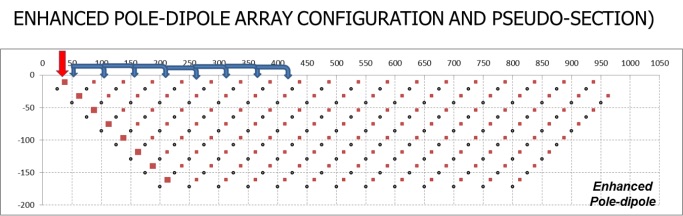
Figure 7: Enhanced or Double – Density PLDP Array.
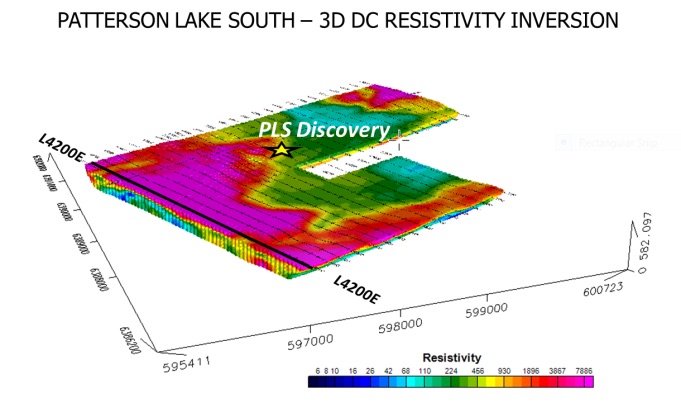
Figure 8: 3D Resistivity Voxel from 3D Inverted DC Resistivity, showing PLS discovery and location of cross-section in Figure 9 (after Bingham, 2016).
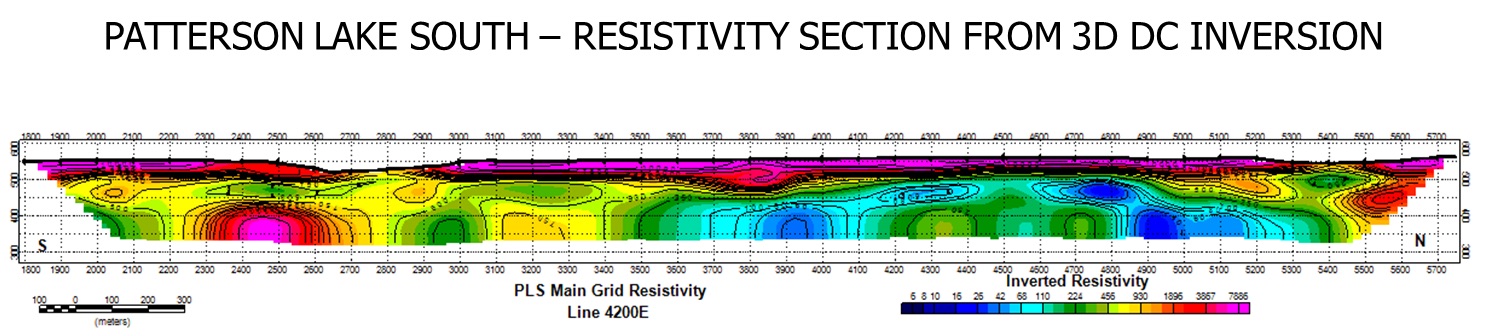
Figure 9: Resistivity Section for L4200 E from 3D DC inversion at PLS (after Bingham, 2016).
Inversion has become a necessity for IP/Resistivity arrays. It compensates for and removes geometrical effects such as “pant-leg” type responses and enables a more direct geological correlation of the resistivity data and the geology by distinguishing the source of any anomalies (i.e. deep or shallow). Resistivity / IP arrays are as sensitive to offline sources as they are to sources at an equivalent depth. An effective and economical way to overcome this drawback is to collect data in 2D, but invert in 3D.
The 3D resistivity voxel from the 3D inverted DC resistivity data are presented in figure 8 and a representative resistivity cross-section is also shown in figure 9. The inverted resistivity has a very large dynamic range from 1 to 30k ohm-meters. A logarithmic spaced colour bar was used from 5 to 10,000 ohm-m. The 3D plan and section in figures 8-9 highlight the high resistivity surficial cover (shown in pink) and deeper basement conductivity (blue) over the western survey area. However, the PLS discovery occurs in a region featuring more conductive cover found in the eastern part of the property (see Figure 8).
A deeper plan level (Figure 10) is used to display the basement resistivity to avoid the till effects. The basement resistivity showed a relatively wide conductive trend with numerous resistivity low ‘bright spots’.
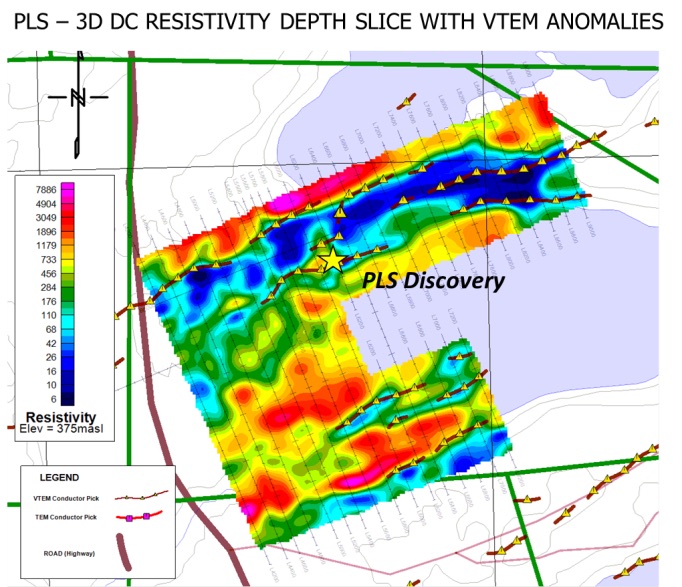
Figure 10: Basement resistivity plan with VTEM conductor axes, showing PLS discovery (after Bingham, 2016).
Analysis of the resistivity sections shows horizontal layers in the till which correspond to the Cretaceous conductive sediments. By taking a bench above the basement, and masking the high resistivity, the Cretaceous conductive sediments can be mapped with the resistivity (Figure 11). However, there is some contamination from the lake (fluids?). The conductive till mapped by the resistivity appears intermittent, but seemed to become much more apparent when another surveyed area was added (in late 2012), as shown in Figure 11.
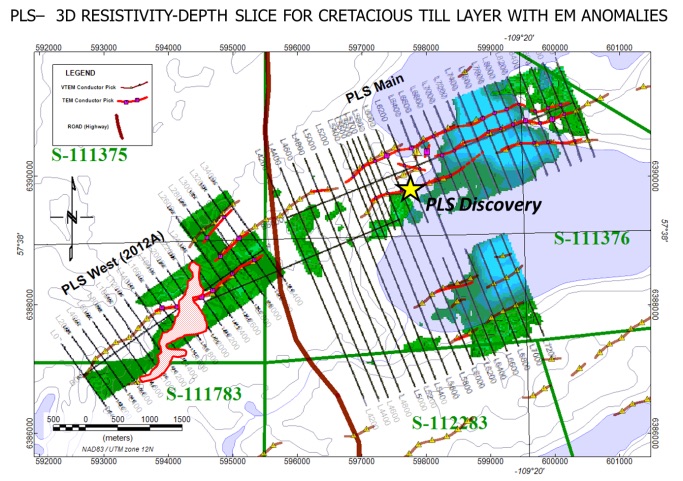
Figure 11: Resistivity Plan of Cretaceous Till layer with VTEM (brown) and ground TEM(red) conductors, showing PLS discover and outline of mineralized boulder till (red) from Figure 6 (after Bingham, 2016).
Ground EM Surveys
Initial MaxMin horizontal loop EM results encountered some difficulty seeing through conductive cretaceous sediments, and it was difficult to accurately locate complex conductors with the in-loop geometry of the VTEM survey (Bingham, 2016). Instead, a Small Moving Loop EM Design was used with a 20m square multiple turn loop. A SQUID sensor was used with a slingram separation of 150m at a frequency of 10 Hz. A total of 3.7 km of Small Moving Loop EM was surveyed using a high temperature SQUID sensor. The survey was conducted in December 2013 to February, 2014 by Discovery International Geophysics (Ross, 2015).
The low frequency EM enabled easy penetration through the conductive Cretaceous till. The increased sensitivity allowed for smaller transmitter loops and resulting improvement in survey efficiency (small loops = small crew = lower cost).
All the ground EM profiles were interpreted with Maxwell. (www.electromag.com.au). For moving loop surveys focused at the proper depth of basement conductors, the responses are clear with a good signal to noise ratio. Model studies have suggested that characteristic peaks (or troughs) of complex conductors in close proximity may be displaced from the actual conductor location. Some further modelling shows the peak displacements are also affected by the conductor dips, conductivity, transmitter-receiver spacing and the direction of the survey. These effects are reduced for smaller transmitter loops. The overall shape and character of the conductor z component response appears independent of the direction of the survey, but the peak displacements are not. This suggests it is necessary to generate models for each profile to determine the actual conductor locations.
The procedure for interpreting EM data is to create relatively simple models with Maxwell to determine dips, positions and relative conductivity of complex conductors. This helps to compensate for any geometric effects of complex conductor systems. Figure 12 shows a comparison of the MaxMin HLEM and Small Moving Loop TEM (MLEM) responses at PLS. Note the mineralized conductor is masked in the MaxMin response, but clearly visible in the Small Moving loop.
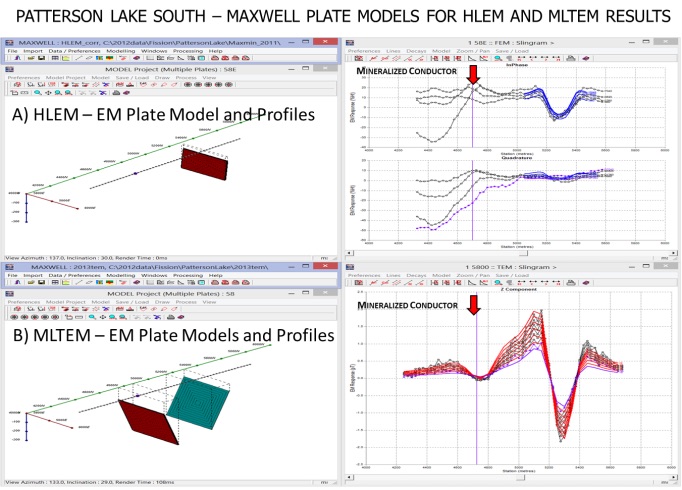
Figure 12: Comparison between MaxMin (top) versus Small Moving Loop (bottom) EM, highlighting (red arrow) MLEM anomaly missed in HLEM results (after Bingham, 2016) .
Figure 13 shows the location of interpreted plate conductors. The ground conductor interpretation is indicated by the red poly-lies, while the VTEM picks are brown with a yellow filled triangular symbol. Note there are a number of areas where the ground interpreted conductor location is offset from the VTEM conductor pick. There has been a very high success of conductor intersection with drilling based on the Maxwell interpretation of the ground EM.
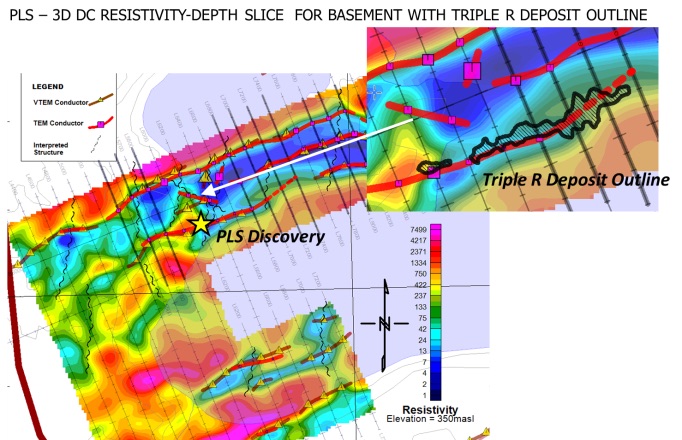
Figure 13: EM Interpretation overlain onto basement 3D resistivity-depth slice, and close-up in inset showing Triple-R deposit outline (after Bingham, 2016).
The Triple R deposit at Patterson Lake South shows excellent correlation with both an interpreted conductor and a resistivity low segment (Figure 13). Also significant is the evidence of cross structure seen in the resistivity at the west side of the displayed deposit outline. This also happens to be at the location of the discovery hole.
Miscellaneous Geology and Surveys
Among a number of follow up surveys, a radon in water survey detected anomalies associated with the mineralized deposit (Figure 14a). The longitudinal section in figure 14b illustrates the shallow nature of the Triple R deposit as of September 2016.
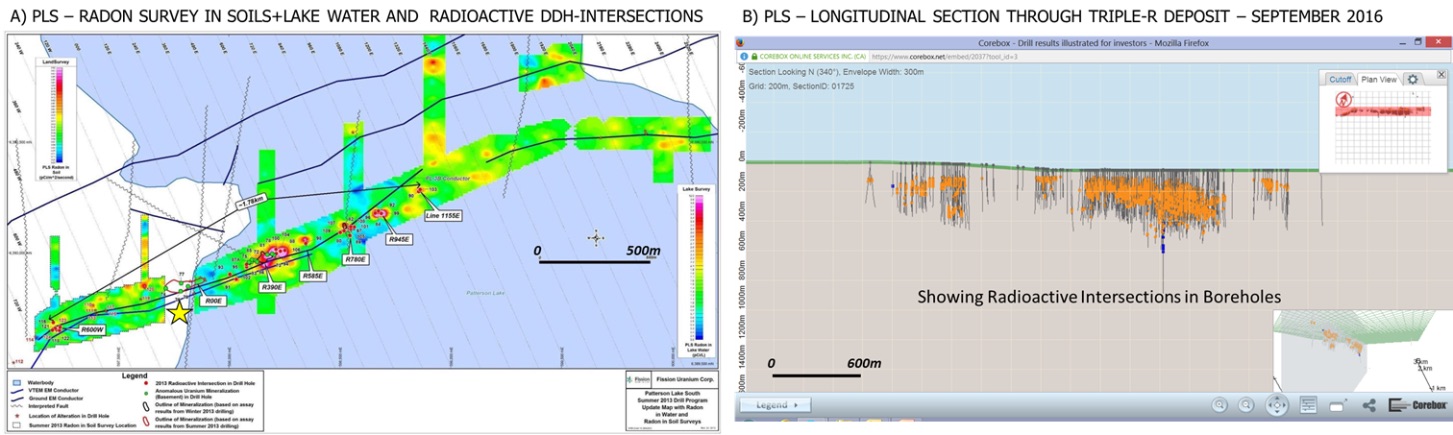
Figure 14: A) PLS radon soil and water survey results, highlighting anomalies correlated with anomalously radioactive drill-holes, from 2013; and B) Longitudinal section through Triple R uranium deposit, September, 2016 (after Bingham, 2016).
CONCLUSIONS
The PLS discovery is truly a combined team success effort using skills from management, research, geology and an array of geophysical techniques along with a lot of work by contractors and consultants. Some “outside the box” thinking and innovative practices using the scientific method has contributed to the successful detection of this new uranium deposit.
The Triple R deposit shows excellent correlation with a VTEM conductive ‘bright spot’, an interpreted conductor and a resistivity low segment. Also significant is the evidence of cross structure seen in the resistivity at the west side of the displayed deposit outline.
The continued success of the resource delineation and expansion is attributed to the dedicated Fission staff for all the required office and field tasks required to bring the project forward. From discovery to resource estimate, the Triple R deposit was achieved in just two years of drilling. On Sept, 14, 2015, the Triple R deposit at Patterson Lake South had an indicated Mineral Resources estimated at 81,111,000 lbs. U3O8 (2,011,000 tonnes @ 1.83% U3O8) (Ross, 2015).
ACKNOWLEDGEMENTS
The authors wish to thank to the management and directors of Fission Uranium Inc., as well as to all members of the technical team, consultants and staff contributing to this project.
REFERENCES
Ainsworth, G.P., McElroy, R., Ashley, R., and Ainsworth, B., 2012, A convenient joint venture – Patterson Lake South: presented at Saskatchewan Geological Open House 2012, Saskatchewan Ministry of the Economy, Saskatoon, Saskatchewan.
Bingham, D., 2016: Geophysics on Fission’s Patterson Lake South Uranium deposit: presented at BC Geophysics Society, BCGS, Fall 2016 symposium, Vancouver, BC.
Doerksen, G., Fielder, B., Iakovlev, I., Keller, D., Liskowich, M., Murphy, B., and Scott, C., 2011, Preliminary assessment technical report for the East and West zones Roughrider uranium project, Saskatchewan: Report (NI 43-101) prepared by SRK Consulting for Hathor Exploration Ltd., 267 p.
Fayek, M., Camacho, A., Beshears, C., Jiricka, D., and Halaburda, J., 2010, Two sources of uranium at the Millenium uranium deposit, Athabasca Basin, Saskatchewan, Canada: Geoconvention Conference, expanded abstracts, 5 p.
Jefferson, C.W., Thomas, D.J., Gandhi, S.S., Ramaekers, P., Delaney, G., Brisbin, D., Cutts, C., Quirt, D., Portella, P., and Olson, R.A., 2007, Unconformity associated uranium deposits of the Athabasca Basin, Saskatchewan and Alberta, in Goodfellow, W.D., ed., Mineral Deposits of Canada: A Synthesis of Major Deposit-Types, District Metallogeny, the Evolution of Geological Provinces, and Exploration Methods: Geological Association of Canada,
Mineral Deposits Division, Special Publication No. 5, p. 273-305.
McElroy, R., and Ashley, R., 2013, Patterson Lake South: High tech, unconventional, and contrarian: presented at Saskatchewan Geological Open House 2013, Saskatchewan Ministry of the Economy, Saskatoon, Saskatchewan.
McElroy, R., 2014, Fission Hits Best Off-Scale to Date: 53.47m Total Composite “Off-scale” (line 660E); Connects Another Two Zones: Fission Uranium Corp. press release, (March 24, 2104), 7 p.
Prikhodko, A., Morrison, E., Bagrianski, A., Kuzmin, P., Tishin, P., and Legault, J.M., 2010, Evolution of VTEM – technical solutions for effective exploration: 21ST International Geophysical Conference and Exhibition, ASEG, Extended Abstracts, 1-5.
Ross, D.A., 2015, Technical report on the Patterson Lake South Property, northern Saskatchewan, Canada: NI 43-101 report by RPA Inc. for Fission Uranium Corp., 140 p.
Witherly, K., R. Irvine, and E.B. Morrison, 2004, The Geotech VTEM time domain electromagnetic system. Society of Exploration Geophysicists, SEG, Expanded Abstracts, p. 1217–1221.