Presented at the ASEG-PESA 2015
For a PDF of this paper click here.
Summary
Airborne inductive induced polarization (AIIP™) effect has been widely recognized in airborne time domain EM system data. AIIP™ chargeability mapping opens new and exciting areas in mineral exploration for airborne time domain EM systems in the search for sulphides and clay minerals. An AIIP™ chargeability mapping tool based on CSIRO/AMIRA Airbeo is created for VTEM™ data, with examples from Mt Milligan, British Columbia, Canada and Tullah, Tasmania. Using the Cole-Cole frequency dependent resistivity, the tool examines the VTEM™ decay data spectrally and selects the decay associated with the lowest RMS error from a set of decays generated by varying chargeability m and time constant t within specific ranges, giving a constant frequency factor c, while the background resistivity is inverted. The parameter mo used to generate the decay is the AIIP™ apparent chargeability.
Key words:
Airborne Inductive Induced Polarization (AIIP™), chargeability mapping, negative transients, sulphides and clay minerals
Introduction
Negative transients observed in airborne time domain EM data (Smith and Klein, 1996 and Boyko et al. 2001) are attributed to airborne inductive induced polarization (AIIP™) effects. However, the absence of negative transients does not preclude the presence of AIP, because of the IP effect takes finite time to build up or the IP effect may be obscured by the conductive ground (Kratzer and Macnae, 2012). In mineral exploration, near-surface sources of AIIP™ are clays through membrane polarization (electrical energy stored at boundary layer) and most metallic sulphides and graphite through electrode polarization (electrical charges accumulated through electrochemical diffusion at ionic-electronic conduction interfaces).
The helicopter-borne Versatile Time Domain Electromagnetic (VTEM™) (Witherly et al., 2004) is a geophysical data acquisition system with in-loop transmitter receiver configuration. It has been shown by Smith and West (1989) that the in-loop EM system is optimally configured to excite a unique AIIP™ response, including negative transients in mid to late times over resistive grounds, from bodies of modest chargeability.
The widely used theory to explain the IP effect is the empirical Cole-Cole relaxation model (Cole and Cole, 1941) for frequency dependent resistivity ρ(ω),
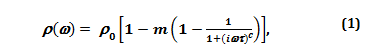
where is the low frequency asymptotic resistivity, m is the chargeability, t is the “time constant”, w=2πf, and c is the frequency factor. In order to distinguish m and t used in other contexts, such as ground DCIP chargeability and airborne EM time constant as a measure of the decay rate, we call m and t as the AIIP™ chargeability and time constant henceforth.
The extraction of AIIP™ chargeability m using the Cole-Cole formulation from VTEM™ data had been done by Kratzer and Macnae (2012).
An AIIP™ chargeability mapping tool based on CSIRO/AMIRA Airbeo has been developed for VTEM™ system and tested on VTEM™ data from Mt Milligan, British Columbia, Canada, and Tullah, Tasmania.
Methodology
Airbeo (CISRO/AMIRA)
Airbeo, developed by Commonwealth Scientific and Industrial Research Organization (CSIRO), is an inversion program which fits a layered-earth model to frequency or time domain electromagnetic data. Airbeo source codes were released to the public by Australian Mineral Industries Research Association (AMIRA) International Limited as project P223F in 2010.
The inversion methodologies used by Airbeo are fully described in Raiche et al. (1985) and Raiche (1999). The complex, frequency dependent Cole-Cole resistivity is used in Airbeo in order to model the IP effect. However, Airbeo only inverts for layer resistivity and thickness of a layered-earth model, but not the AIIP™ parameters m, t and c.
Search for m and t using AIRBEO inversions
For a given VTEM™ Z-component voltage decay, the algorithm to find the best m and t within a specific resistivity range of a uniform half-space consists of two stages.
In the first stage, for a given VTEM™ decay, Airbeo inversions will be run at 5×5 mesh covering user specified ranges of (m,t). If a small area in (m,t) plane with the minimum root-mean-square (RMS) error within user specified resistivity range is found, the search will proceed to the second stage. Otherwise, the VTEM™ decay will be ignored.
In the second stage, the small area is searched again by the 5×5 mesh, and the point (mo, to) with the lowest RMS error is found. Because of the half-space model, the chargeability parameter extracted can best be described as the AIIP™ apparent chargeability.
This method is akin to examining the VTEM™ data spectrally and selecting the best decay from a set of decays generated by varying chargeability m and time constant t, which are selected as the free search parameters because they are the two best discriminators for different types of mineralization (Pelton et al., 1978). A by-product of the Airbeo inversions is the inverted AIIP apparent half-space resistivity.
AIIP™ Chargeability Mapping Results
Chargeability Mapping of Synthetic VTEM™ Data
To test the AIIP™ mapping tool, four lines of synthetic VTEM™ data for a 200m by 200m chargeable horizontal thin plate, placed 20m below surface in a resistive host were computed using LeroiAir (CSIRO/AMIRA). The synthetic VTEM™ data consist of thirty-one (31) channels, in times after current turn-off from 0.09 to 7.56 milliseconds. The Cole-Cole parameters for the thin plate in forward computation, and the inverted half-space AIIP apparent chargeability and resistivity data are shown in Figure 1.
The VTEM™ profiles from L4080, computed from the original thin plate, from the inverted half-space model, and chargeability and apparent resistivity profiles are displayed in Figure 2. The AIIP effect from the thin plate is manifested in VTEM™ voltage data as reduction in amplitude.
AIIP™ Chargeability Mapping of VTEM™ Field Data
Mt. Milligan, British Columbia, Canada
Mt. Milligan Cu-Au deposit is located within Early Mesozoic Quesnel Terrane that hosts a number of Cu-Au porphyry deposits, Oldenburg et al, 1997. The Mt. Milligan intrusive complex consists dominantly of monzonitic rocks, including the MBX and Southern Star (SS) zones, all which host mineralization at Mt. Milligan (Figure 3). Mineralization in both zones consists of pyrite, chalcopyrite and magnetite with bornite localized along intrusive-volcanic contacts (Terrane Minerals Corp. NI 43-101, 2007). Copper-gold mineralization is primarily associated with potassic alteration with both copper grade and alteration intensity decreasing outwards from the monzonite stocks. Pyrite content increases dramatically outward from the stocks where it occurs in association with propylitic alteration, which forms a halo around the potassic-altered rocks.
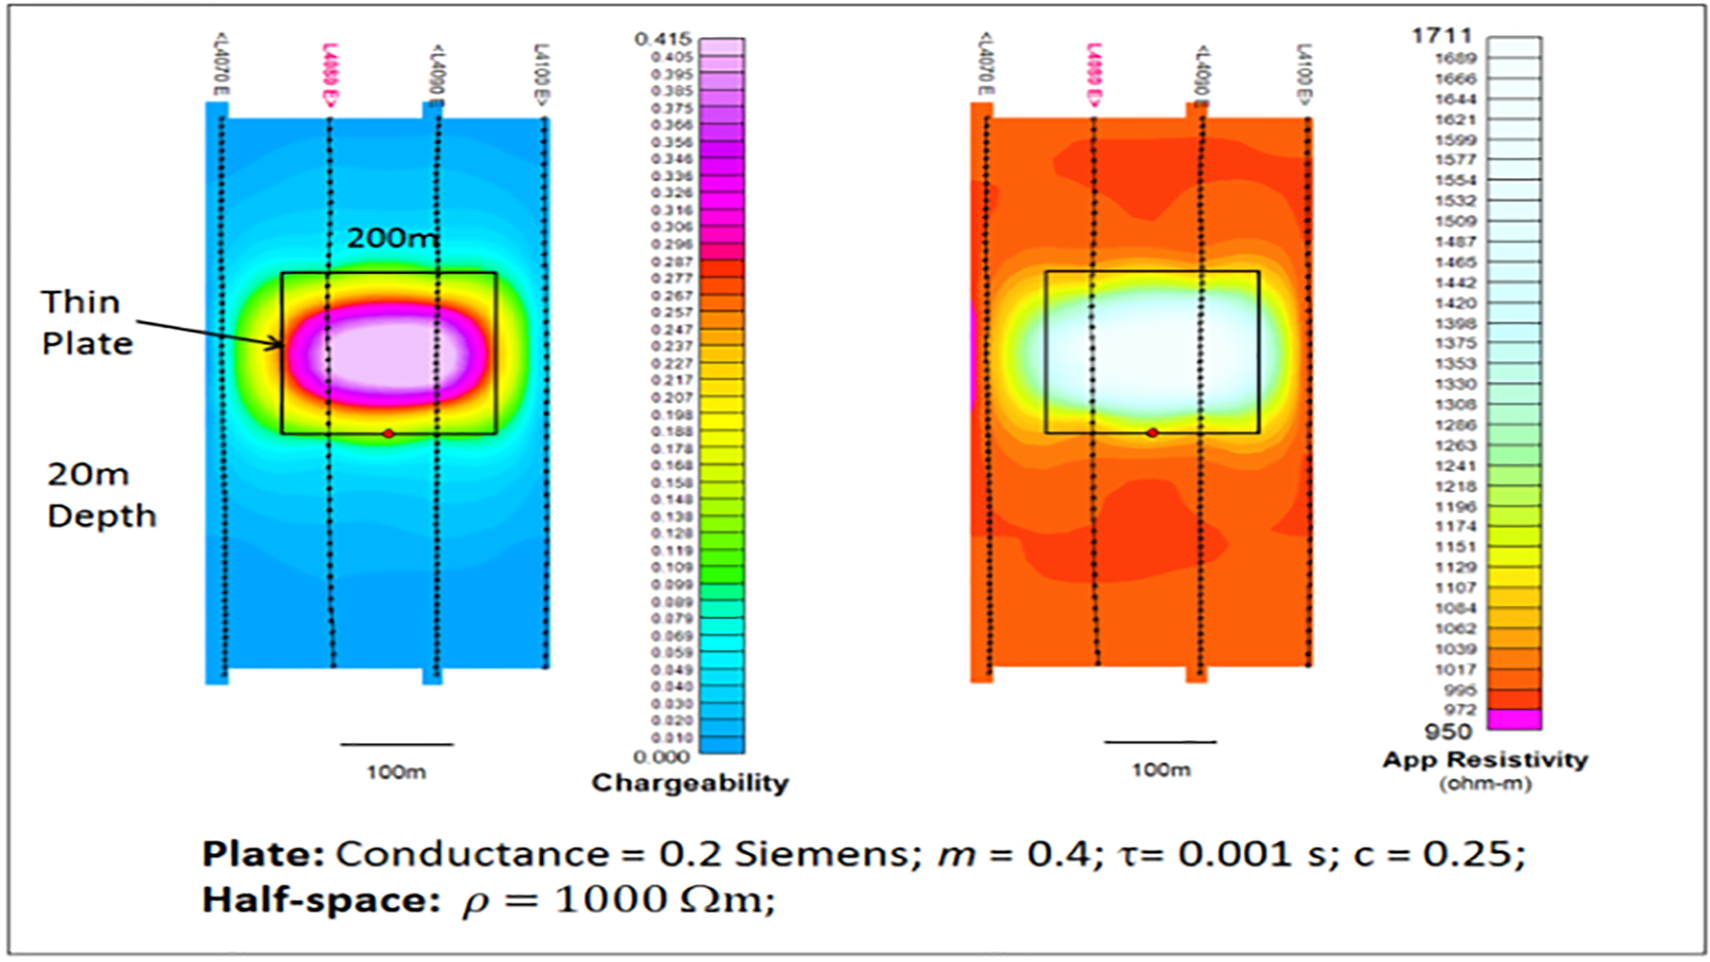
Figure 1: AIIP™ apparent chargeability and resistivity maps of a synthetic chargeable thin plate. L4080 is shown in red.
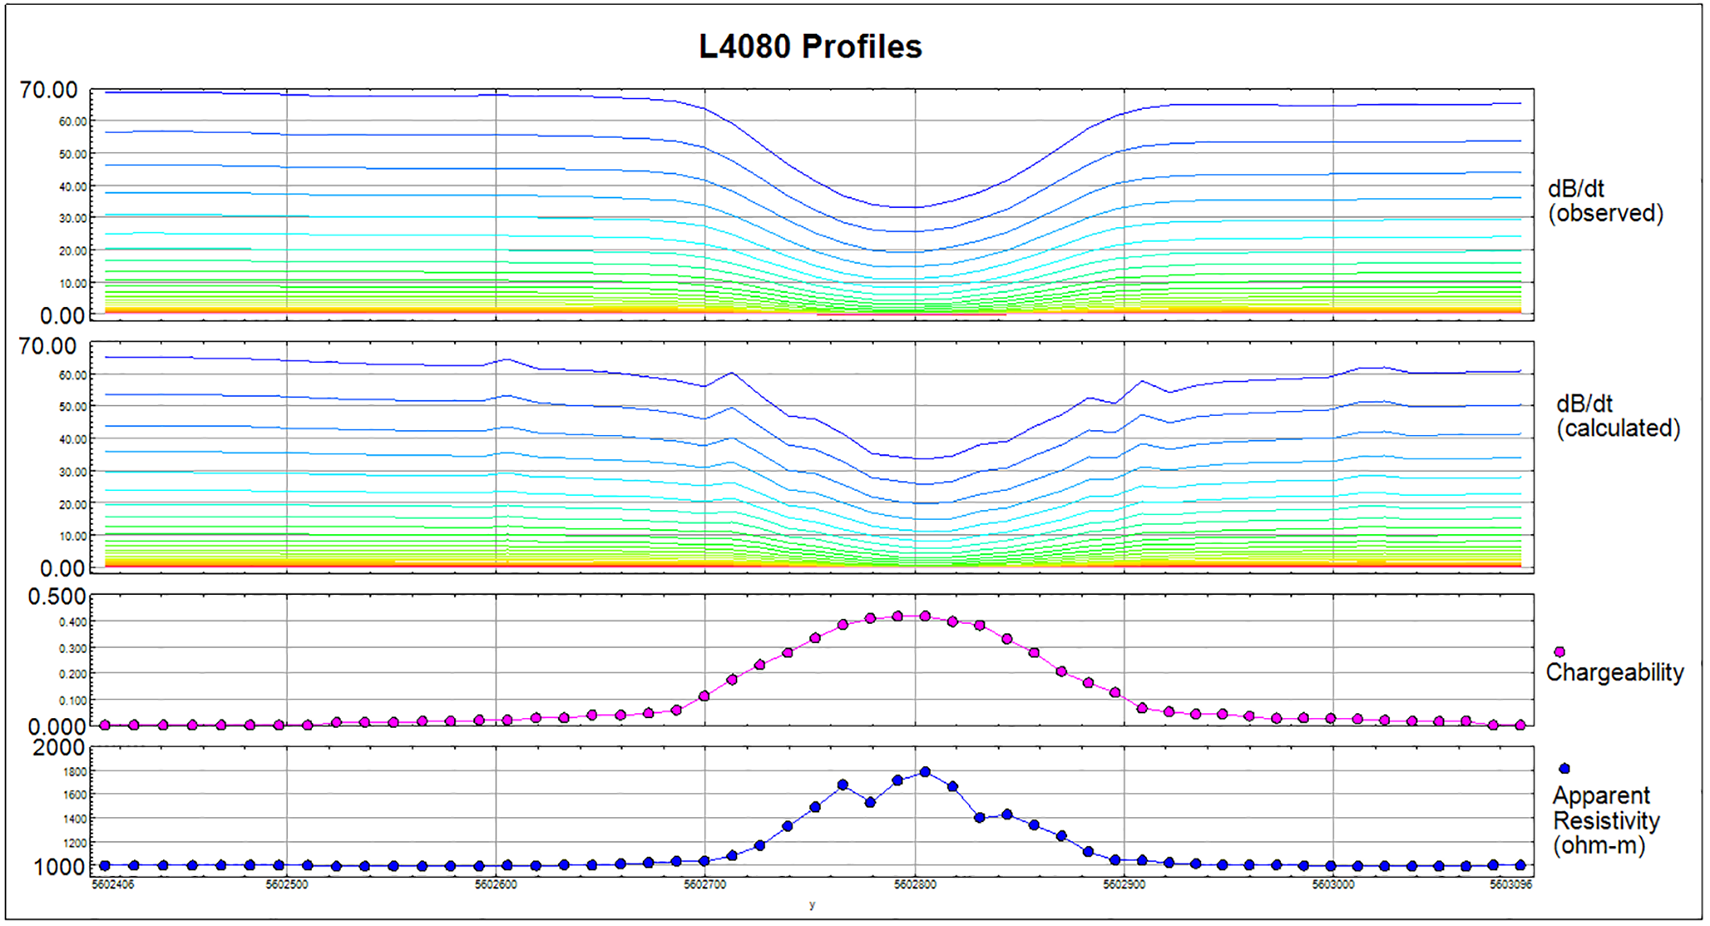
Figure 2: AIIP™ apparent chargeability and resistivity profile data from L4080.
Helicopter-borne VTEM™ surveys, including a small survey over Mt. Milligan, were carried out from July 29th to November 1st, 2007, on behalf of GeoscienceBC as part of the QUEST project in central British Columbia. The data were released to the public by GeoscienceBC and can be downloaded here.
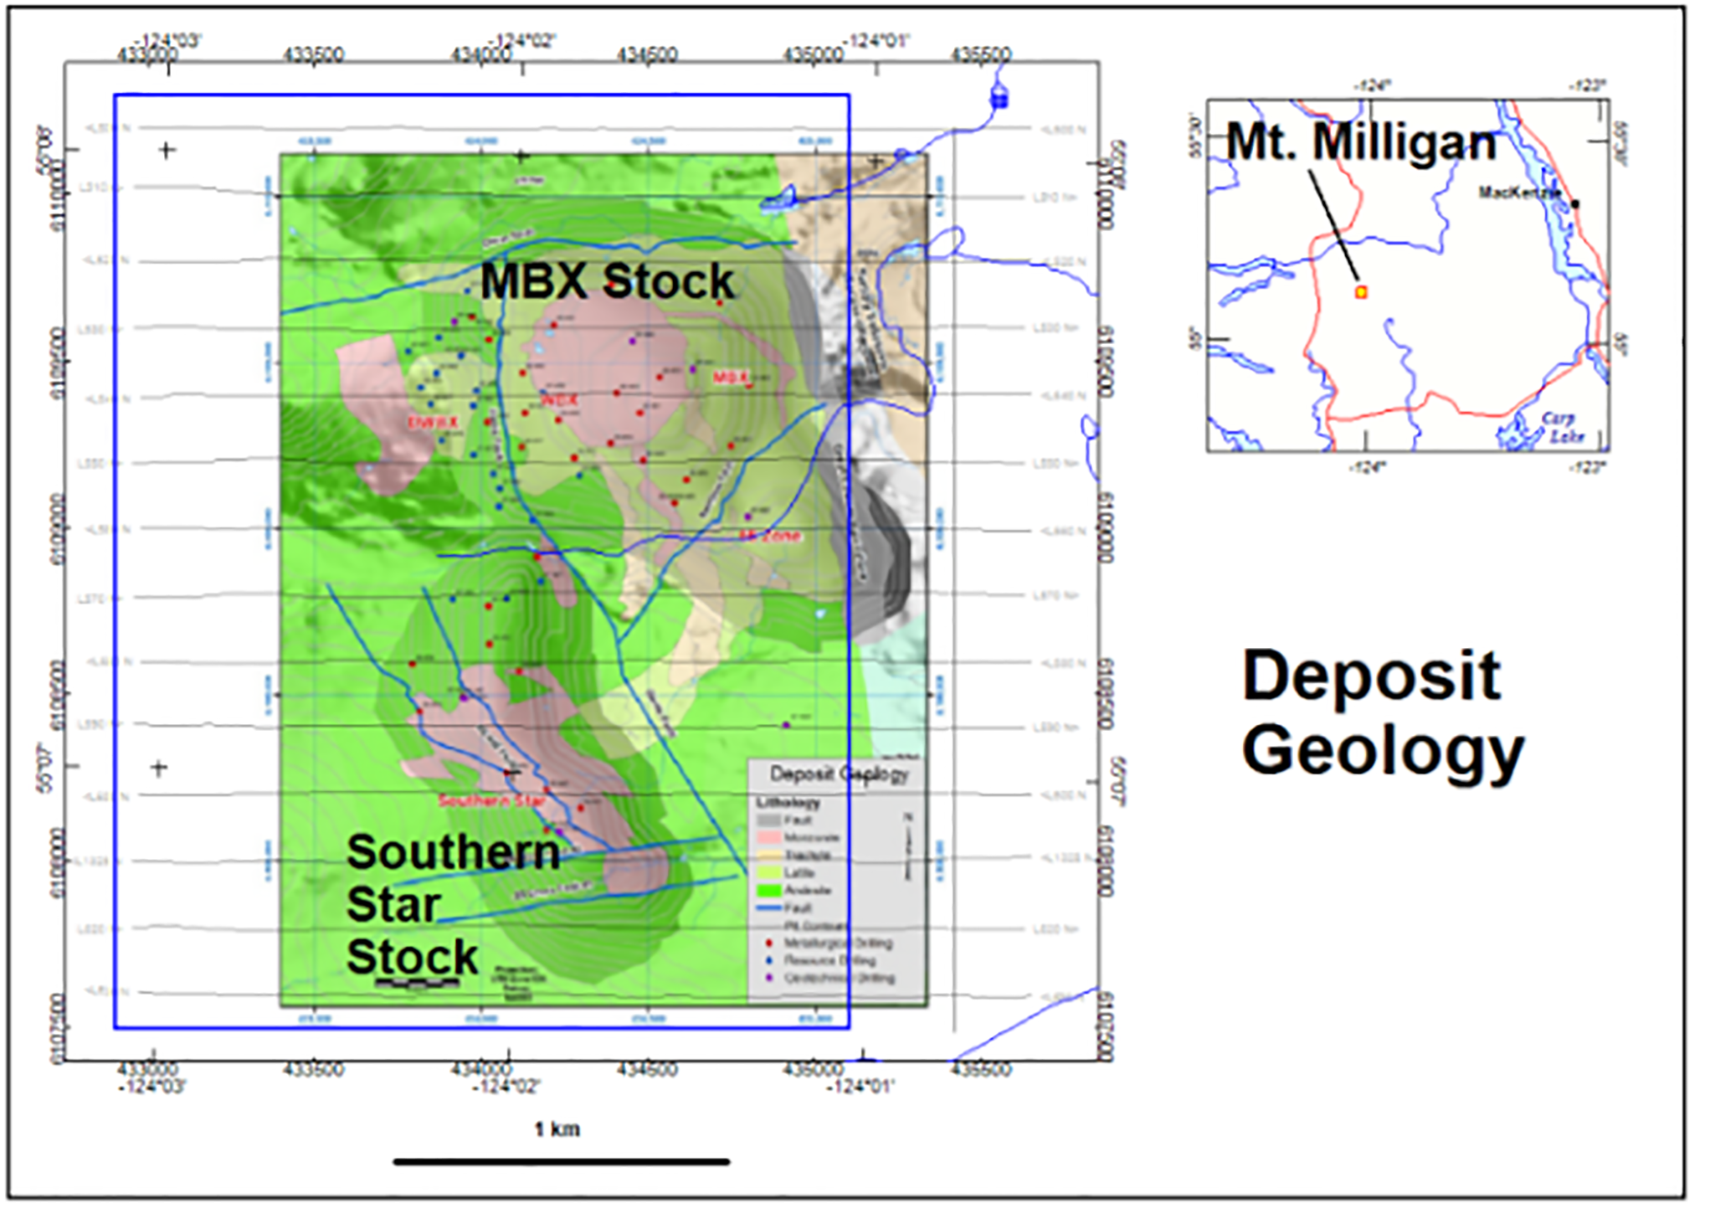
Figure 3: Mt. Milligan geology.
VTEM™ Z-component data, from 0.091 to 10.126 milliseconds in off-times, were processed to recover the AIP apparent chargeability. Very weak negative transients above noise level are observed in the VTEM™ data over two locations from survey lines near DWBX and SS. The inverted Cole-Cole chargeabilities are shown in Figure 4. Weak chargeabilities can be seen along the east and west flanks of the MBX stock, especially over DWBX, and in a small area southwest of SS stock. For comparison, the chargeability slice at 40m depth, created by UBC 3D airborne IP inversion of the same VTEM™ data from Kang et al., 2014, is also shown.
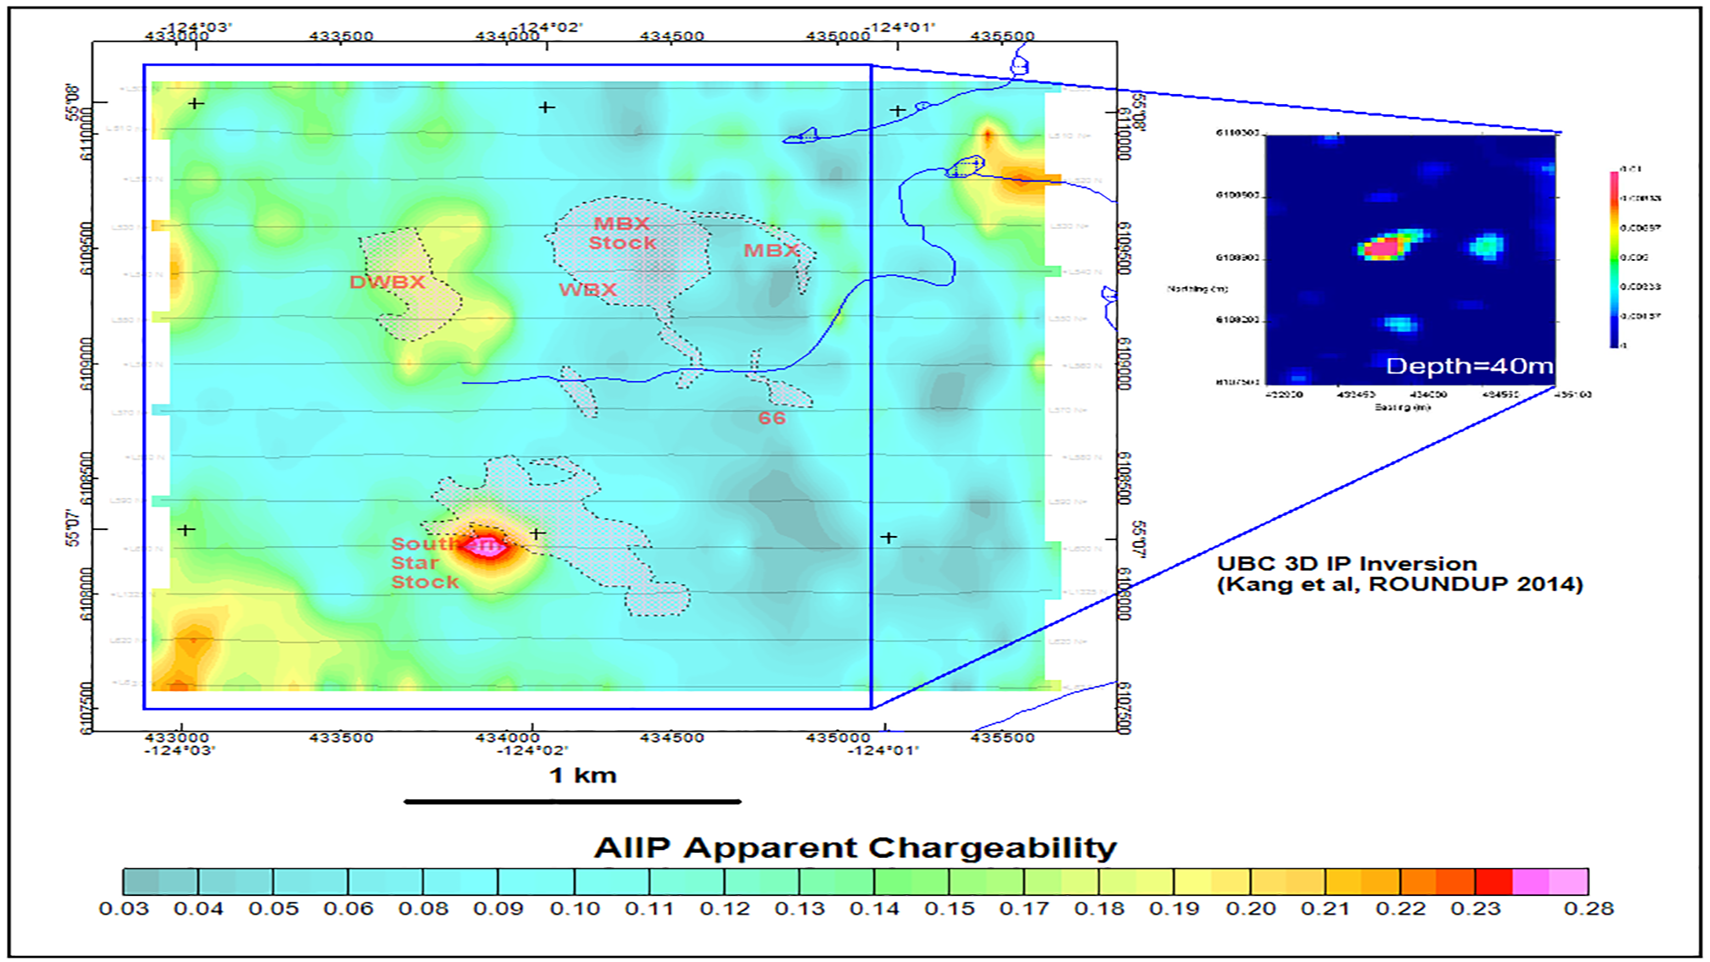
Figure 4: Mt. Milligan AIIP apparent chargeability.
The inverted AIIP™ apparent resistivity of Mt. Milligan area is shown in Figure 5. A relatively low resistivity halo can be seen surrounding the SS stock.
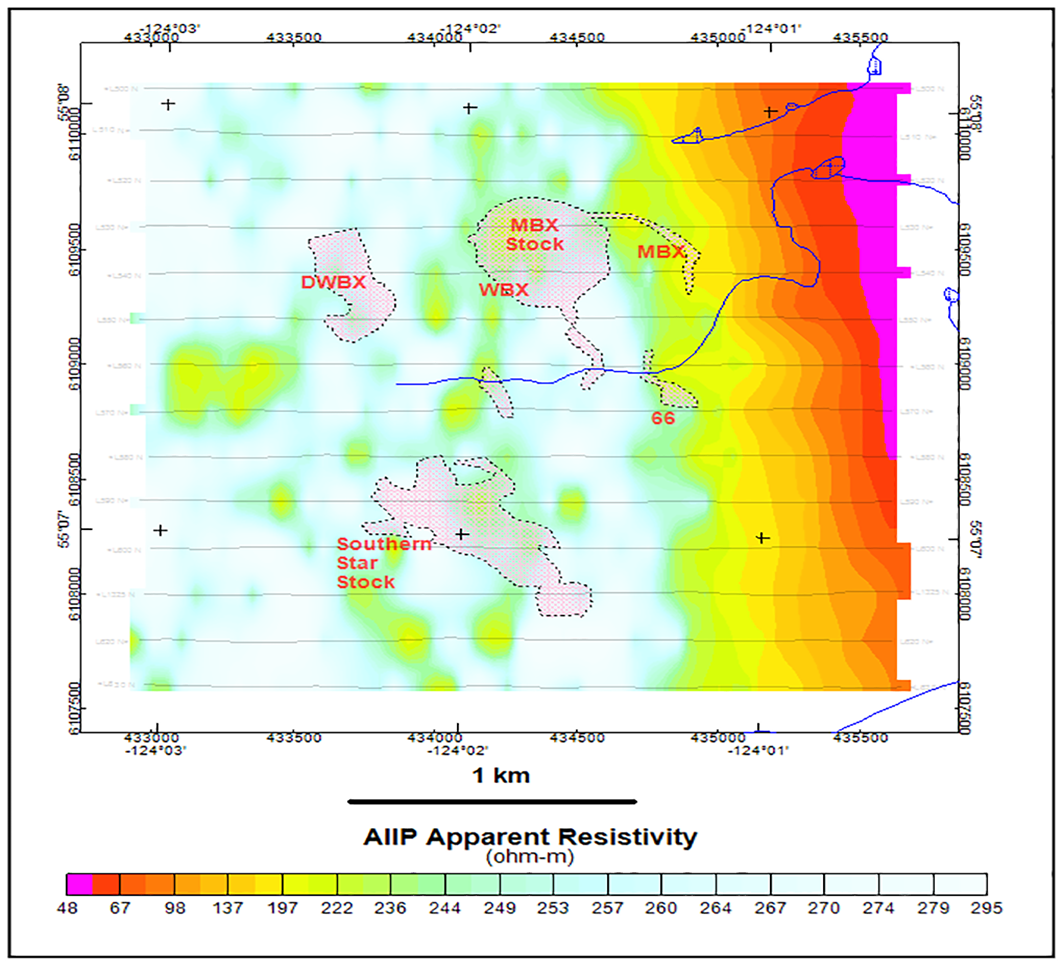
Figure 5: Mt. Milligan AIIP™ apparent resistivity, displayed in equal-area colour scheme.
Tullah, Tasmania
The most important metallogenic event in Tasmania occurred in Middle Cambrian as the post collisional proximal submarine volcanism and the deposition of the Mount Read Volcanics (MRV) and associated world-class deposits (Seymour et al., 2007).
The study area is located near Tullah, northwest Tasmania. The western half of the study area is covered by Late Cambrian quartz sandstone, Ordovician limestone and Quaternary alluvium and marine sediments (Figure 6). The eastern half is dominated by the Middle Cambrian volcanics (Corbett, 2002).
The Mount Lyell, located south of the study area, hosts 311 Mt 0.97% Cu and 0.31 g/t Au disseminated chalcopyrite-pyrite ore bodies in alteration assemblages of mainly quartz-sericite or quartz-chlorite-sericite.
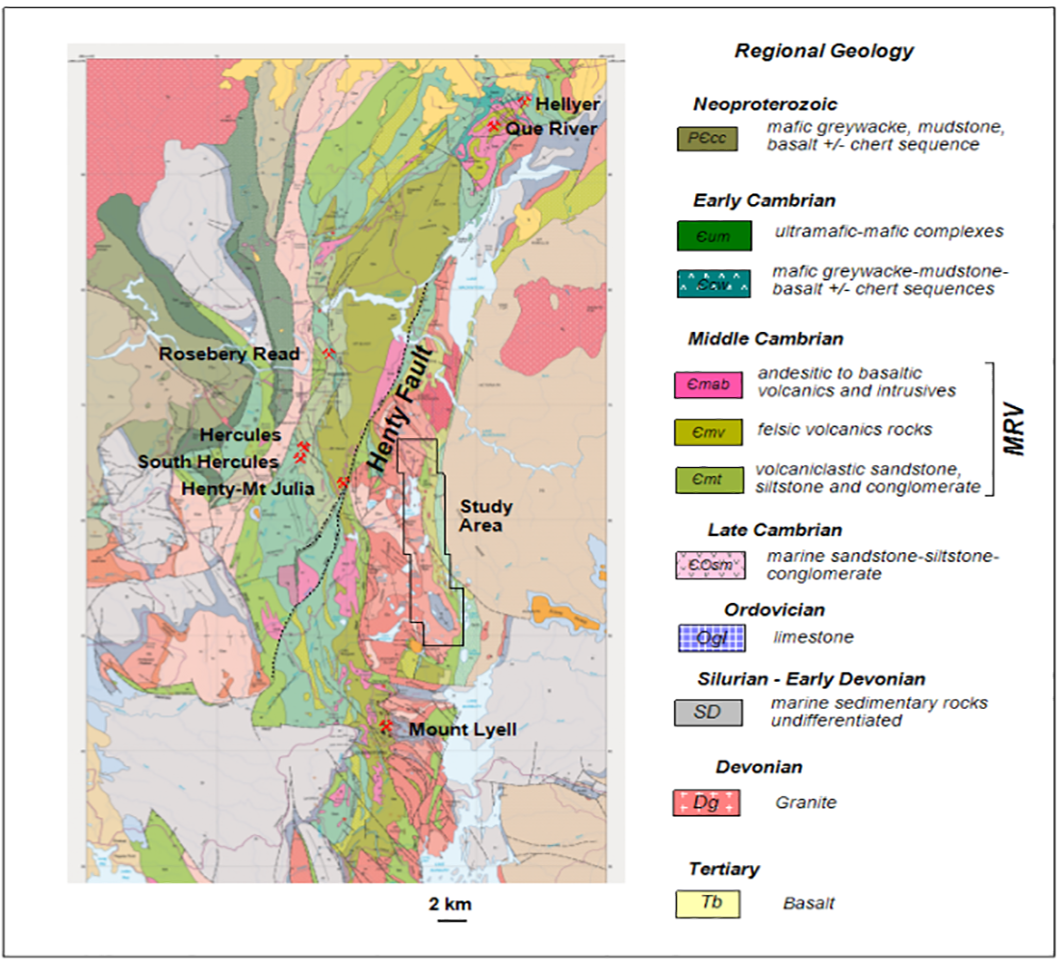
Figure 6: Regional geology of study area, Tullah, Tasmania.
From December 2012 to February 2013, Geotech carried out a helicopter-borne geophysical survey over the study area. Numerous negative transients were observed in the VTEM™ voltage data (Figure 7). The Z-component data, from 0.216 to 7.56 milliseconds in off-times, were processed for AIIP™ apparent chargeability.
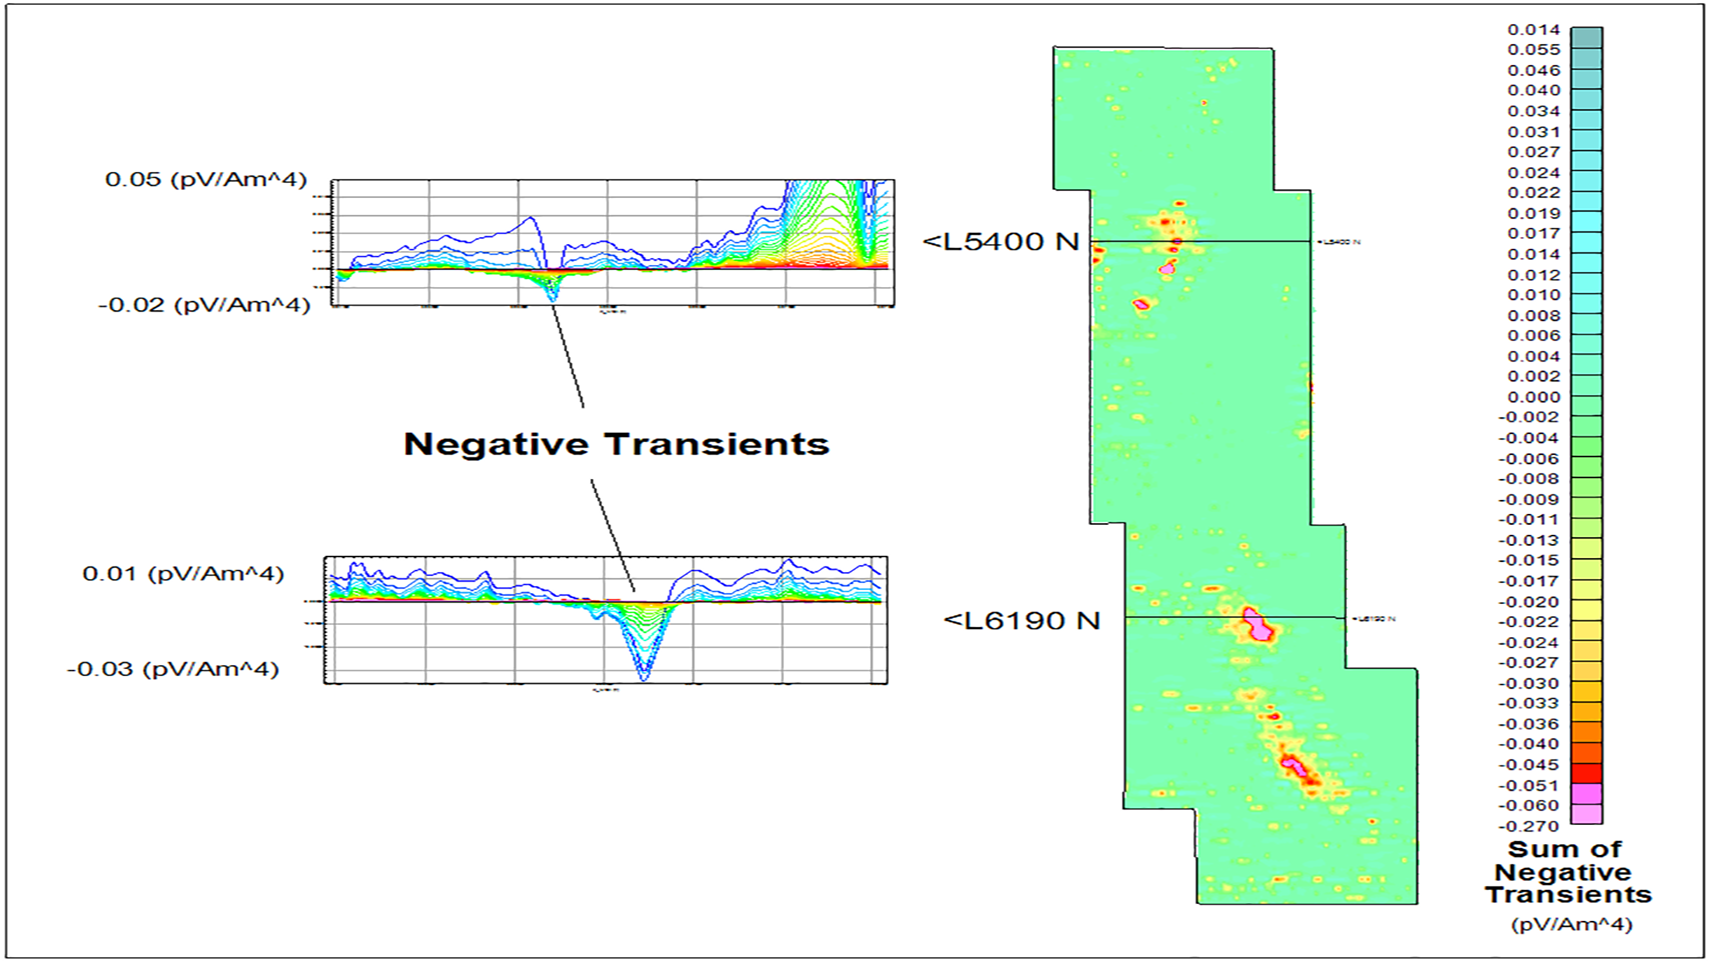
Figure 7: Sum of negative transients and two VTEM™ profiles, Tullah, Tasmania.
The amplitudes of VTEM™ data over resistive grounds are relatively now. If the number of decay data in the off-time windows is below a user specified noise threshold, then the decay will be skipped. The calculated AIIP™ apparent chargeability and resistivity of the study area are shown in Figure 8. The chargeability map follows the sum of negative transients closely. The sources of the AIIP™ could be clays or sulphides, or a combination of both.
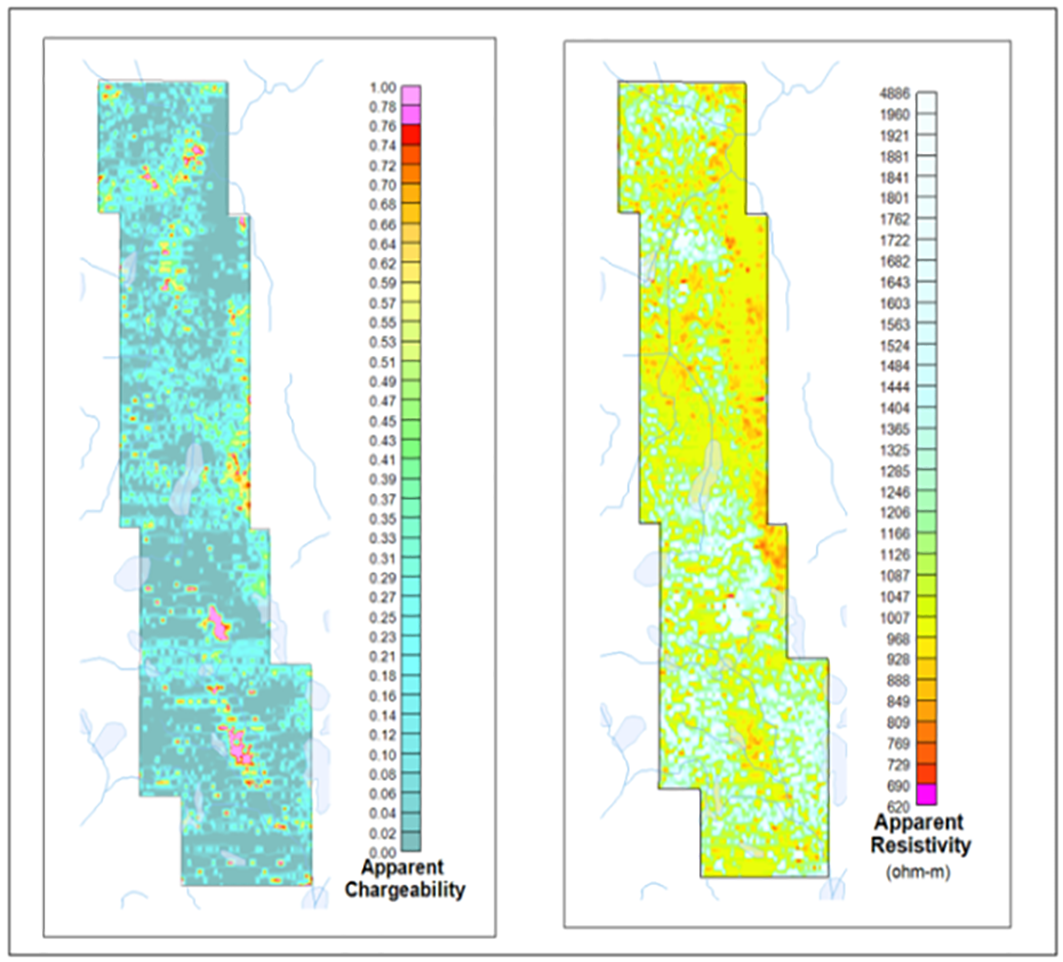
Figure 8: AIIP™ apparent chargeability and resistivity, Tullah, Tasmania.
Discussion
For real VTEM™ data contaminated with noise and geology different from uniform half-space, two constraints, a restricted range of inverted apparent resistivity and the use of proper frequency factor, are required in order to for AIIP™ mapping tool to generate geologically meaningful outputs.
The range of acceptable inverted AIIP™ apparent resistivity can be estimated by other means and one of them is the Resistivity Depth Imaging (RDI) technique based on the transformation scheme described by Meju (1998).
Extensive discussions on frequency factor are provided in Pelton et al. (1978). For resistive ground, frequency factor of 0.25 should be used. For conductive ground where inductive response dominates, frequency factor of 1.0 must be used.
Conclusion
An AIIP™ mapping tool based on Airbeo (CSIRO/AMIRA) has been created for the in-loop VTEM™ system, which is optimally configured to excite a unique AIIP™ response, including negative transients in mid to late times over resistive grounds from bodies of modest chargeability. Test results on both synthetic and field VTEM™ data prove that the AIIP™ mapping tool can work, if the inverted resistivity range is restricted and the proper frequency factor is used. The derived AIIP™ apparent chargeability map provides additional information for the interpretation of VTEM™ data.
Acknowledgments
We would like to thank Yunnan Tin Australia Pty Ltd. for permission to use the VTEM™ data from an area near Tullah, Tasmania for this study. This work is not possible without the source codes from CSIRO/AMIRA project P223F.
References
Boyko, W., Paterson, N.R. and Kwan, K., 2001, AeroTEM characteristic and field results: The Leading Edge, 20, 1130-1138.
Cole, K. and Cole R., 1941, Dispersion and absorption in dielectrics, Part I. Alternating current characteristics: Journal of Chemical Physics, 9, 341-351.
Corbett, K.D., 2002: Updating the geology of the Mount Read Volcanics belt Western Tasmanian Regional Minerals Program Mount Read Volcanics Compilation: Tasmanian Geological Survey Record 2002/19, Mineral Resources Tasmania, Department of Infrastructure, Energy and Resources, Tasmania.
Kang, S., Oldenburg D.W., Marchant, D., Yang, D. and Haber, E., 2014, On recovering IP information from airborne EM data: presented at Geotech airborne geophysics workshop, AME BC Mineral Exploration Roundup 2014 Conference.
Kratzer, Terence and Macnae, James C., 2012, Induced polarization in airborne EM: Geophysics, 77, E317-327.
Meju, Maxwell A., 1998, A simple method of transient electromagnetic data analysis: Geophysics, 63, 405-410.
Oldenburg, Douglas W., Li, Yaoguo and Ellis, Robert G., 1997, Inversion of geophysical data over a copper gold porphyry deposit: a case history for Mt. Milligan: Geophysics, 62, 1419-1431.
Pelton, W.H., Ward, S.H., Hallof, P.G., Sill, W.R., and Nelson, P.H., 1978, Mineral discrimination and removal of inductive coupling with multi-frequency IP: Geophysics, 43, 588–609.
Raiche, A., 1999, A flow‐through Hankel transform technique for rapid, accurate Green’s function formulation: Radio Science, 34, 549‐555.
Raiche, A.P., Jupp, D.L.B., Rutter H. and Vozoff, K., 1985, The joint use of coincident loop transient electromagnetic and Schlumberger sounding to resolve layered structures: Geophysics, 50, 1618-1627.
Smith, R. S. and J. Klein, 1996, A special circumstance of airborne induced polarization measurements: Geophysics, 61, 66–73.
Smith, R. S. and West, G.F., 1989, Field examples of negative coincident-loop transient electromagnetic responses modeled with polarizable half-planes: Geophysics, 54, 1491-1498.
Seymour, D.B., Green, G.R. and Calver, C.R., 2007: The Geology and Mineral Deposits of Tasmania: A summary: Geological Survey Bulletin, 72.
Witherly, K., Irvine, R., and Morrison, E.B., 2004, The Geotech VTEM time domain electromagnetic system: SEG, Expanded Abstracts, 1217-1221.
Welhener, H., Labrenz, D., and Huang, J., 2007, Mt. Milligan Project Resource Report, Omenica Mining District: technical report (NI43-101) prepared for Terrane Metals Corp., by Independent Mining Consultants, Inc., 113 p.