Presented at ASEG, July 2010
For a PDF of this paper click here.
Summary
A ZTEM™ (Z-Tipper Axis Electromagnetic) airborne AFMAG survey was conducted over the Reese River Test Block, situated in central Nevada in August, 2009. The Reese River prospect is a “blind” geothermal resource that lacks surface characteristics such as hot springs. A number of geophysical surveys have been conducted at the prospect, including seismic, gravity, magnetotelluric (MT) and radiometric surveys. Resistivity methods, such as MT, are typically used to map structure, lithology and alteration, particularly the smectite-zeolite zones which form a low resistivity cap over the outer margins of the higher resistive reservoir at depth. The ZTEM survey at Reese River has overflown lines previously surveyed using MT for comparison purposes.
The ZTEM results appear to correlate very well with previous magnetotelluric results and the known geology, in particular the presence of both major and secondary fault structures and geologic contacts. 2D inversions of the airborne ZTEM appear to agree very well with the inversions obtained from ground MT, except in areas of pronounced 3D behaviour, where the 2D assumption is no longer valid.
Key words: Airborne, electromagnetic, AFMAG, magnetotelluric, resistivity, inversion, geothermal.
Introduction
Geophysics, in particular EM methods, have been used for geothermal exploration for decades. Historically, DC-Resistivity and TEM sounding methods have been used to map the electric properties of the geology at depth. More recently ground MT has become the preferred electrical method, providing good depths of investigation and resolution but at a very high cost. ZTEM represents a new airborne technology capable of providing cost-effective mapping of large areas whilst detailing the electrical properties of the geological structures at depths.
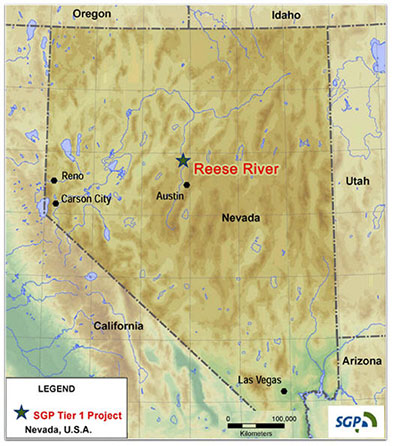
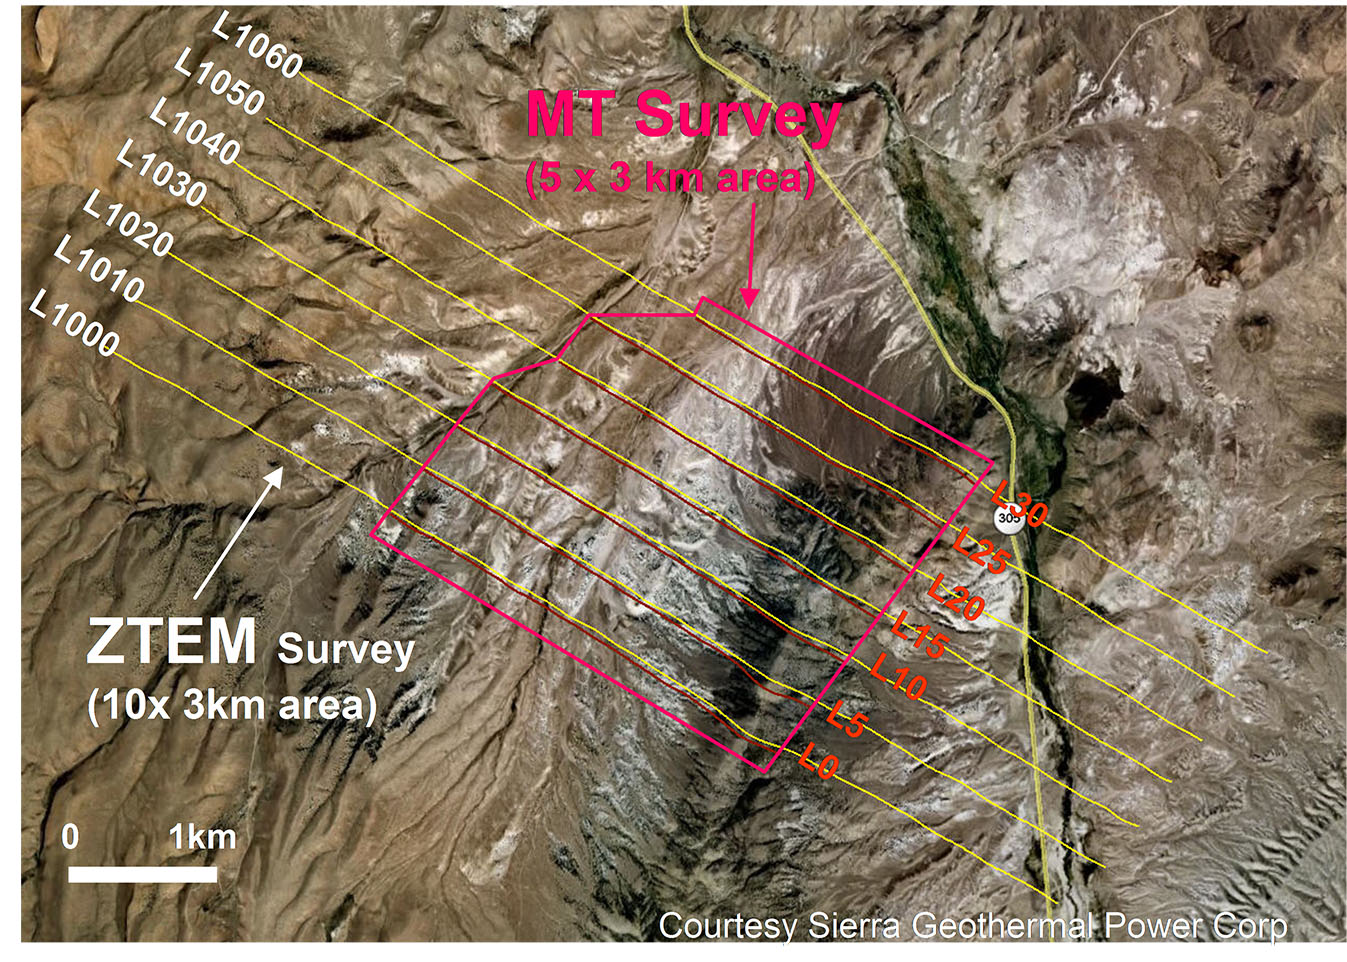
A ZTEM (Z-Tipper Axis Electromagnetic; Lo and Zang., 2008; Lo et al., 2009) survey was conducted over the Reese River Test Block (Figure 2), belonging to Sierra Geothermal Power Corp. (Vancouver, BC) and situated in Lander County, central Nevada. The survey comprised airborne Tipper AFMAG (Ward, 1959; Labson et al., 1985) measurements using the ZTEM system (Figure 1), as well as aeromagnetics using a caesium magnetometer. The survey consisted of seven (7) approximately 10 km long, Northwest-Southeast oriented flight lines, totalling 70 line-km, that were obtained at nominal 500m line spacing over an approximately 3 x 10km area (yellow lines in Figure 3).
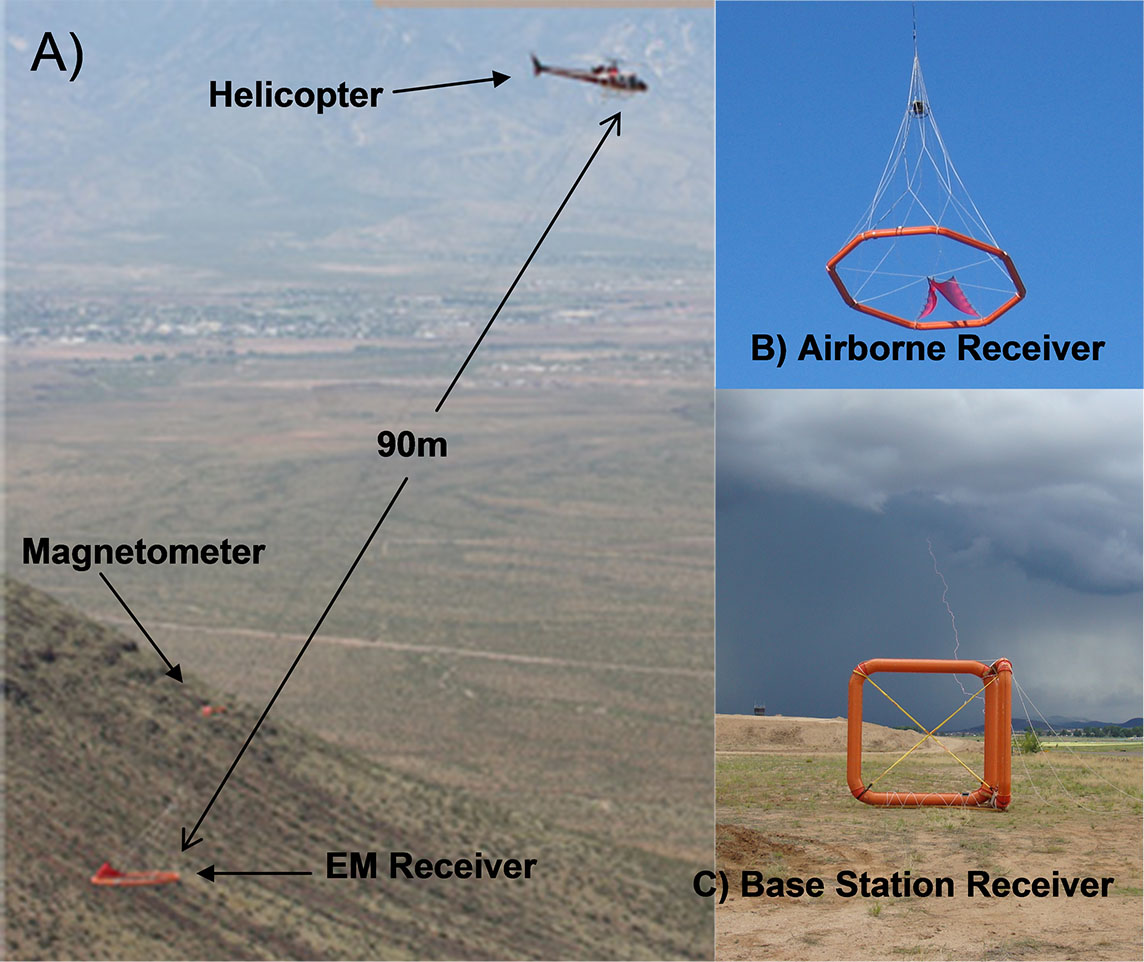
Figure 1: A) ZTEM helicopter EM system in flight, showing Hz receiver Coil and magnetic sensor; B) Hz receiver coil, C) Hx-Hy base station coils located at a remote site adjacent to survey area.
The Z-axis tipper measurements of the vertical (Z) component were obtained using Geotech’s patented ZTEM induction aircoil system (Figure 1), suspended at approximately 100m elevation above ground level. The vertical component data (Hz) were then ratioed to fixed horizontal field measurements (Hx-Hy) obtained using identical reference coils, that were oriented in the in-line (X) and cross-line (Y) directions, in order to obtain the tipper functions Z/X and Z/Y. The In-Phase and Quadrature components ZTEM field ratio data were obtained, using Fourier-based, digital signal processing analyses, at 6 frequencies, between 30Hz and 720Hz. The magnetometer was a Geometrics optically pumped caesium vapour magnetic field sensor, towed at approximately 120m above ground level.
Geologic Setting
The Reese River property is located in central Nevada, 45 km north of Austin and 300 km east of Reno, Nevada (Figure 2). The property is geologically located within a basinal formation west of the Shoshone Mountain Range, within a region of NE trending faults known as the Humboldt structural zone and also in an area of elevated heat flow known as the Battle Mountain High (Witter et al, 2009).
The region contains several other geothermal areas (i.e., Dixie Valley and Beowawe) but the Reese River prospect is a “blind” geothermal resource that lacks the typical geothermal surface characteristics, such as hot springs or hydrothermal deposits. It lies completely buried and was discovered by chance as a result of hot water being encountered in exploration drill holes for Uranium. Shallow drilling from the 1970’s to 1980’s has mapped a 10x3km wide geothermal anomaly. More recent deep drilling has confirmed commercial grade temperatures reaching ~150OC (Witter et al., 2009).
Previous Geophysics
The Reese River Geothermal play has been host to a number of geophysical surveys, including seismic, gravity, magneto-telluric and radiometric surveys. The seismic survey was less effective than anticipated in identifying subsurface geologic structure. The gravity survey has provided preliminary information regarding depth-to-bedrock and subsurface structures at the Reese River prospect. Temperature data identified a large thermal anomaly located in the south central part of the survey area (Figure 3).
A small ground MT survey, consisting of 7 lines for a total of 30 line km, was conducted in 2008. The lines are oriented North-West to South-East (red Lines in Figure 3) roughly perpendicular to the known geology. Dipole spacing was 200m in the x-direction and 100m in the y-direction. The operating frequency bandwidth of the MT survey was 0.001 to 1000 Hz giving a depth of investigation of 1.5 to 2.0 km.
The ground MT survey covered the main areas of interest over the site. The purpose for running the MT lines was to map the smectite-zeolite zone which forms a low resistivity cap over the outer margins of the reservoir while observing higher resistivity below.
The MT data at Reese River indicate the presence of a widespread, shallow, low-resistivity zone that may be a clay-cap overlying a warm (~70 °C) tabular geothermal aquifer at ~150 m depth. The MT data also resolve deeper low-resistivity zones that likely correspond to argillic (clay) alteration. Zones of high resistivity at depth are thought to correspond to limestone units that also outcrop at the surface. Overall, observation of the 2D resistivity profiles suggests that the resistivity variations at Reese River have a 3 dimensional aspect to them which is difficult to resolve with 2D profiles (Witter et al., 2009).
Synthesis of Exploration Data
Figure 4 shows an MT resistivity profile with the subsurface structure (estimated from gravity, borehole and geologic data) overlain. Subsurface temperature distributions, constrained by temperature gradient well measurements, have also been added. The subsurface distribution of rock types has been constrained near drillholes based on geological well log data and inferred from regional stratigraphy in areas far from drillholes. Inferred fluid pathways are also indicated.
One plausible assumption regarding the resistivity distribution shown in Figure 4 is that areas of low resistivity (<5 ohm-m) are altered and smectite-rich and thus have low permeability. A corollary to this assumption is that the areas of high resistivity (>50 ohm-m) are smectite-poor and may be permeable (Witter et al., 2009).
As shown in Figure 4, a proposed deep well located to the west of 13-4 would be expected to hit the Paleozoic siltstone bedrock at ~500 m depth. At deeper levels, carbonate rocks or granite basement are likely to be encountered. Drilled directionally, this deep drillhole would extend underneath a large, low resistivity zone that may act as a clay cap on top of a deeper geothermal system (Witter et al., 2009).
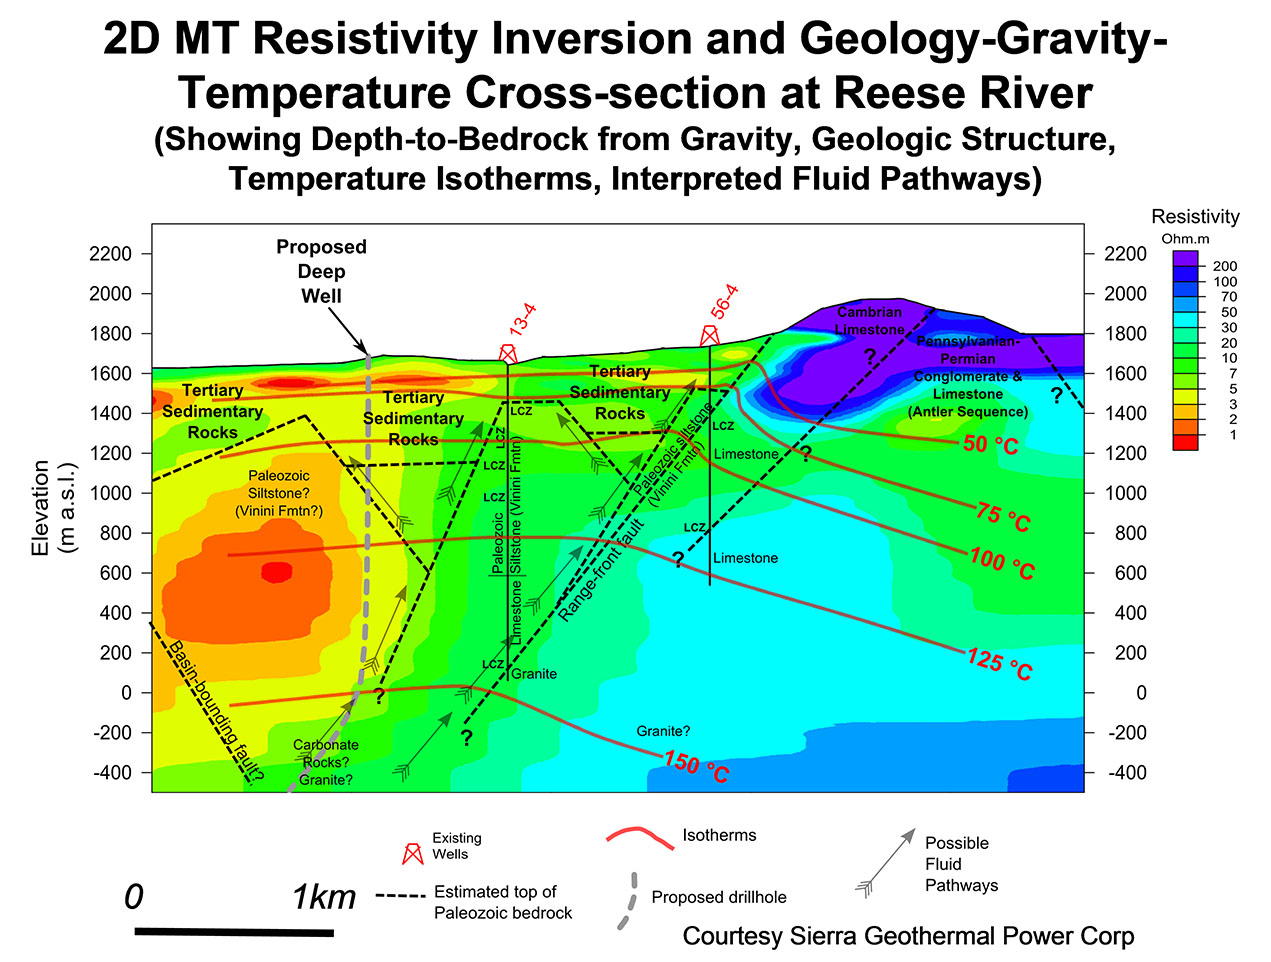
Figure 4: Cross-section through the Reese River prospect showing 2D MT resistivity inversion, depth to bedrock (estimated from gravity, geology and borehole data), temperature isotherms from boreholes, subsurface geology, existing wells and possible fluid pathways (revised after Witter et al., 2009).
Results and Discussion
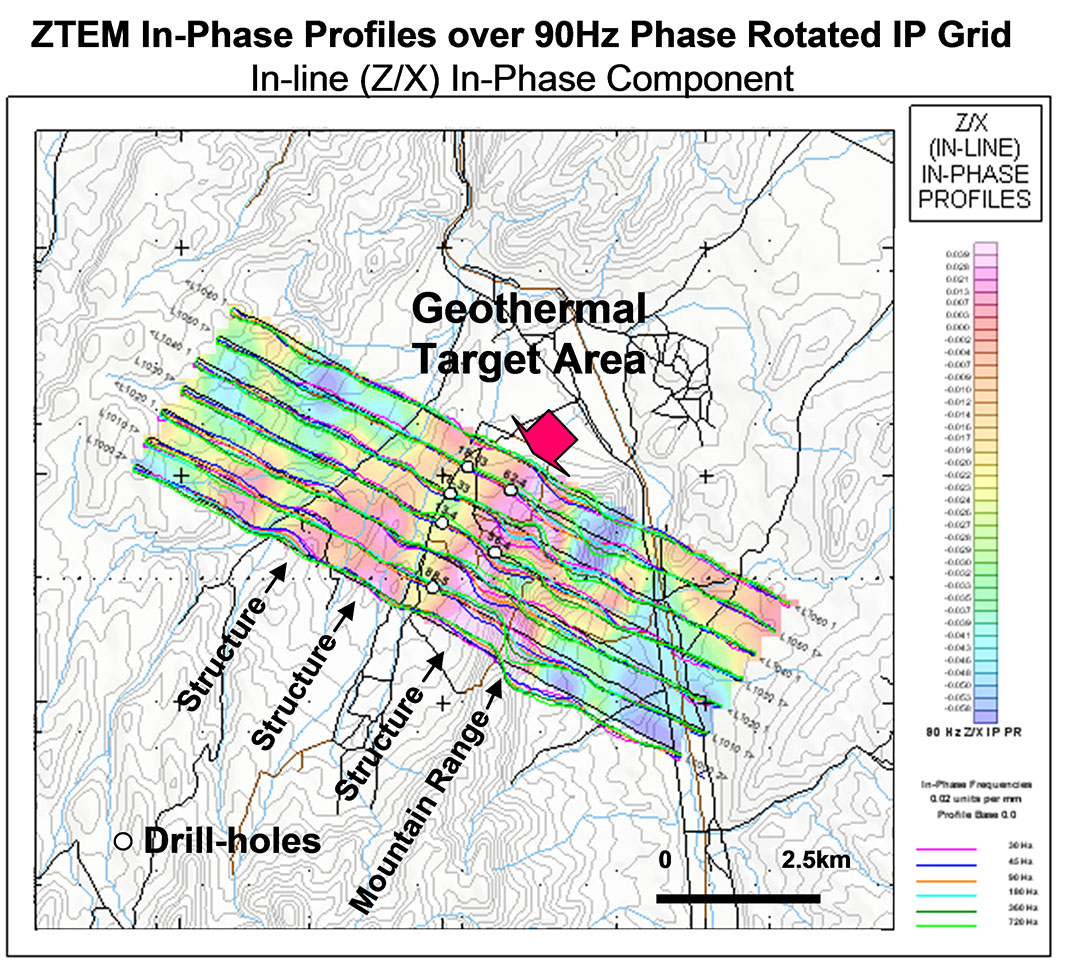
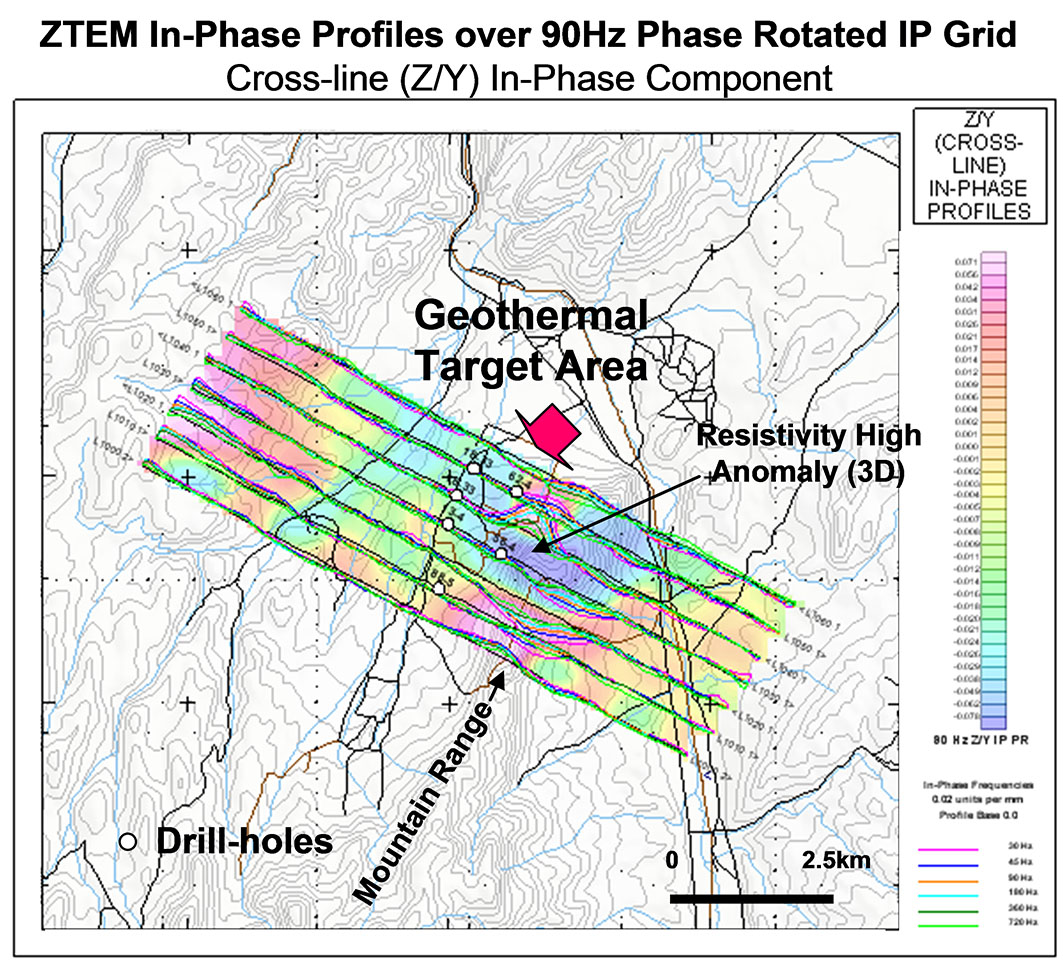
The two In-Phase Tipper profile data (Z/X = In-line – Z/Y = Cross-line), with corresponding 90Hz 90-degree Phase-Rotated (PR) grids (Lo et al., 2009; used to convert Tipper cross-over to peaks) are presented in Figures 5-6 and compare the relative orthogonal and oblique geoelectric structures, respectively. In these images, warm colours represent conductive zones, whereas cool colours (blues) represent resistive zones. The Z/X results (Figure 5) highlight long linear NE-SW regional fault zones, whereas the Z/Y results (Figure 6) define more localized resistivity anomalies located in the more mountainous central survey area that features more 3D behaviour.
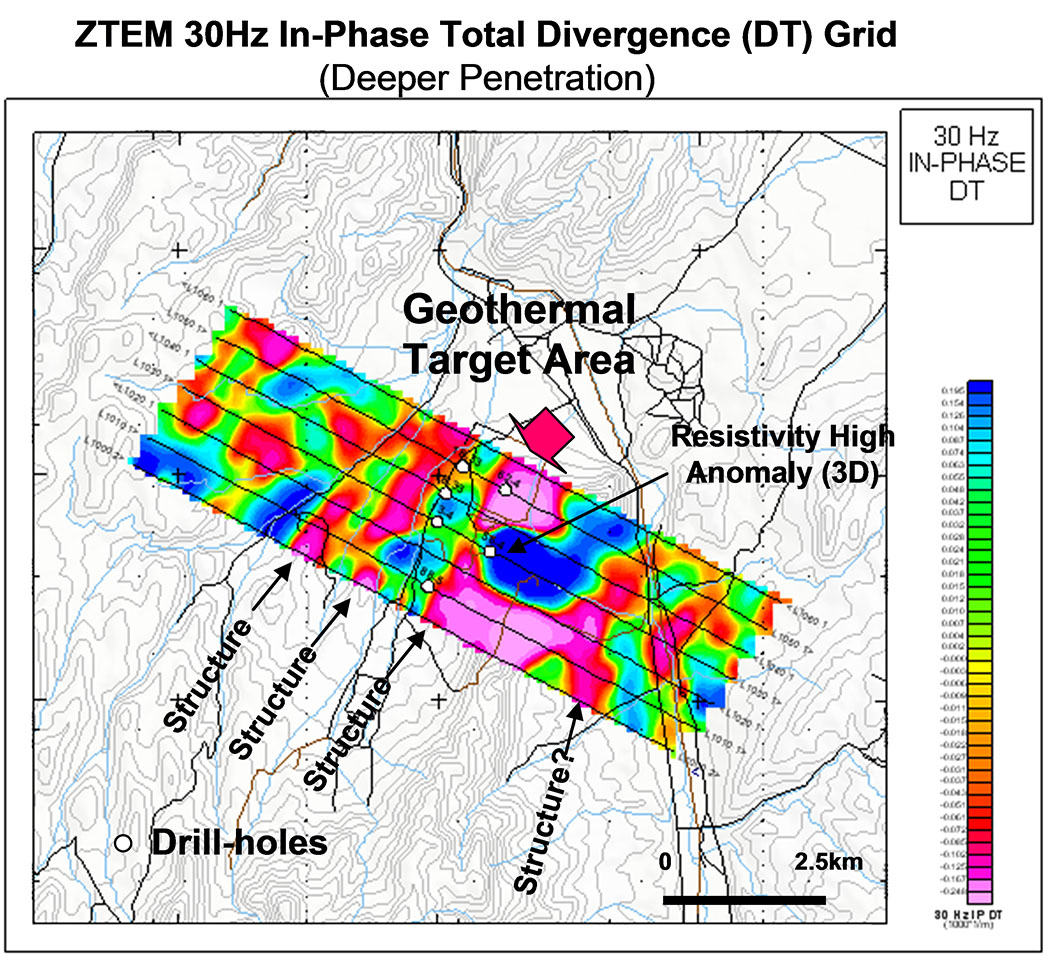
The In-Phase Total Divergence (DT; Lo et al.., 2009) results at 30Hz, shown in Figure 7, are a different representation of the ZTEM tipper data that allow the orthogonal Z/X and Z/Y components to be combined. Analogous to the Peaker parameter, used in VLF (Pedersen, 1998), the DT grid imaging of geoelectric structures is omni-directional, with all orientations being highlighted. The 30Hz DT images the deep tipper data – with the deeper results highlighting both the conductive NE-SW structures previously defined in Figure 5 and the prominent deep circular high resistivity feature (blue) from Figure 6 that lies in the geothermal target area and likely contributes to the 3D resistivity behaviour observed locally.
MT and ZTEM 2D Inversion Results
The ZTEM survey tipper results can be converted to their equivalent resistivity-depth source model using 2D inversion. The Zvert2d algorithm (Legault et al., 2009) has been adapted for ZTEM by accounting for the air layer as well as the mobileHz and fixed Hx base station. Zvert2d uses the finite element forward problem and inversion parameter sensitivities using reciprocity of Wannamaker et al. (1987) and de Lugao of Wannamaker (1996), with the regularized Gauss-Newton non-linear parameter step estimate of Tarantola (1987).
The input data for the ZTEM 2D inversions were the In-line (Z/X) In-Phase and Quadrature Phase data from all six measured frequencies (30-720Hz). Due to the impractical nature of the >1000 data points from the ZTEM profile, these were re-sampled to <200 points in order to perform the calculation and proved effective. An error of 1-2% was assigned to the data for inversion. A host of 100 ohm-metres was assumed for the starting model. Despite non-ideality of the data error, a value of nRMS of close to unity (1.0) was achieved in 4-6 iterations.
In marked contrast, the slightly contradictory images of the geoelectric MT and ZTEM responses illustrated in Figure 9, from L015/L1030 in the central survey area, are particularly noticeable below well 56-4. Interestingly, this area also coincides with the region of visible 3D behaviour, described previously. This suggests that the MT and ZTEM inversions are affected by 3D behaviour in the geothermal target area and may not produce geologically accurate images locally.
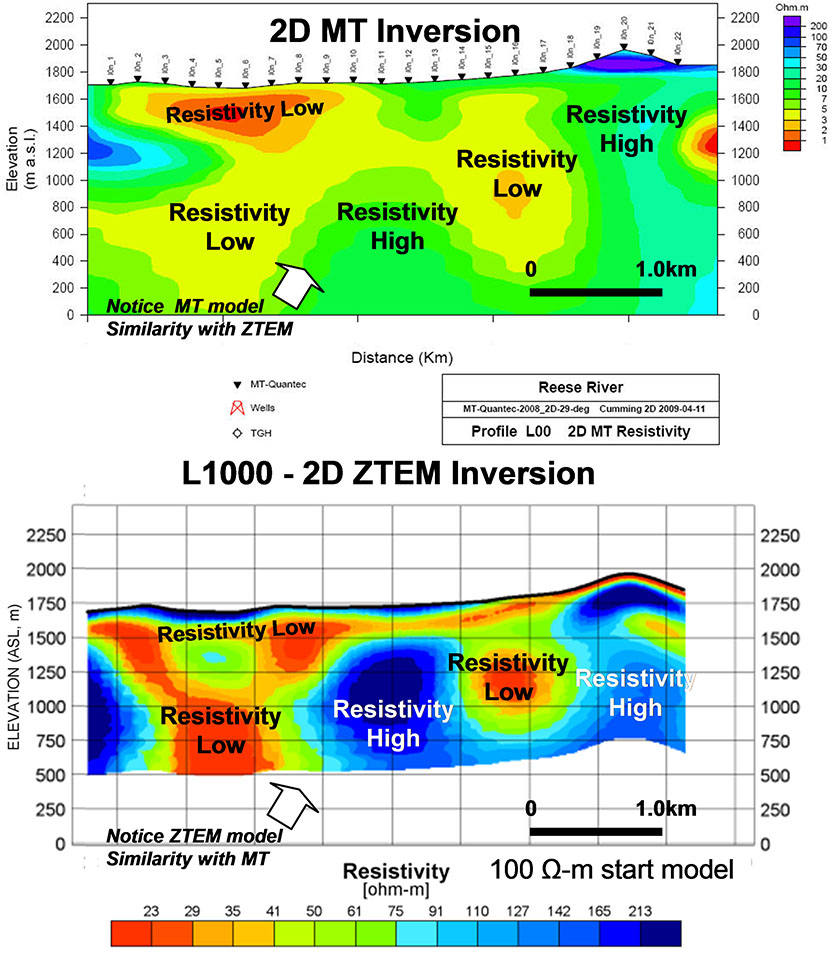
Figure 8: 2D Inversion of Ground MT Line LO (above) and ZTEM Line 1000 (Below). Notice MT similarity to ZTEM.
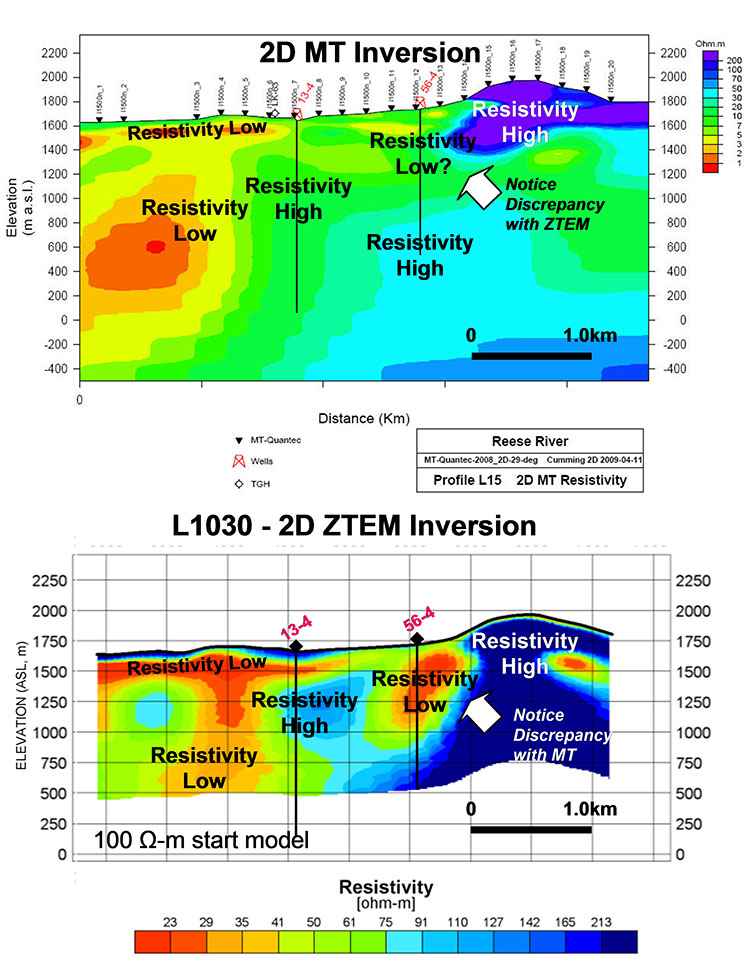
Figure 9: 2D Inversion of MT Line L15 (above) and ZTEM Line 1030 (below). Notice discrepancy below well 56-4.
Conclusions
The ZTEM results appear to correlate well with the magnetotelluric results and the known geology, in particular the presence of both major and secondary fault structures and geologic contacts. In addition, the ZTEM results appear to indicate differences in the relative source depth and vertical depth-extent of the defined geothermal features that are geologically plausible. In particular, the ZTEM results point to the presence of major NE-SW-trending conductive range front faults. In addition, the known geothermal area is marked by a prominent deep circular resistivity high feature, that is surrounded and capped by lower resistivity, and possibly relates to the higher geothermal alteration zone and surrounding lower temperature smectite-zeolite alteration.
The ZTEM and previous ground MT results were compared using 2D inversions. The Zvert2d inversion is a finite element 2D MT code specifically adapted for airborne ZTEM. Overall, the 2D inversions of the airborne ZTEM appear to agree very well with the inversions obtained from ground MT, except in areas of pronounced 3D behaviour, where 2D is invalidated.
