Presented at 13th SAGA Biennial Conference and Exhibition
For a PDF of this paper click here
Abstract
A desire to reduce the need to perform forward modelling on a case by case basis has resulted in an endeavour to model the ZTEM response and produce type curves. A total of 42 models of the subsurface were analysed using the OCCAM 2D MT forward modeling code. These models investigate two types of thin-plate conductors; conductive overburden and a conductive mineralized dyke. The conductance of the target, and overburden ranged from 100,000 S to 0.01 S, and 10,000 S to 0.01 S respectively. Modelling and graphical representation of the synthetic responses allowed for the production of type curves. One type curve was created for each of the six frequencies (30 Hz, 45 Hz, 90 Hz, 180 Hz, 360 Hz, and 720 Hz) that ZTEM measures. As expected, lower frequencies were generally more effective at resolving the conductive dyke below conductive overburden to depths down to 1000 m. A steady decrease in a ZTEM response as frequency increased was usually observed. The amplitude of the tipper response generally increased with the conductance of the dyke and decreased with the conductance of the overburden. The type curves produced for each frequency ultimately represent a useful exploration tool that can be used to predict the likelihood of successful performance of ZTEM airborne surveys for conductive targets in different geological environments around the world.
Key words: AEM, ZTEM, Forward Modelling, Type Curve, Conductive Overburden
Introduction
In 1959, Ward first proposed that Audio Frequency Magnetic (AFMAG) signals, induced by distant thunderstorms, could be recorded and interpreted to reveal geological information about the subsurface (Ward, 1959). In 2006 Geotech Ltd. developed the ZTEM (Z-Axis Tipper Electromagnetic) helicopter-borne AFMAG survey system (Figures 1 and 2). ZTEM is a passive electromagnetic system which records signal at 6 discrete frequencies (Table 1) between 30 Hz and 720 Hz (Legault, 2012).
When explorationists consider the choice of a ZTEM survey, they are interested in knowing what the likelihood of detecting their target of interest is. At the present time it is necessary to use 2D or 3D modeling codes, to compute the theoretical ZTEM system response, on a case by case basis, which is complicated, and time consuming, even for the simplest of models. The construction of type curves, based on 2D forward models, would represent a simple visual tool that would allow this response to be predicted quickly and accurately. Type curves would drastically reduce the need to forward model responses for similar targets.
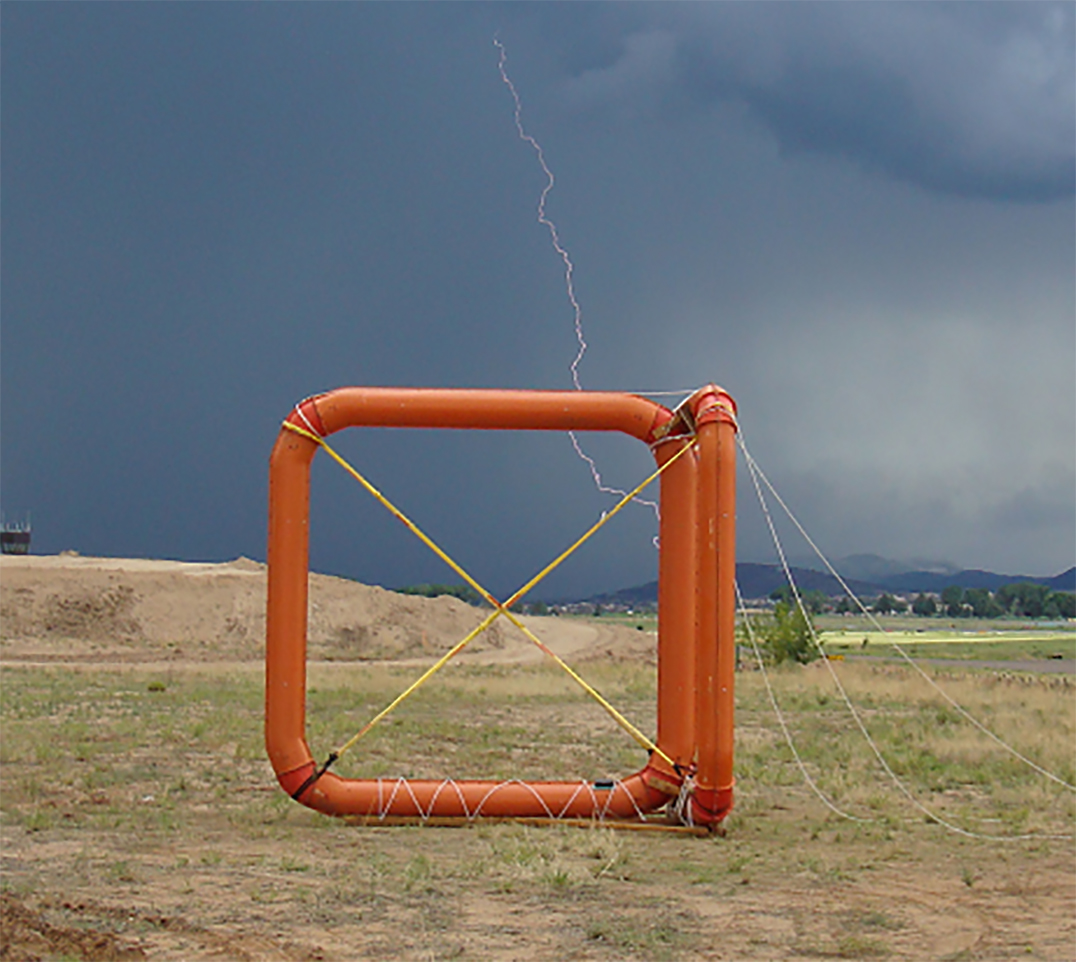
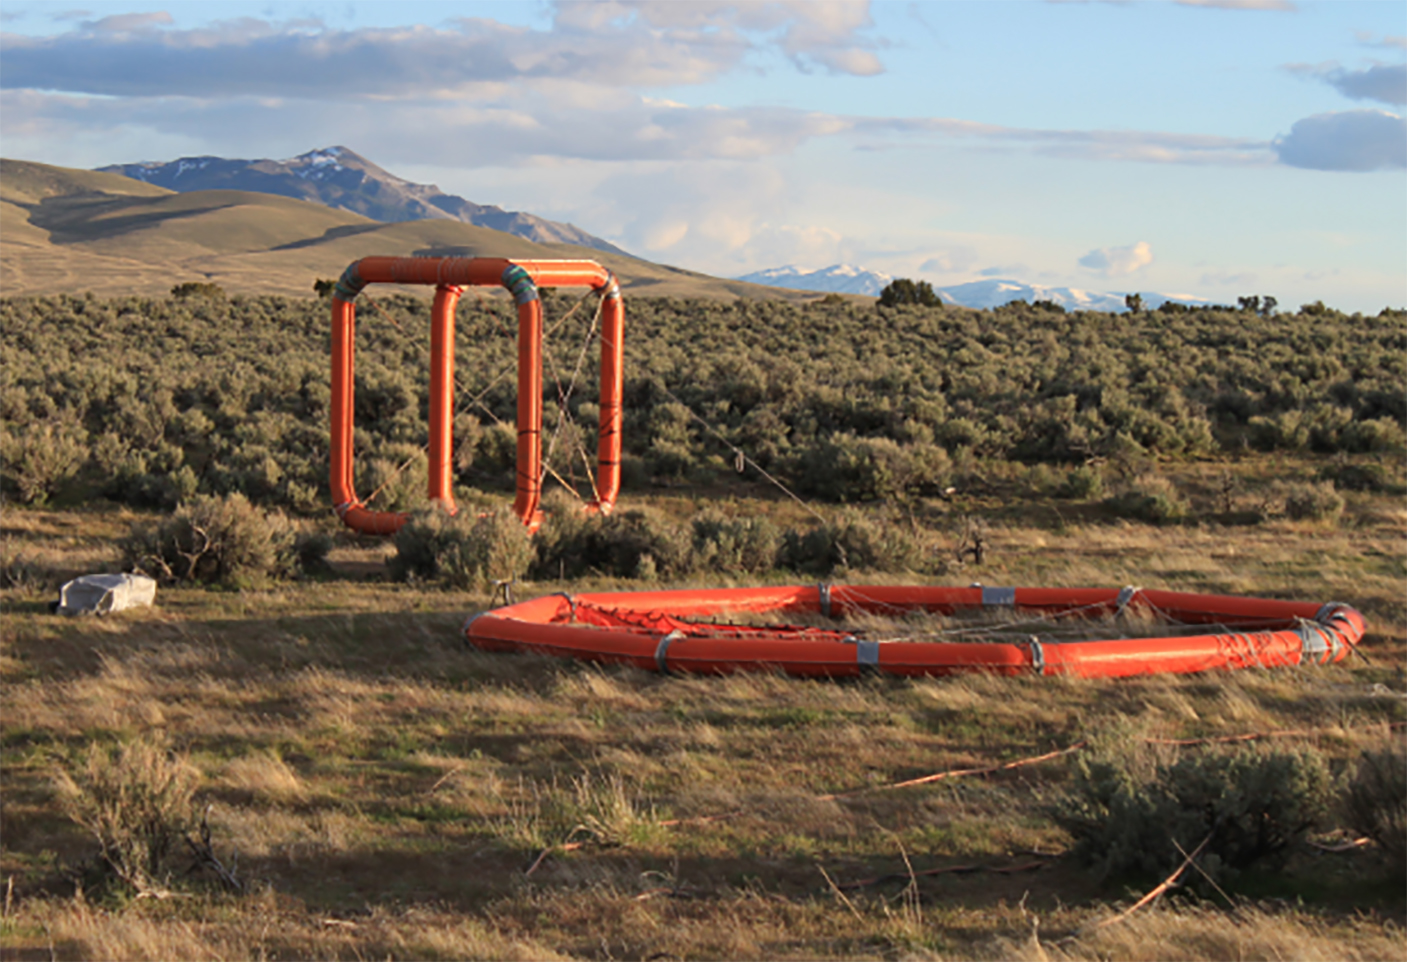
Figure 1. (A) ZTEM base station (square with a side length of 3.5 m) in foreground with lightning strike in the background. (B) ZTEM airborne receiver (circle with a diameter of 7.2 m) in foreground, ZTEM base station in the background.
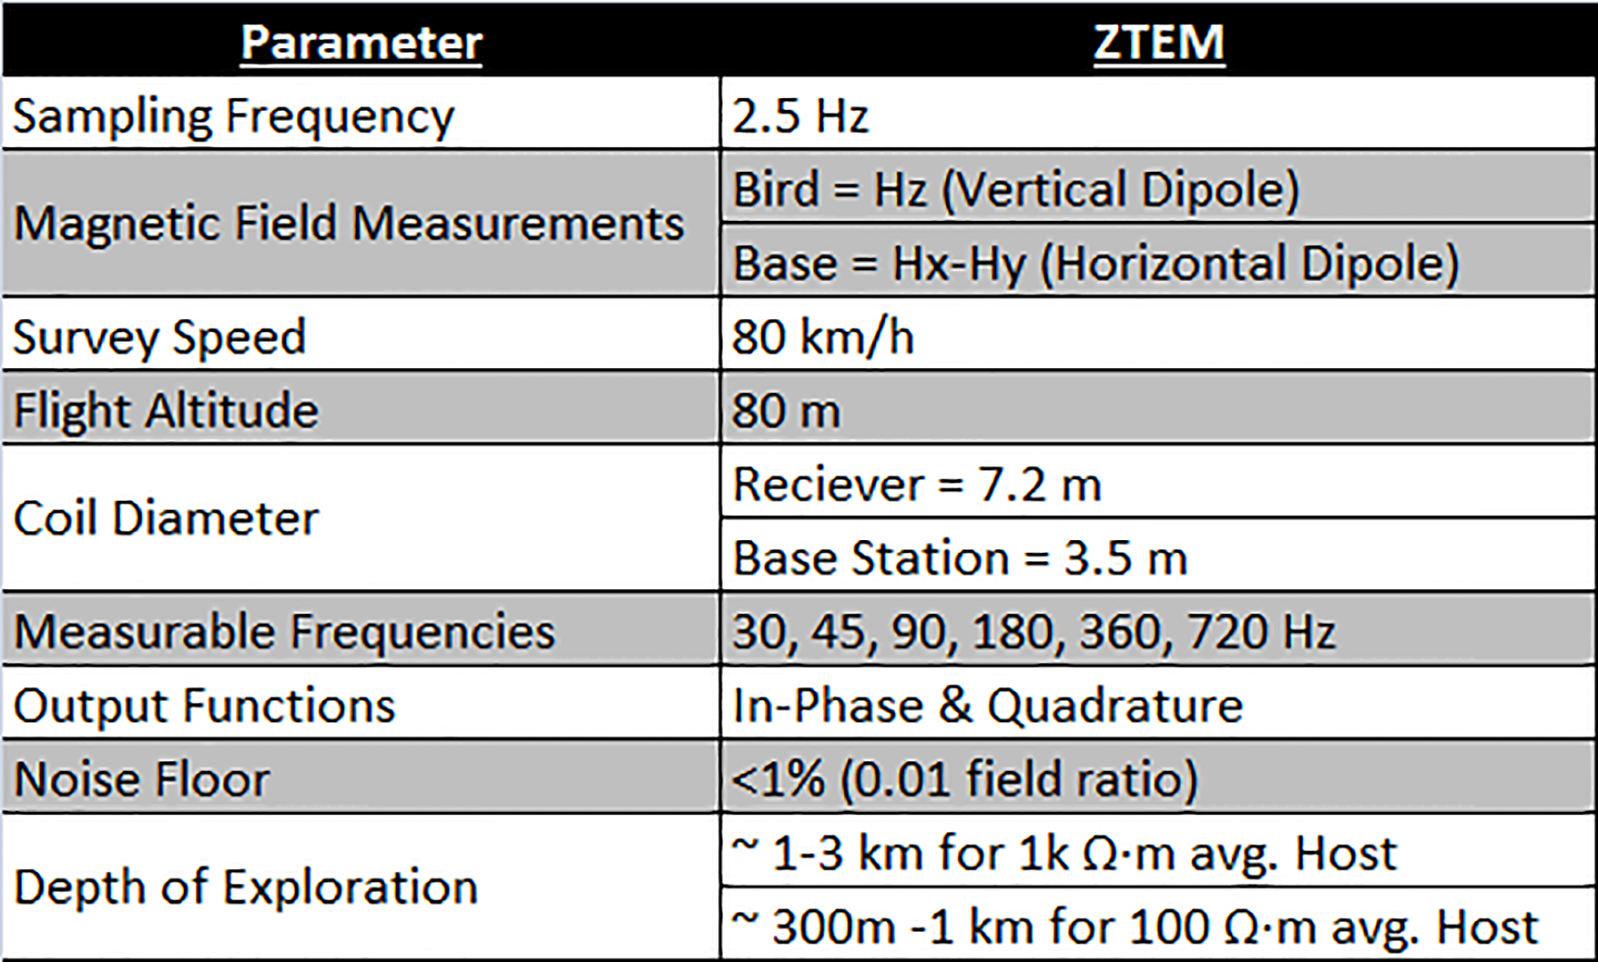
Table 1. Specifications for the ZTEM system
Methodology
The public-domain OCCAM 2D MT software’s 2D MT forward modeling code (Wannamaker et al. 1987), from the Scripps Institution of Oceanography, was adapted for ZTEM and used to forward model responses.
Modelling steps included:
(1) Construction of a 2D geologic cross-section (Figure 2),
(2) Computing the 2D forward response of the ZTEM system,
(3) Extract peak-to-peak amplitude data at different frequencies from the ZTEM response,
(4) Import data to MS Excel for analysis and construction of type curves.
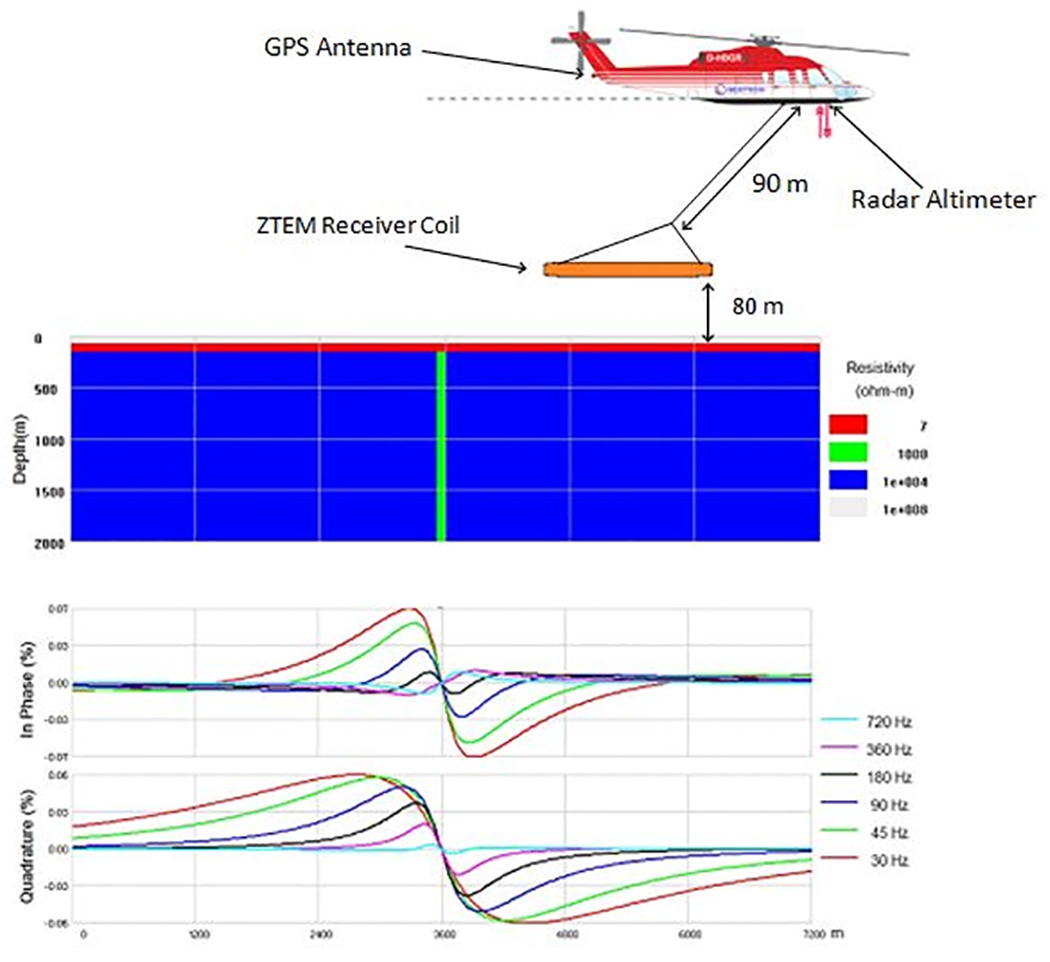
Figure 2: Visual representation of ZTEM system in-flight over 2D geologic cross-section of survey area. ZTEM 2D response for the above scenario for the 6 frequencies measured by the system.
Results
42 models were created. A consistent geologic cross-section was constructed containing 80 m of air with a resistivity of 108 (Ω∙m an intermediate volcanic host rock (half-space) of resistivity of 103 Ω∙m, 80 m of variably-conductive overburden, and a 100 m thick variably-conductive mineralized vertical dyke (Figure 2). The overburden and target were assigned conductances of 100,000 S, 10,000S, 100S, 10S, 1S, 0.1S and 0.01 S, respectively.
Response Trends
In general, for vertically dipping tabular 2D conductors buried below thin conductive overburden, the ZTEM response amplitudes decrease as the frequency of measurement increases (Figure 2). Peak-to-peak amplitudes for both the in-phase and quadrature, were tallied for each of the six frequencies measured by the ZTEM system. Data were then plotted, linking points of equal conductance for the overburden and the target dyke, respectively, to create type curves (Figure 3).
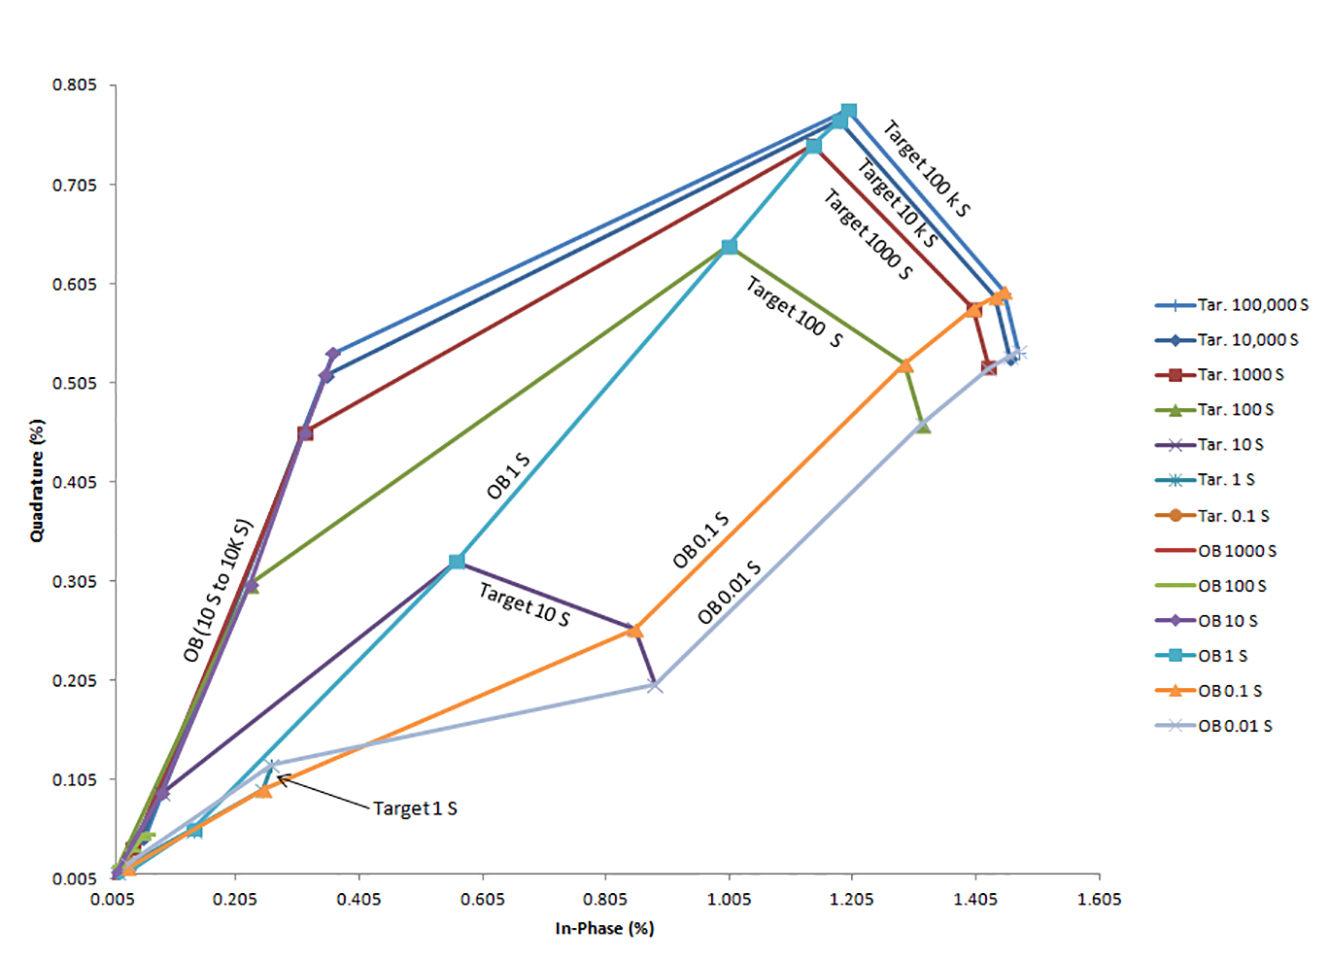
Figure 3. ZTEM type curves for 30 Hz, showing data points linked by both target and overburden (OB) conductance (S). Data were plotted from 0.005% which corresponds to the noise floor of the system.
In addition to construction of type curves, the data were plotted to display the ZTEM response with respect to both constant target (100 S) and overburden (0.1S) conductance. Generally, the response decreases when the conductance of the overburden increases (Figure 4). Conversely, the response generally increases with the increased conductance of the target dyke (Figure 5).
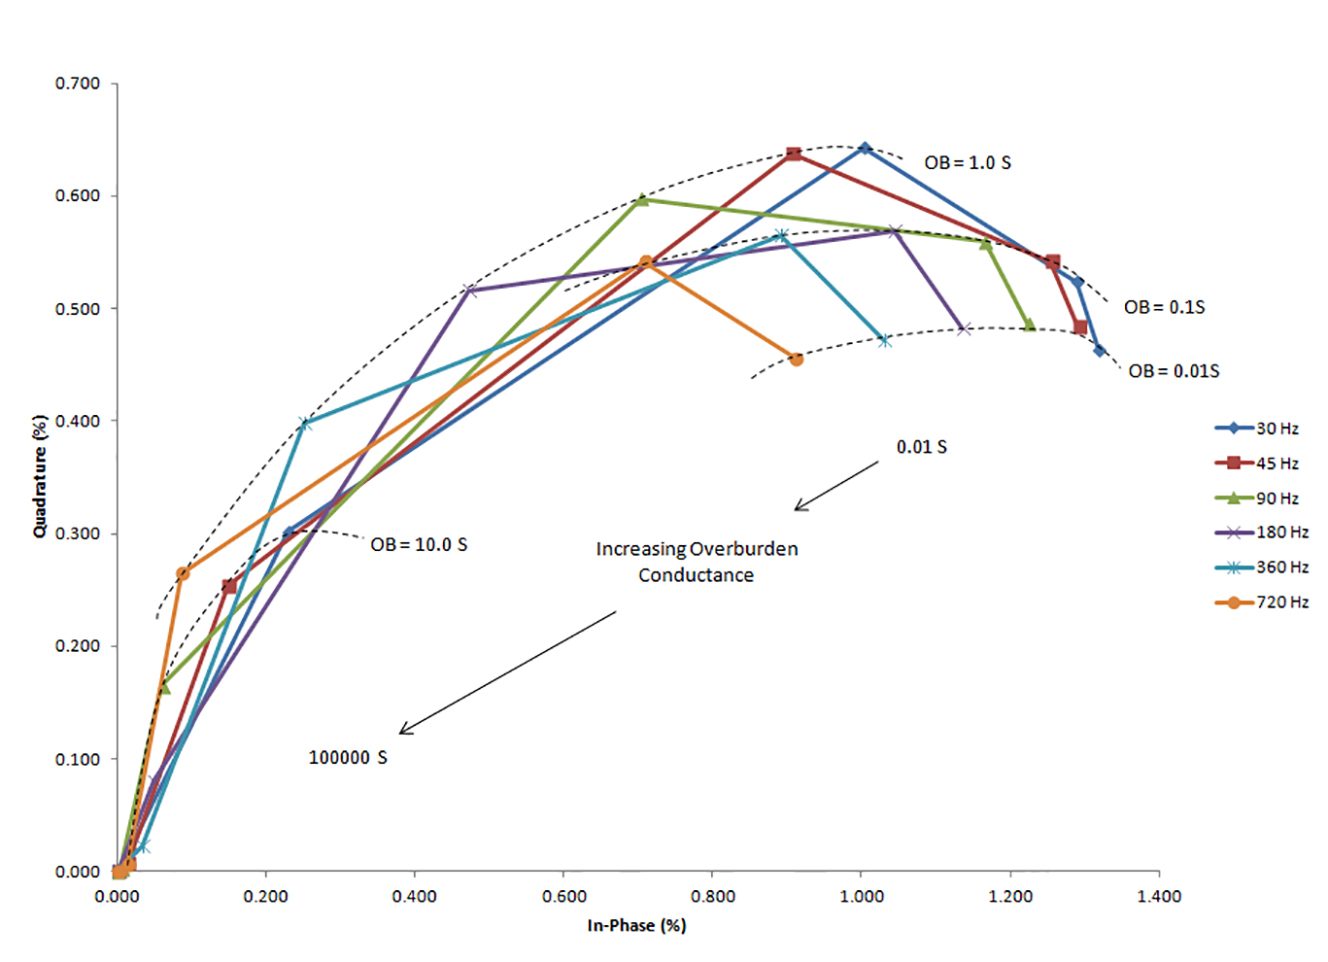
Figure 4. Effect of overburden (OB) conductance on ZTEM response. Target conductance held constant at 100 Siemens.
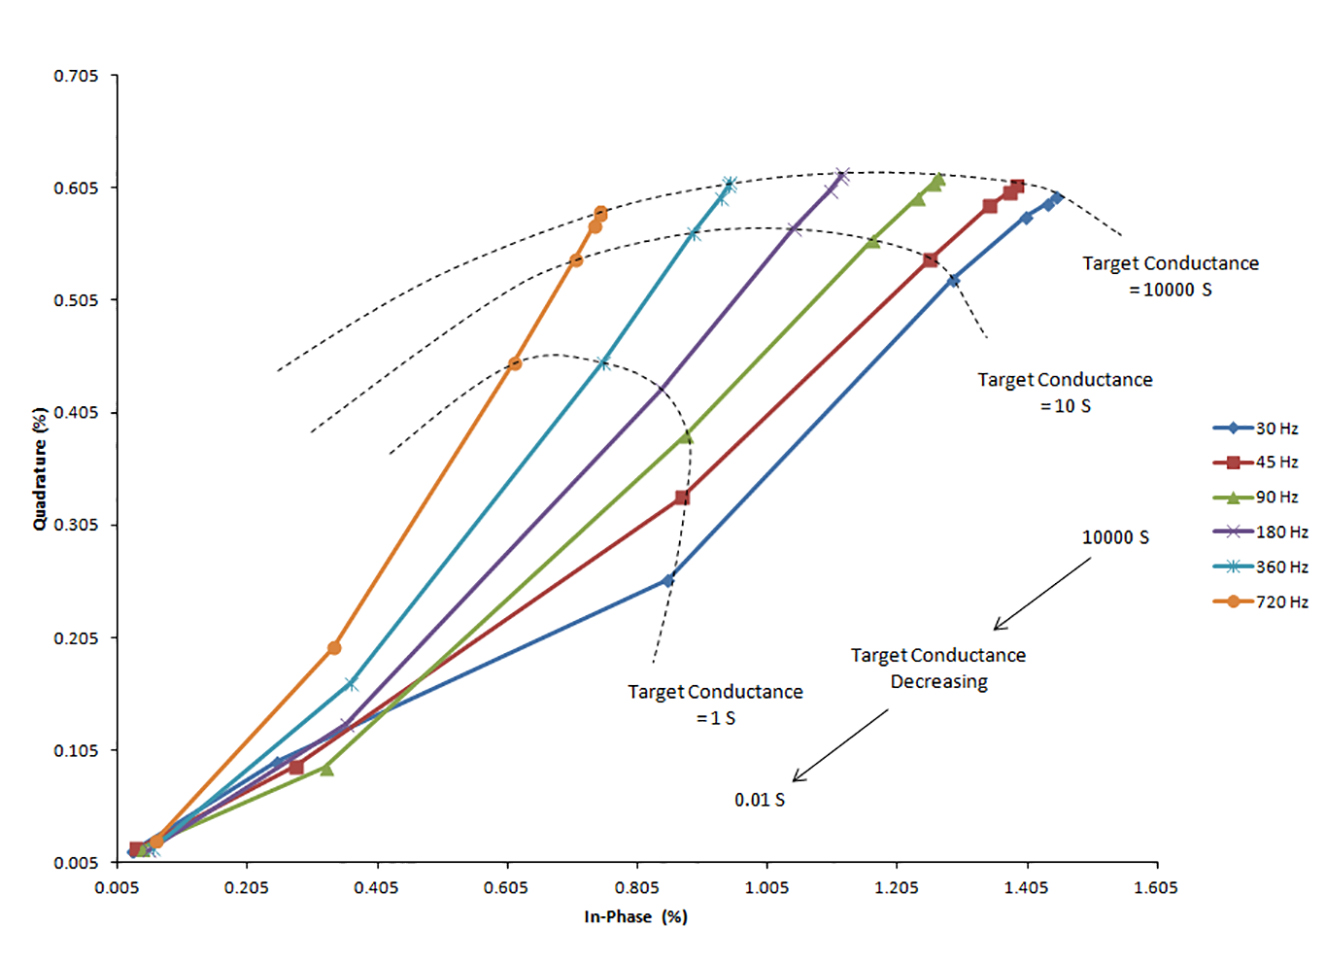
Figure 5. Effect of target conductance on ZTEM response. Overburden conductance held constant at 0.1 S.
Summary
Although this study featured only a few simple subsurface models, type curves for the ZTEM are presented for the first time. General trends have been captured by the type curves:
• Lower frequencies are more effective at penetrating the overburden to reach the target dyke at depth when compared to higher frequencies.
• The ZTEM response generally increases with the increased conductance of the target dyke.
• The ZTEM generally decreases with the conductance of the overburden.
The type curves produced represent a useful marketing and teaching tool that will reduce the need to compute the theoretical ZTEM response of on a case by case basis.
References
Legault, J.M., 2012, Ten years of passive airborne AFMAG EM development for mineral exploration, 82nd Annual International Meeting, SEG, Expanded Abstracts.
Kuzmin, P.B., B. Lo, and E. Morrison, 2005, Final report on modelling, interpretation methods and field trials of existing prototype AFMAG system: MDR 167, Ontario Geological Survey.
Wannamaker, P.E., J.A. Stodt, & L. Rijo, 1987, A stable finite-element solution for two-dimensional magnetotelluric modelling, Geophysical Journal of the Royal Astronomical Society, 88, p. 227-296.
Ward,S.H., 1959, AFMAG – Airborne and ground: Geophysics, 24(4), p.761-789.