Presented at SEG 2012 and Journal of Geophysics, Association of Exploration Geophysics (AEG) of India, Vol. XXXIV, No. 1, Special Issue: Airborne Geophysics
For a PDF of this paper click here
Summary
Heliborne VTEM™ and ZTEM™ surveys were flown over the Mayville property in south-east Manitoba. The VTEM results show good correlation with the Mayville Cu-Ni deposit and identify new areas for follow-up. ZTEM results correlate well with known geology, giving into the discovery of a PGM occurrence located one km to the southeast. Comparisons between these data sets and its geology are showcased using 1D-2D inversion modeling.
Introduction
The Mayville property, belonging to Mustang Minerals Corp. (Toronto, ON), hosts the M2 magmatic nickel-copper deposit consisting of a NI 43-101 open pit resource in 2010 of 9.2Mt 0.61% Cu; 0.23% Ni, as well as separate PGE occurrences of interest (www.mustangminerals.com). This area represents the exposed western margin of the Superior province which comprises a part of the Canadian Shield. The Mayville M2 deposit is part of a large mafic intrusive system in the Bird River greenstone belt of southern Manitoba (Figure 1).
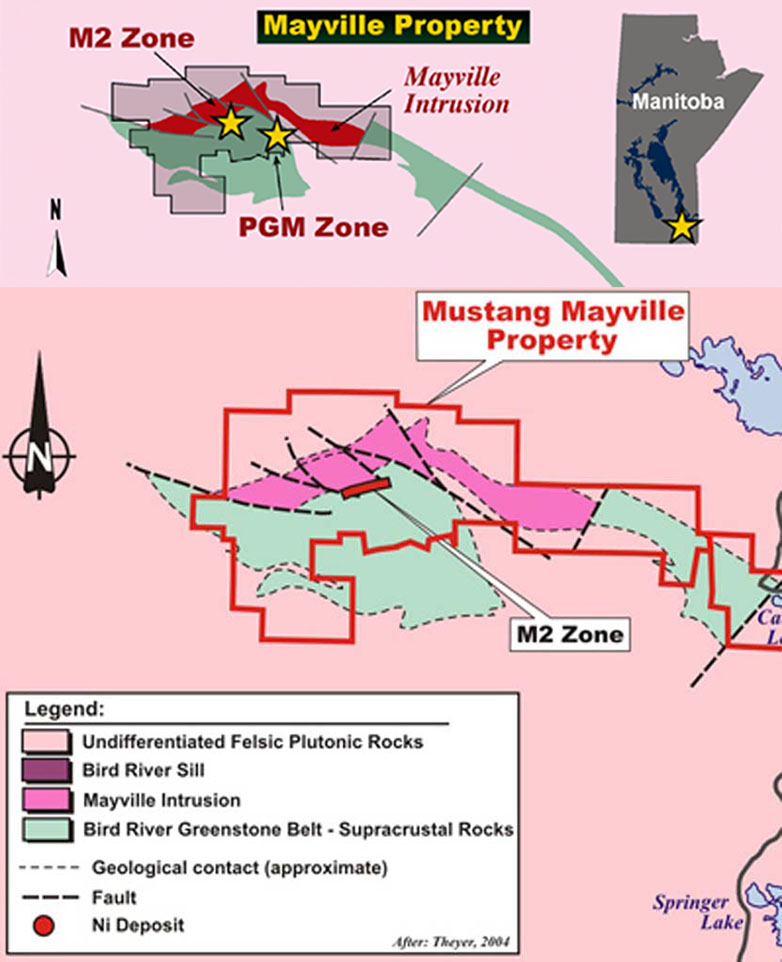
Figure 1: Mayville property location in southeastern Manitoba (top right) showing regional and property geology (courtesy Mustang Minerals Corp.).
Airborne Surveys
In April-May, 2005, Mustang contracted Geotech to fly a heliborne VTEM (versatile time-domain electromagnetic; Witherly et al., 2004; Witherly and Irvine, 2006) survey over Mayville property. This successful survey was then subsequently followed by a ZTEM (z-axis tipper electromagnetic; Lo and Zang, 2008) helicopter AFMAG (Ward, 1959; Labson et al., 1985) survey, in November 2009.
Figure 2 shows the total magnetic intensity (TMI) image of the Mayville property with flight path of the ZTEM survey and interpreted ZTEM anomalies. Flight path of the VTEM survey flown in 2005 is also presented (blue lines) with anomalies of interest related to the known mineralization highlighted for data comparison and analysis.
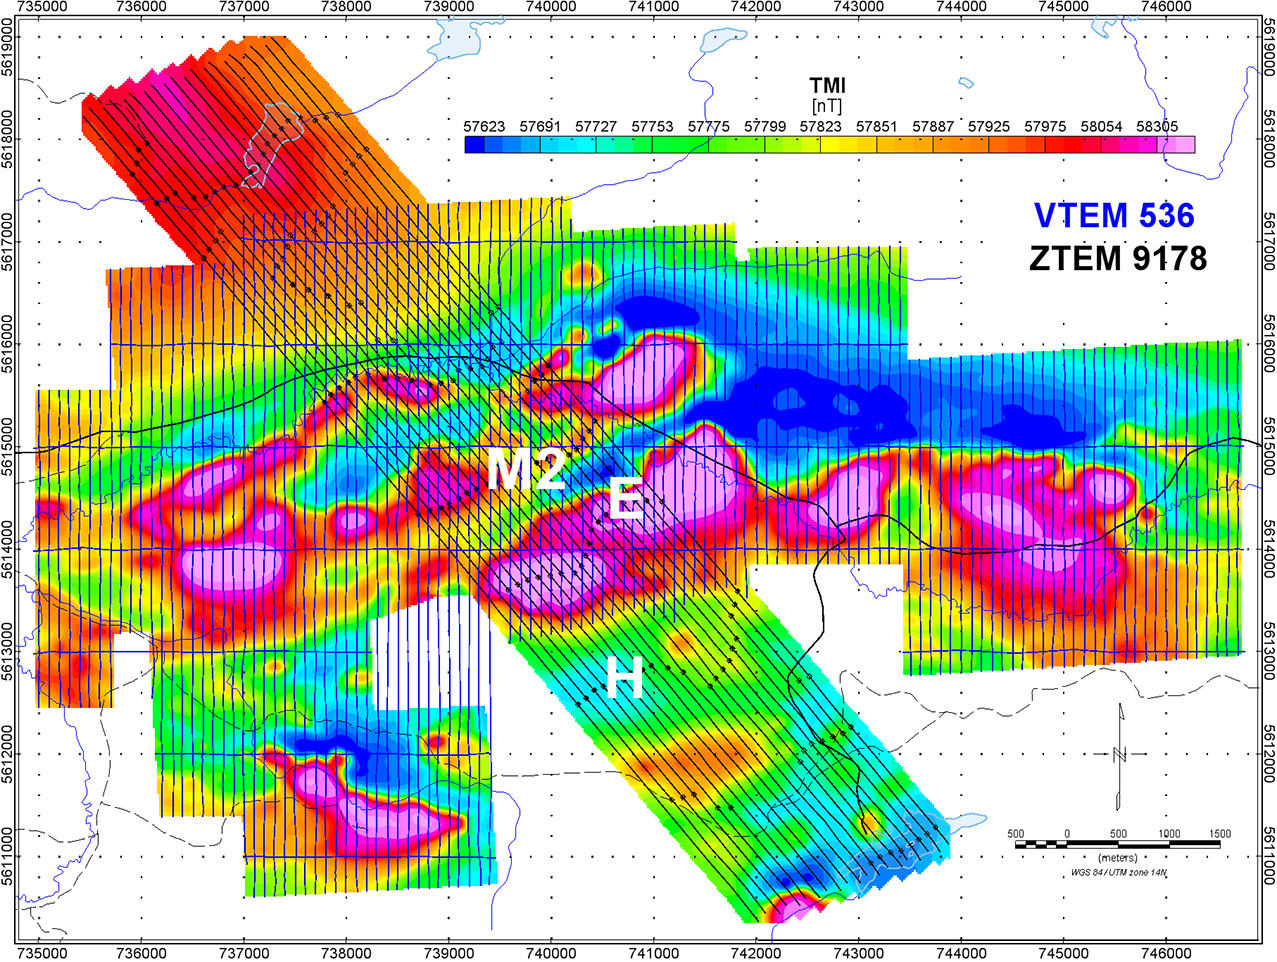
Figure 2: TMI image with VTEM and ZTEM flight path, and interpreted anomalies of interest related to known mineralization.
VTEM Survey Results
The 2005 VTEM survey consisted of 543 line-km flown along 100m spaced NS lines and 1km spaced EW tie-lines, with EM and magnetic sensors at 40m and 65m avg. elevations, respectively. The VTEM and magnetic results at Mayville are presented in Figures 3. The EM Time Constant (Tau) image in Figure 3a was obtained from the Z-coil, dB/dt response.
For potential conductive mineralized targets, the eddy current decays more slowly with of time, giving rise to larger values of Tau, relative to poor conductors. Medium-to-large values of Tau, with responses extending into late times, are an indication of potential massive sulphide mineralization for base-metal and PGM exploration.
When applying a “sliding Tau” method of analysis (Prikhodko, 2010, pers. comms.), relatively late channel (6.34 ms) anomalous decays suggest that potentially conductive zones of interest are present in the survey area (Figure 3a). As indicated, several groups of anomalies, including the M2 zone, are identified with time-constant (Tau) in the range of 1.48 – 1.94 ms, favorable for massive Ni-Cu-PGM sulphide mineralization.
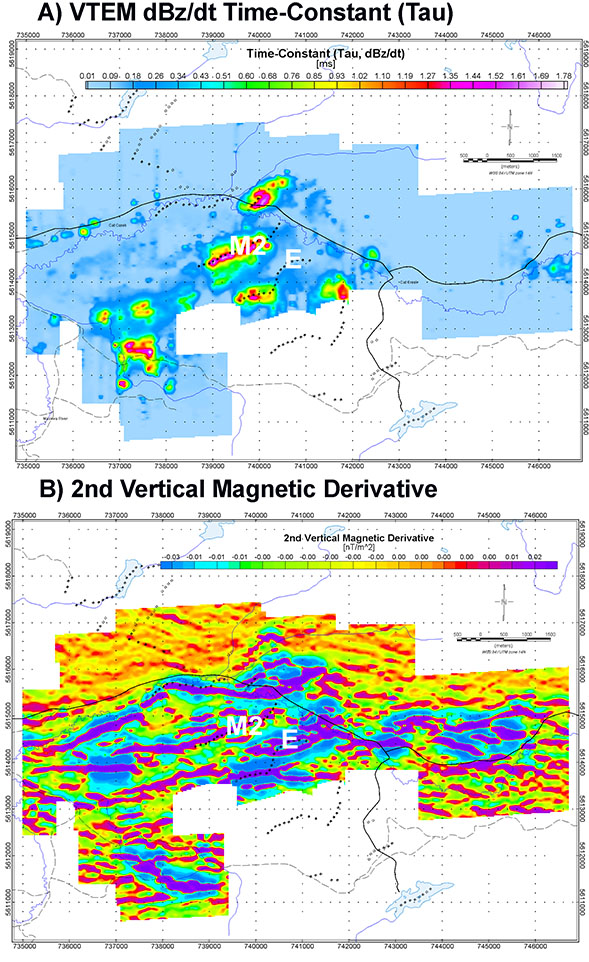
Figure 3: Mayville VTEM survey results: a) dBZ/dt time-constant (Tau) and b) calculated 2ND vertical magnetic derivative, with VTEM anomaly picks; and anomalies of interest.
In order to discriminate between near surface and deepest magnetic sources, the second vertical derivative was calculated (Figure 3b). Magnetic lineaments related to dikes and secondary faults within the Mayville Intrusion are observed as generally having a regional east-west trend, whereas outside the property, ESE trends predominate.
Anomaly M2 that is associated with the known Cu-Ni deposit is observed to extend for 1.2km between lines L6390 to L6500 in north-east to south-west trend along a favourable geological contact. An examination of the VTEM time gates shows only a single peak anomaly in the early times that evolves into a double-peak signature in late times, suggesting a prism-like target. A positive magnetic high correlation is observed, as shown in Figure 3b. Topographically, the M2 anomaly is located in a relatively flat terrain with elevations of 282 – 285m above sea level.
A conductivity-depth image (CDI), shown in Figure 4, was generated using EMflowTM (Encom Technology, N Sydney, NSW, AU) for L6470 that intersects several anomalies, including M2. These anomalies are also identified in the ZTEM survey results. As shown in Figure 4 that combines the CDI with a cross-section generated from drill-hole results, the M2 anomaly features its strongest response (500 mS/m) in the first 50 metres from surface. The signal weakens and continues to be visible at depth, as confirmed at 300m by drill-holes.
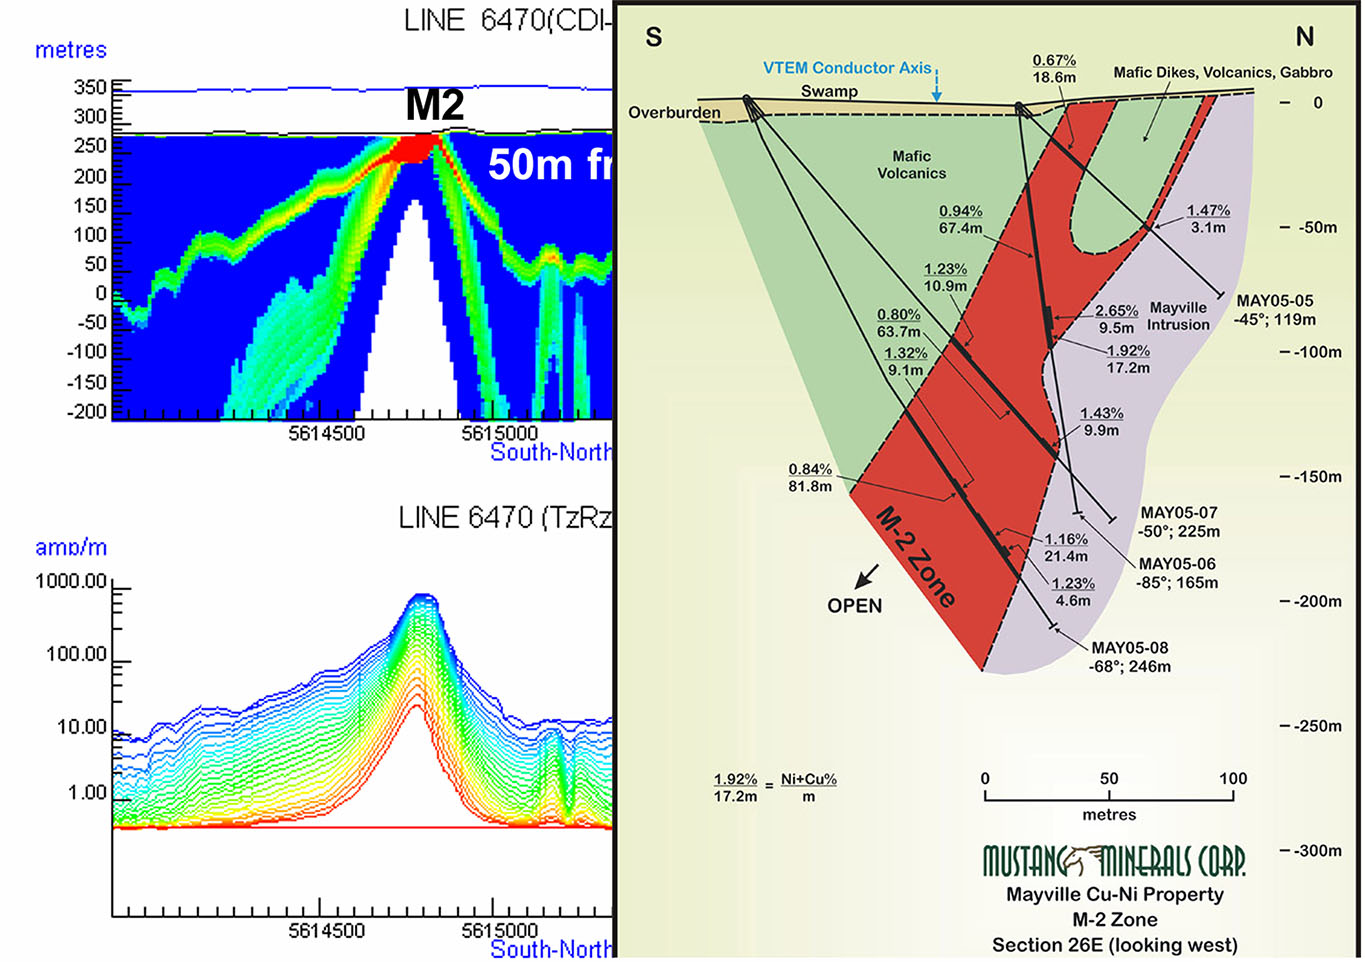
Figure 4: View looking west of M2 anomaly: Left) EM-Flow CDI of VTEM L6470; Right) cross-section from drill-hole results (courtesy Mustang Minerals Corp.).
ZTEM Survey Results
The 2009 ZTEM survey consisted on 200 line-km flown along 100m spaced lines over the Mayville survey block. ZTEM lines were orientated N140°E to perpendicularly intersect the M2 zone. The EM and magnetic sensors were at 85m and 100m avg. elevations, respectively. The ZTEM survey results at Mayville are presented in Figures 5-7.
ZTEM is an airborne variant of the AFMAG natural field EM technique where a single vertical-dipole air-core receiver coil is flown over the survey area in a grid pattern, similar to regional airborne EM surveys. Two orthogonal, air-core horizontal axis coils are placed close to the survey site to measure the horizontal EM reference fields. Data from the three coils are used to obtain the Tzx In-line and Tzy Cross-line tipper (Vozoff, 1972) components at six frequencies in the 30 to 720 Hz band.
Figure 5 presents the ZTEM tipper results in plan shown as Total Phase Rotation (TPR) images that convert the tipper cross-overs into peak responses for easier interpretation/ visualization. Although it is similar to the Total Divergence (DT) that is analogous to the Peaker parameter of Pedersen (1998), the TPR preserves the long waveform information (Lo et al., 2009). Shown are the In-Phase TPR’s at the high (360Hz) and Low (30Hz) frequency, for depth-comparison purposes, based on relative skin depth.
The linear trending M2 anomaly is well defined at high frequencies (see Figure 5a, 360Hz), indicating that the unit is likely not deeply buried, as previously corroborated by VTEM results. The anomaly is also still well defined at lower frequencies (Figure 5b, 30Hz) potentially suggesting good vertical depth extent in the skin depth range.
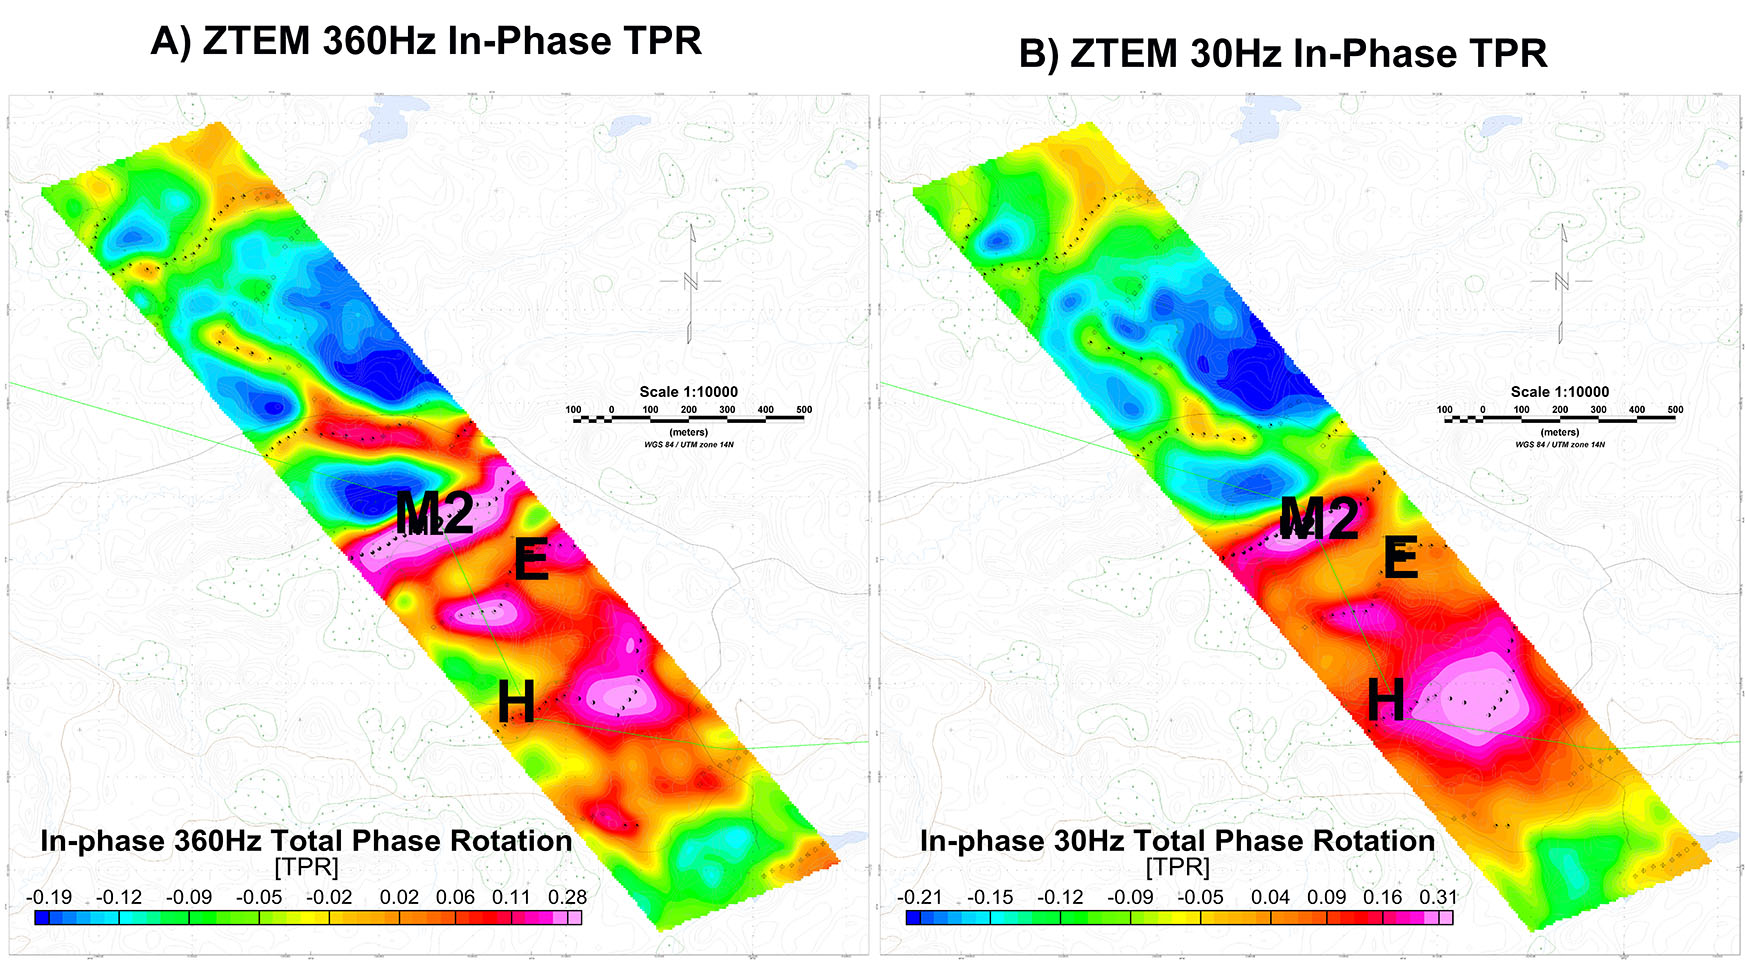
Figure 5: ZTEM Total Phase Rotation (TPR) of In-Phase Tipper at: a) 360Hz and b) 30Hz, with EM anomaly picks, anomalous zones (M2, E and H).
Anomaly E, that coincides with a PGM mineralized zone (9 metres at 9g/t PGM) is situated one kilometer southeast of the M2 zone, features a conductive response at high frequency (5a, 360Hz) but which progressively weakens in strength and geometry at lower frequencies (5b, 30Hz) – suggesting that it relates to more of a near-surface geologic feature.
Further south, ZTEM anomaly H, strengthens at lower frequencies/increasing depth. Like anomaly E, it appears to also occur in volcanic rocks, yet is relatively non-magnetic (i.e., potentially not sulphide-mineralized, lithologic or fault-like) and remains unexplained (Robin Dunbar, 2012, pers. comms).
2D Inversion Results
Two-dimensional (2D) inversions of the ZTEM data have been applied using the Av2dTopo proprietary inversion software. 2D inversions convert the ZTEM’s In-Phase and Quadrature tipper data into equivalent resistivity vs. depth cross-sections. The Av2dTopo makes use of the finite element forward problem and inversion parameter sensitivities using reciprocity of Wannamaker et al. (1987) and de Lugao and Wannamaker (1996), together with the regularized Gauss-Newton nonlinear parameter step estimate described by Tarantola (1987). Av2dTopo accounts for the 2D topography and the bird terrain clearance, by imposing a variable “air layer” (1018 ohm-m) below the receiver (P. Wannamaker, 2009, pers. comms.). The inversion utilizes the in-line (Tzx) component, in-phase and quadrature data for five or six frequency (30, 45, 90, 180, 360 +/- 720Hz) data in the calculation.
A test was performed over one survey line to determine the most appropriate half-space resistivity start model, based on relative RMS fit and agreement with previous VTEM results. Performed in a range between 100 ohm-m to 10,000 ohm-m, a homogeneous half-space starting model of 3k ohm-m was chosen for the remaining inversions.
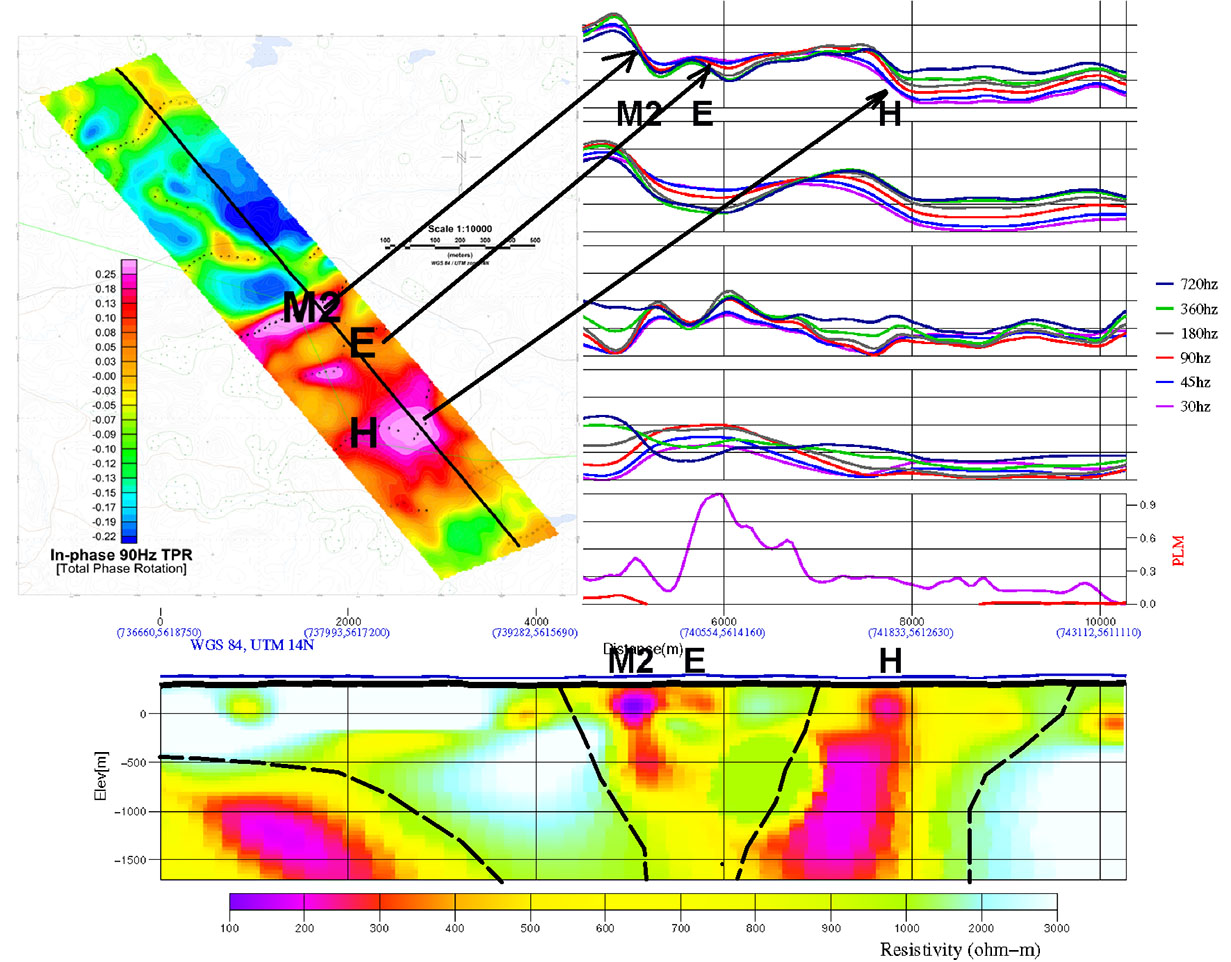
Figure 6: 2D ZTEM inversion on L1130. Top-left) in-phase 90Hz TPR image with L1130 location; Top-right) observed and forward data profiles for In-line Tzx in-phase and quadrature; and bottom) 2D inversion image, with anomalies of interest.
Figure 6 shows the 2D inversion for L1130 that intersects the eastern part of the M2 Ni-Cu zone as well as the anomaly E PGM zone. Several features of interest are highlighted in the ZTEM inversion results (bottom image in Figure 6), specifically the low resistivity M2 and E anomalies of interest that are associated with the known mineralization. In particular, M2 is the more conductive of the two zones, which is consistent with the nature of the massive Ni-Cu sulphide orebody. Along L1130, which lies on the eastern half of M2, although it weakens with depth, the inversion suggests that it continues to be anomalous to below 0.5-1km depths. Whereas elsewhere, particularly further southwest and northeast along strike, the inversions suggest that M2 is not conductive below 250-300m depths.
Anomaly E, on the other hand, is more weakly conductive and also more depth-limited and consistently pinches-out from surface to below 200m depths. Further southeast, anomaly H is clearly shown in the inversion results (Figure 6) as a broader, larger low resistivity body, consistent with a more lithologic-like geologic source.
Stacked profiles in Figure 6 (top-right) emphasize the magnetic association of the targets (highest amplitude on anomaly E) and arrows point at profile cross-overs that coincide with higher conductivity regions shown on the Total Phase Rotation (TPR) image (top-left).
A 3D resistivity voxel gridded directly from the geo-referenced ZTEM 2D inversions database is presented in Figure 7. As shown, the 250 ohm-m resistivity level has been highlighted as an iso-surface to better delineate the low-resistivity targets. The known sulphide-mineralized M2 and E zones are both all highlighted in this image, as well as anomaly H and other undetermined anomalies further northwest of the Mayville Intrusion.
Conclusions
Helicopter-borne VTEM survey results over the Mayville Intrusive system have identified conductive signatures associated with the two known Cu-Ni and PGM mineralized occurrences. The M2 VTEM anomaly is associated with an open pit Cu-Ni resource of 9.2 Mt that is open along strike with a favorable geological contact. The ZTEM AFMAG survey has also defined an important conductive anomaly that correlates with the M2 zone and appears to agree with known geology as well as previous VTEM results. ZTEM results have also potentially identified a greater depth-extent of the M2 target, in its eastern half, to greater than 300 metre depths – which is greater than previously indicated in VTEM and drill testing. Presently, the company is testing the deeper extent of the M2 deposit.
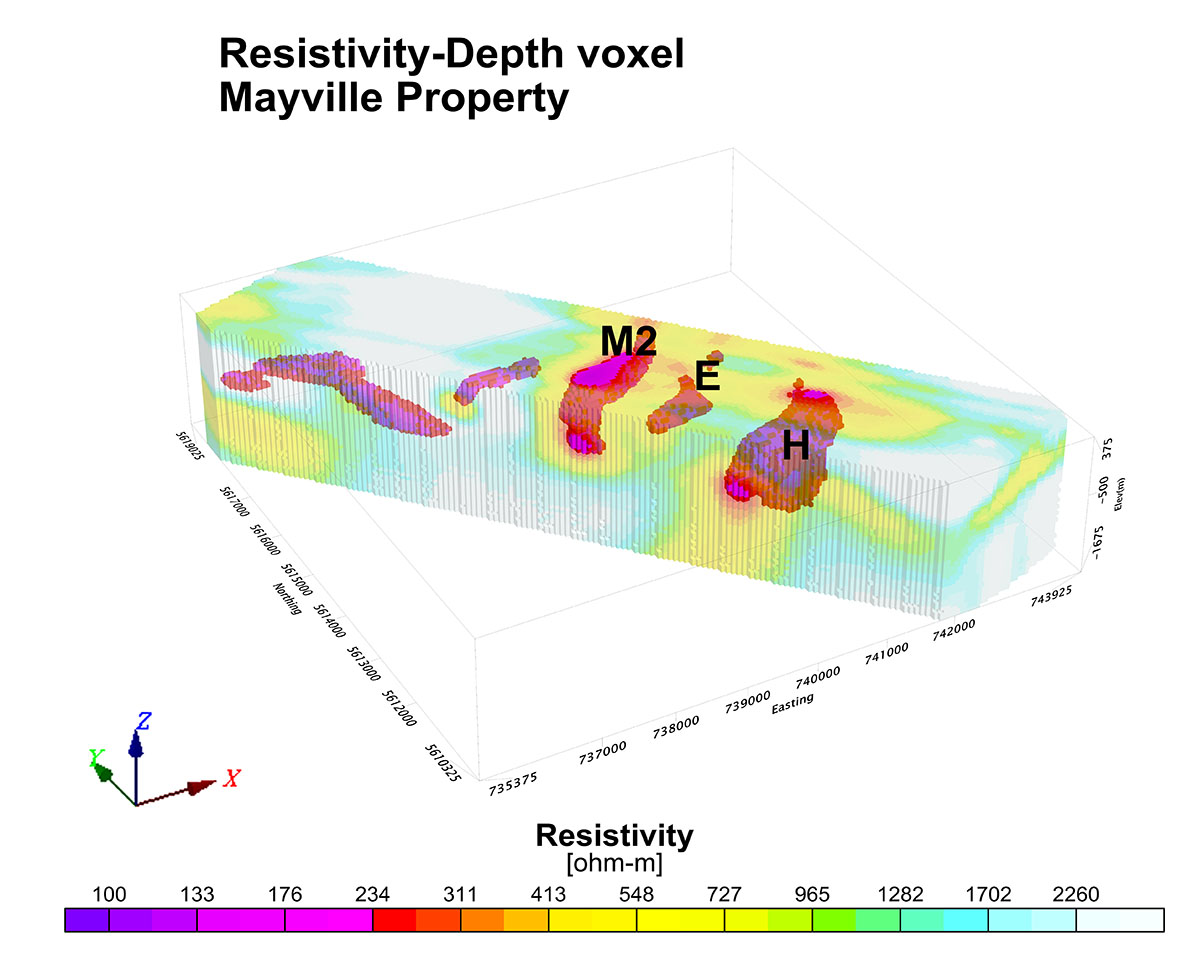
Figure 7: 3D view of ZTEM 2D inversions of the Tzx in-phase and quadrature data, highlighting anomalies of interest (M2, E, H) as low resistivity zones below 250 ohm-m.
Follow-up ZTEM survey results have identified a near-surface conductive anomaly E that correlates with a VTEM magnetic body and is also associated with a new PGM discovery. It is situated just one kilometer southeast of the anomalous zone M2. A third larger ZTEM conductive anomaly H that was not covered by VTEM is relatively non-magnetic and therefore inconsistent with sulphides and is likely ascribed to an unmineralized to weakly mineralized geologic/lithologic unit.
The results at Mayville are consistent with other VTEM-ZTEM comparisons over magmatic Ni-Cu targets, such as Axis Lake (Legault et al., 2009), Forrestania (Sattel et al., 2010), Eagle One (Legault et al., 2010) and East Bull Lake (Legault et al., 2011) which show that VTEM is better suited for high resolution mapping of higher-conductance massive to semi-massive sulphide targets in the 0-500m range – with depth-detectability sensitivity proportional to target size. On the other hand, ZTEM is better suited for larger scale and deeper resistivity structures, associated with regional geology and sometimes extending to great depth (1-2km), depending on lateral resistivity contrasts. The Mayville results also suggest that both technologies can be used to complement each other as mapping tools of targets of different scale & style as applied to magmatic Ni-Cu and PGM-sulphide exploration.
Certainly, 3D inversion of ZTEM and VTEM data could provide valuable insight and further explanation of the relationship between the mineralized zones on the Mayville property.
Acknowledgements
The authors wish to thank Mustang Minerals Corp., joint-venture partner Western Areas NL and Geotech Ltd. for allowing us to present these results.
References
De Lugao, P.P., and P. Wannamaker, 1996, Calculating the two-dimensional magnetotelluric Jacobian in finite elements using reciprocity: Geophysical Journal International, 127, 806-810.
Labson, V. F., A. Becker, H. F. Morrison, and U. Conti, 1985, Geophysical exploration with audio frequency natural magnetic fields: Geophysics, 50, 656-664.
Legault, J. M., K. Fisk, and C. Fontura, 2010, Case Study of Ztem Airborne Tipper Afmag Results Over A Magmatic Nickel Deposit at Forrestania, West Australia: 4TH Brazilian Geophysics Symposium, SBGF, Expanded abstract, 8 p.
Legault, J. M., H. Kumar, B. Milicevic, and L. Hulbert, 2009, ZTEM airborne tipper AFMAG test survey over a magmatic copper-nickel target at Axis Lake in northern Saskatchewan: SEG Expanded Abstracts, 28, 1272-1276.
Legault, J. M, M. Orta, H. Kumar, and S. Zhao, 2011, ZTEM and VTEM airborne EM survey results over PGM‐Cu‐Ni targets at East Bull Lake anorthositic complex, Massey, Ontario: SEG Expanded Abstracts, 30, 629-634.
Lo, B., J. M. Legault, P. Kuzmin, and M. Combrinck, 2009, Z-TEM (Airborne AFMAG) tests over unconformity uranium deposits: 20TH International Geophysical Conference & Exhibition, ASEG, Extended Abstract, 5 p.
Lo, B., and M. Zang, 2008. Numerical modeling of Z-TEM (airborne AFMAG) responses to guide exploration strategies: SEG Expanded Abstracts, 27, 1098-1101.
Pedersen, L.B., 1998, Tensor VLF measurements: Our first experiences: Exploration Geophysics, 29, 52-57.
Sattel, D., K. Witherly, and M. Becken, 2010, A brief analysis of ZTEM data from the Forrestania test site, WA: 21ST International Geophysical Conference & Exhibition, ASEG, Extended Abstracts, 5 p.
Tarantola, A., 1987, Inverse Problem Theory: Elsevier, New York, 613 p.
Wannamaker, P. E., J. A. Stodt, and L. Rijo, 1987, A stable finite element solution for two dimensional magnetotelluric modeling: Geophysical Journal of Royal Astronomical Society, 88, 277-296.
Ward, S. H., 1959, AFMAG – Airborne and Ground: Geophysics, 24, 761-787.
Witherly, K., R. Irvine, 2006, The VTEM airborne electromagnetic system – benchmarking continuous improvement via repeat surveys over time: SEG Expanded Abstracts, 25, 1273-1277.
Witherly, K., R. Irvine, and E. B. Morrison, 2004, The Geotech VTEM time domain helicopter EM system: SEG Expanded Abstracts, 23, 1217-1221.