Presented at 11th SAGA Biennial Technical Meeting and Exhbibition.
For a pdf of this paper click here
Abstract
A series of demonstration tests were conducted using the Z-TEM™, airborne AFMAG system over deep targets in the Athabasca Basin of Saskatchewan, Canada. These tests were conducted in mid-2008 and were flown to test Z-TEM™’s ability to detect large conductive targets at depth; deeper than conventional airborne EM methods. Data are presented over areas where the conductors are located 450-600 metres beneath the surface. As well, a case of Z-TEM™ following the plunge of a conductor to over 800 metres depth is shown..
Key words: Z-TEM™, AFMAG, electromagnetic, airborne, uranium, Athabasca
Introduction
The Z-TEM™ system is the latest implementation of an airborne AFMAG system first commercialized in late 2006. Z-TEM™ uses a large, 8 metre diameter airborne air core coil, slung from a helicopter, to measure the vertical component of the AFMAG signal. Two 4 metre square coils are deployed on the ground to measure the horizontal field. The Z-TEM™ system has flown successful demonstration surveys over porphyry copper deposits in the southwest USA (Zang et al., 2008).
Z-TEM™ was tested in the Athabasca Basin in Canada in May of 2008 to determine its depth of investigation and to determine its suitability for mapping deep conductors in the crystalline basement. Over 30% of the world’s U3O8 is mined in the Athabasca Basin from unconformity uranium deposits. Unconformity uranium deposits of the Athabasca Basin are often associated with conductors located in the crystalline basement.
The search for economic uranium deposits is moving to areas of the basin which are deeper and beyond the detection limits of modern airborne instrumentation. This creates the requirement for a system which can detect conductivity past the detection limits of modern traditional EM systems. This was the motivation behind the field trials of the Z-TEM™ system in the Athabasca Basin. Several areas where known deep conductors (450-600m+) were located were flown. Also, a test survey block in the northern part of the basin was able to trace a deep and plunging conductor to depths that no other airborne EM system has been able to achieve.
Athabasca Basin Geology
The high-grade uranium deposits within the Athabasca Basin are associated with the unconformity between the essentially flat-lying Proterozoic Athabasca Group sandstones and the underlying Archean-Paleoproterozoic metamorphic and igneous basement rocks. The deposits occupy a range of positions from wholly basement-hosted to wholly sediment-hosted, at structurally favourable sites in the interface between the deeply weathered basement and overlying sediments of the Athabasca Basin (Ruzicka, 1997). The locations of these deposits are lithologically and structurally controlled by the sub-Athabasca unconformity and basement faults and fracture zones, which are localized in graphitic pelitic gneisses that may flank structurally competent Archean granitoid domes (Quirt, 1989).
In general, most of the known important deposits tend to occur within a few tens to a few hundred metres of the unconformity and within 500 m of the current ground surface. This may be more of a limitation of exploration techniques. There is no reason to believe that the distribution of the deposits is dependent on the modern day depth of burial.
Empirically, the geophysical exploration for unconformity type uranium targets have been to search for large basement structures which post date the sandstone deposition of the basement (Matthews et. al, 1997). All the deposits located so far are associated with fault structures associated with a graphitic conductive basement. An alteration zone of clay silicification and enrichment around the deposits probably leads to magnetite destruction causing the magnetic low observed around the deposits. The clay alteration should give rise to a resistivity low signature about the deposits. The low conductivity of the clay alteration makes it a difficult target for airborne EM if it is buried at significant depth.
Z-TEM™ INSTRUMENTATION AND PRESENTATION
Z-TEM™ is an airborne AFMAG system introduced by Geotech Ltd. of Canada in early 2007 (Lo et al., 2008). In a Z-TEM survey, a single vertical dipole air-core coil is flown over the survey area in a grid pattern similar to other airborne electromagnetic surveys. Two orthogonal, air-core, horizontal axis coils placed close to the survey site measures the horizontal EM fields for reference. A GPS array on the airborne coil monitors its attitude for post-flight corrections.
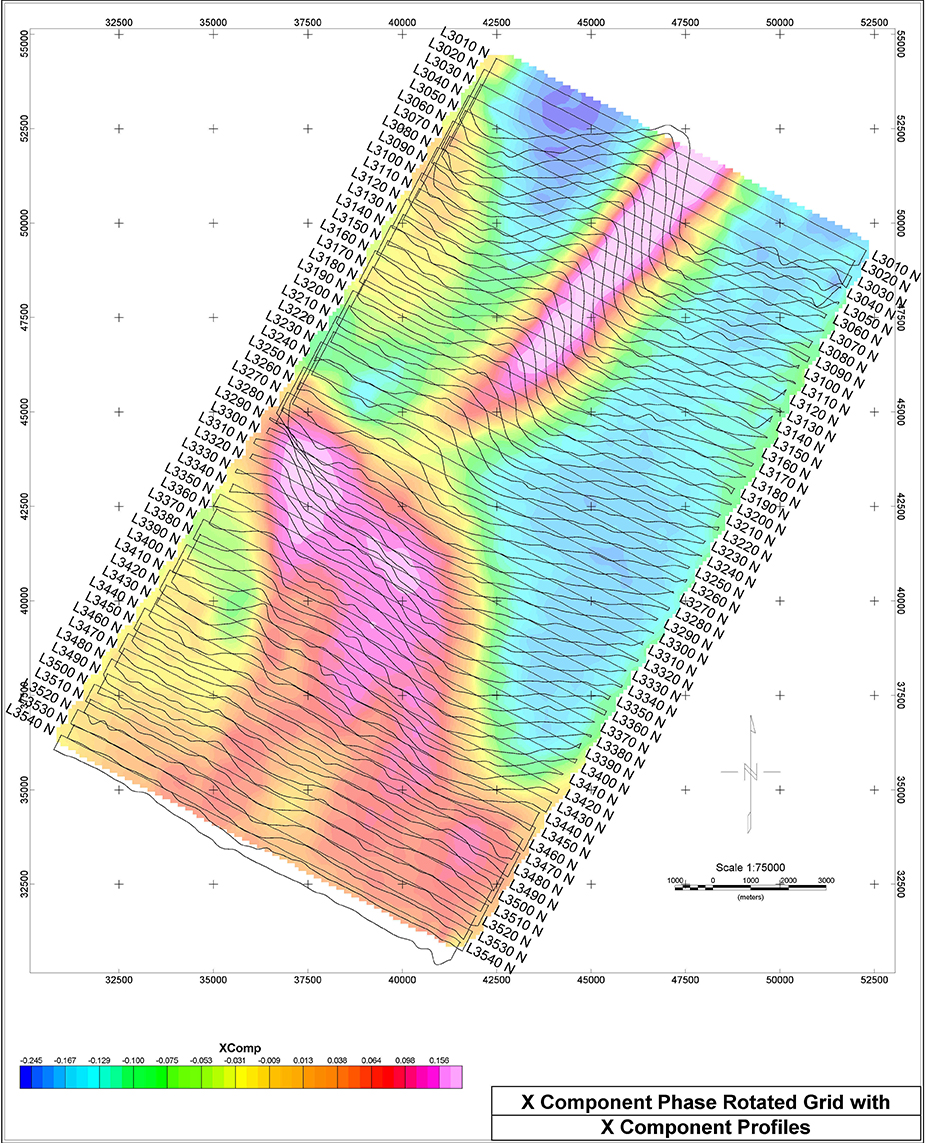
Figure 1: Stacked profiles of the x-component Tipper over the gridded values of the phase rotated x-component data. Note that the cross-overs in the profiles are now peaks on the image.
As the source field is assumed to be far away, the excitation of the ground is more or less uniform. For large structures, the signal fall-off will be much slower than from a dipole source, such as those energised by traditional airborne systems. With the Z-TEM™ system being less susceptible to terrain clearance, the planned ground clearance height is higher and the terrain drape is looser as compared to standard helicopter EM surveys.
The two Tippers obtained from the relationship between the vertical airborne coil and the two ground coils have a cross-over over a steeply dipping, plate-like body. The cross-overs can be made into local maxima via a 90 degree phase rotation which allows for easier interpretation of the gridded values. Figure 1 is an example of this transformation.
To present the data of both Tippers as one image, we calculate a parameter termed the DT which is the horizontal divergence of the two Tippers, much in the same manner as the “peaker” parameter in VLF (Pedersen, 1998). The DT is typically plotted with an inverted colour bar as it is negative over a steeply dipping thin body.
ZTEM™ RESULTS – NORTHERN ATHABASCA BASIN
Figure 2 shows gridded values from a number of Z-TEM™ lines over an area where the sedimentary cover is approximately 450-600 metres thick. A number of traditional EM systems have also been flown over this block. While they were able to detect conductors, the resolution of the conductive features is not nearly as detailed as the information provided by Z-TEM™.
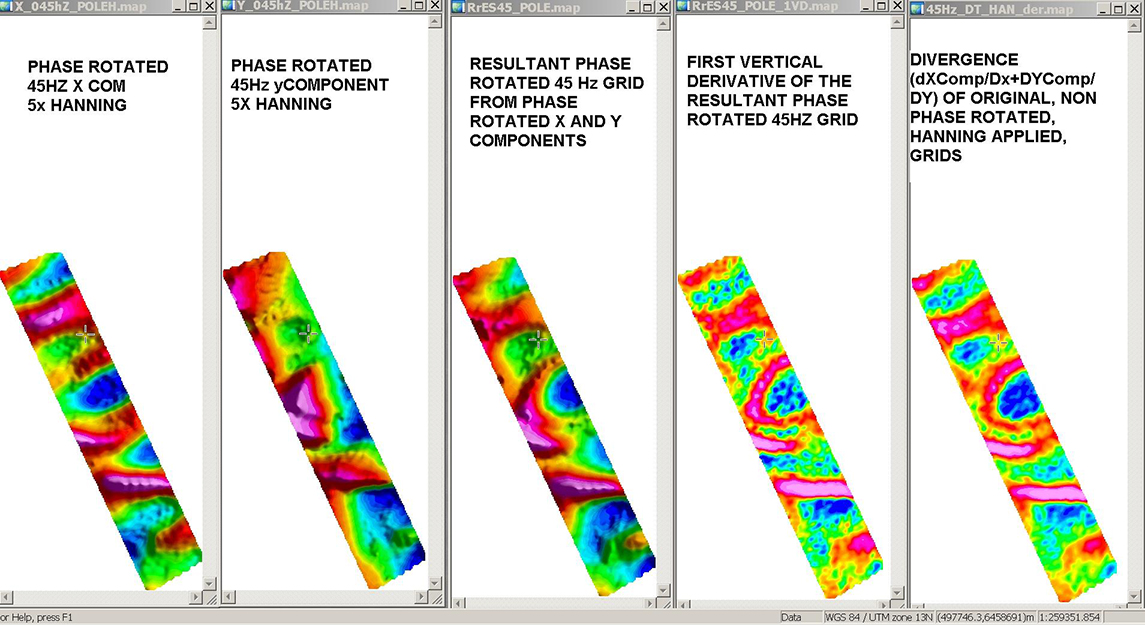
Figure 2: Z-TEM™ results over an area of 450-600 metre thick sedimentary cover.
Figure 3, from another area, shows the data from one of the larger blocks that was flown. It is a 3D composite image of the DT at various frequencies plotted at the equivalent skin depth assuming a 1,000 ohm-m average resistivity.
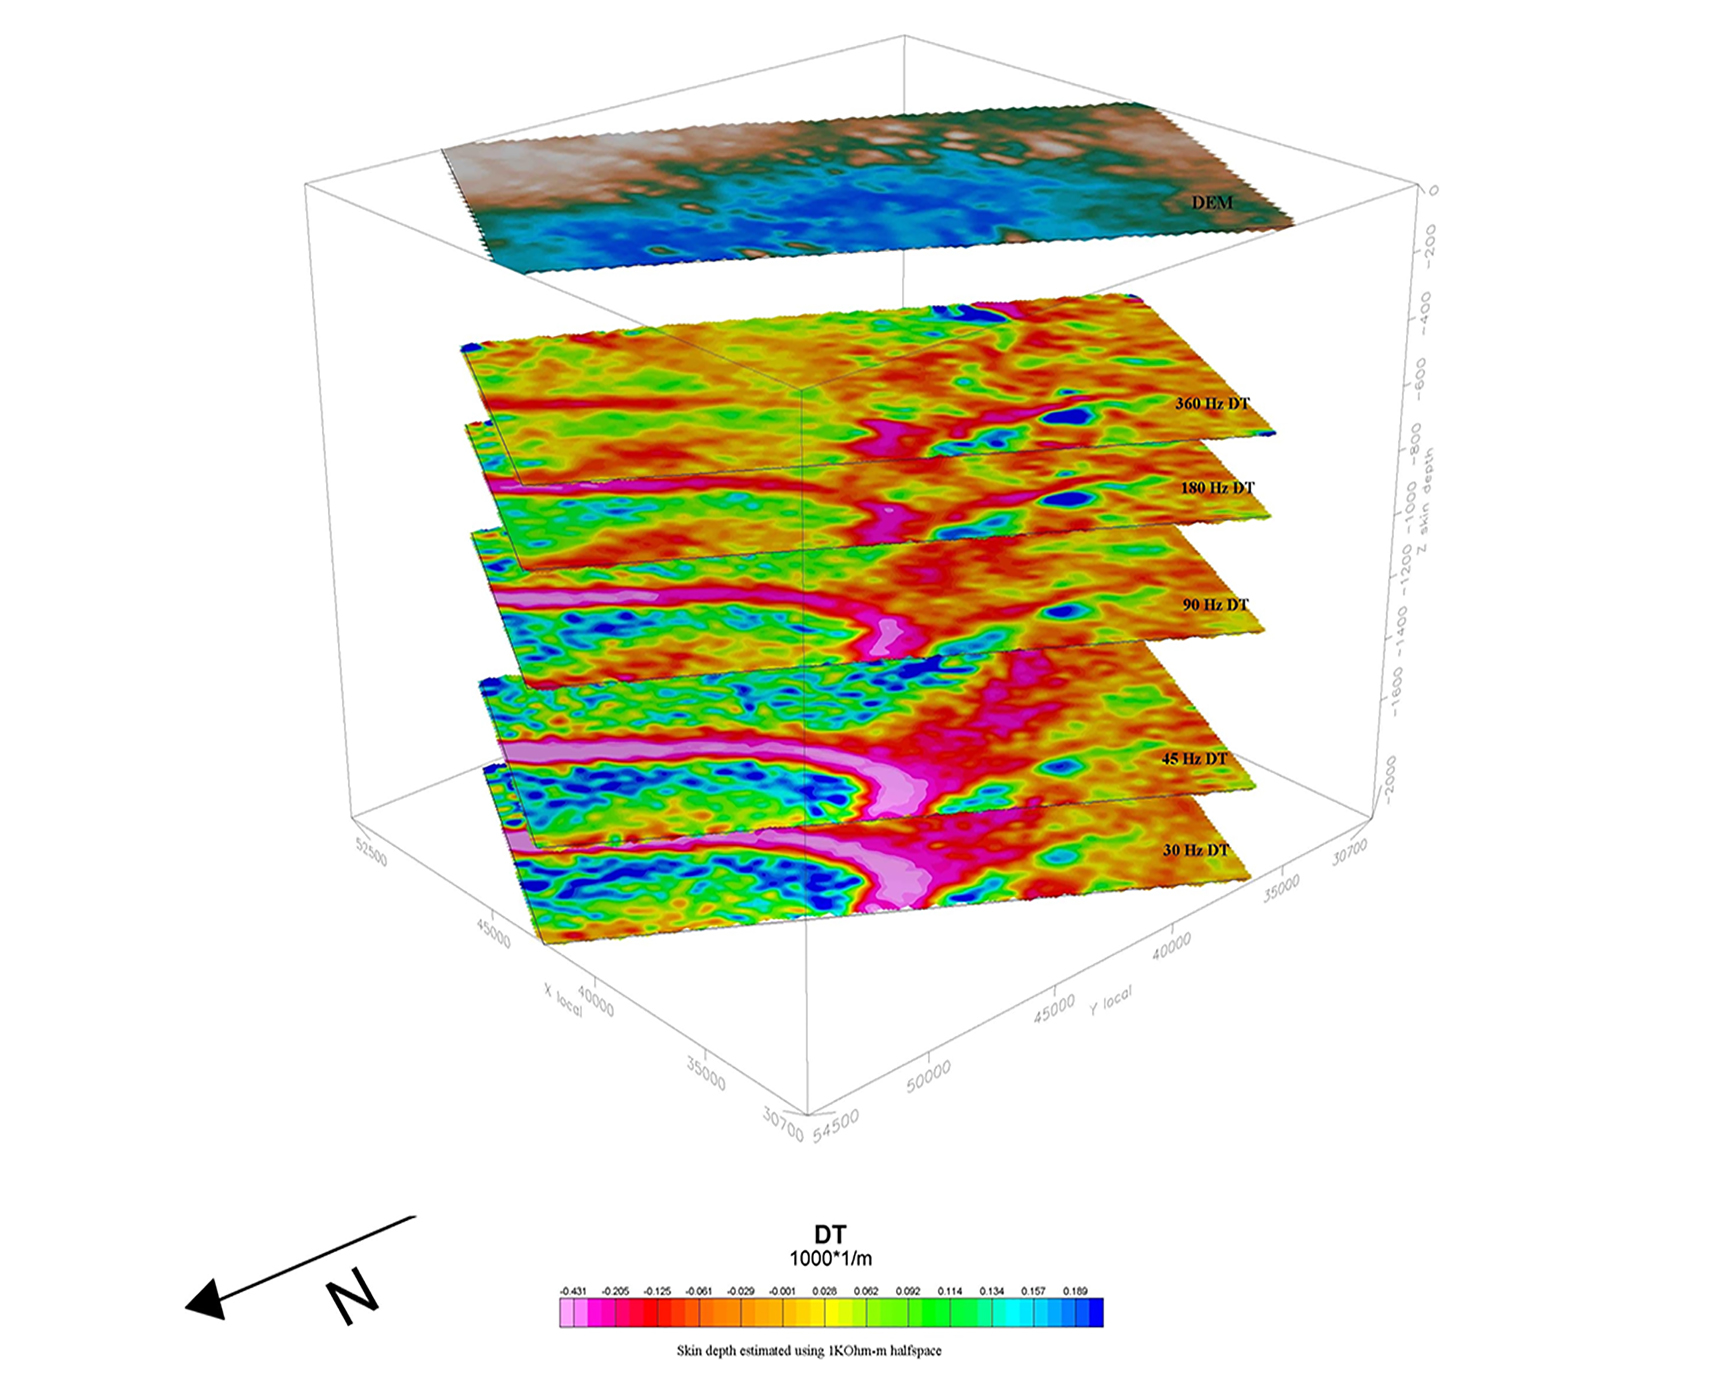
Figure 3: Perspective view of DT’s of different frequencies plotted at the skin depth (using a 1,000 ohm-m Earth.)
The data in Figure 3 come from a survey over the north rim of the Athabasca Basin. The sandstone cover is about 500m on the left hand side of the image, and progressively getting deeper to the right. It is about 700m in the middle part of the image and over 800 metres thick on the right middle portion where exploration drilling is concentrated. Starting in the middle left and trending to the right of the image, there is a known graphitic shear.
In the uppermost (600m) “depth slice”, Figure 3 shows a linear conductive feature that progressively weakens as one moves to the right until it is no longer seen. This is interpreted to be due to the graphitic shear conductor plunging deeper past the depth of investigation of the 360 Hz data. The lower frequencies penetrate more into the sedimentary cover that is deeper towards the right. DT’s of decreasing frequency show the linear conductive feature extending more and more to the right. The feature also strengthens/sharpens into a synformal shape with lower frequencies. This fits with what the known geology of a plunging conductor at depth is doing.
At the nose of the fold, in the right third of the images, we also see another, broader anomalous zone that trends towards the back of the image. At this location, two radioactive springs are situated. These spring waters which are anomalously high in uranium and radon may reflect the upward migration of deep waters along faults, suggesting structural targets in areas where basinal waters may have tapped a radioactive source. This broad DT trend might be the plunge of the fold axis that is aligned away from the front of the image. An anomaly along this trend, at the highest frequency, that steadily grows with each decreasing frequency can be seen. This might represent an alteration zone in the sandstone that is detected at the shallowest depth. By about the 90Hz DT depth slice or so, we are possibly in the deeper basement and into a basement graphitic unit.
Conclusions
A number of successful Z-TEM™ tests were conducted over the Athabasca Basin. The tests demonstrated that Z-TEM™ can easily detect conductivity to 800 metres beneath relatively resistive sedimentary cover. Assuming a 1,000 ohm-metre resistivity, the skin depth of the 30 Hz data is approximately 2,000 metres. The 30 Hz data presented have good signal to noise ratios indicating a deep depth of exploration. The observation that Z-TEM™ may be detecting the clay alteration above the crystalline basement is a significant advantage for exploration of unconformity uranium deposits.
More demonstration surveys are planned in the Athabasca Basin later this year. And more target types for testing are also planned.
Acknowledgements
The authors thank Geotech Ltd. for allowing them to publish this work and for providing the support required to write this abstract and to present this paper.
References
Labson, V. F., Becker A., Morrison, H. F., and Conti, U., 1985, Geophysical exploration with audiofrequency natural magnetic fields, Geophysics, Vol. 50, pp. 656-664.
Lo, B., Zang, M., Kuzmin, P., 2008, Geotech’s Z-TEM (Airborne AFMAG) Instrumentation, a paper presented at KEGS PDAC 2008 Symposium, Toronto.
Matthews, R., Koch, R. and Leppin, M., 1997, Advances in Integrated Exploration for Unconformity Uranium Deposits in Western Canada; in Proceeding of Exploration 97, edited by Arnis Gubins, Prospectors and Developers Association of Canada, Toronto.
McMullan, S.R., Matthews, R.B, and Robertshaw, P., 1990, Exploration geophysics for Athabasca Uranium Deposits, in: Proceedings of Exploration 87, Ontario Geological Survey.
Pedersen, L.B, Qian, W., Dynesius, L., Zhang, P., 1994, An airborne tensor VLF system. From concept to realization, Geophysical Prospecting, Vol. 42.
Ruzicka, V.R., 1997, Metallogenic features of the uranium-polymetallic mineralization of the Athabasca Basin, Alberta, and a comparison with other parts of the basin; in R.W. Macqueen, ed., Geological Survey of Canada, Bulletin 500, 31-79.
Wheatley, K., Murphy, J., Leppin, M., and Climie, J.A., 1996, Advances in the Genetic Model and Exploration Techniques for Unconformity-type Uranium Deposits in the Athabasca Basin; in Ashton, K.E., Harper, C.T., eds., MinExpo ’96 Symposium – Advances in Saskatchewan Geology and Mineral Exploration: Saskatchewan Geological Society, Special Publication No 14, p. 126-136.
Quirt, D., 1989, Host rock alteration at Eagle Point South: Sask. Research Council, Publication no. R-855-1-E- 89, 95p.
Ward, S. H., 1959, AFMAG – Airborne and Ground: Geophysics, Vol. 24, pp. 761-787.
Zang, M., Lo, B., 2008, The Application of Airborne Natural Field Electromagnetics (Z-TEM): Some Examples from the Southwestern United States, a paper presented at the 2008 PDAC, Toronto.