For a PDF of this paper click here.
PRESENTED AT SEG 2018
SUMMARY
In this paper, we propose a new exploration strategy for detecting pipe-like structures from airborne TDEM data. We first apply the Keating’s pattern recognition technique to the EM resistive limit calculated from the early and mid-time decay channels and to the magnetic analytic signal for predicting conductive and magnetic pipes. The automated detection procedure yielded numerous solutions, whose number is downsized after a careful screening and fine-tuning of the obtained results. Further, the selected targets are classified into several categories according to their EM, magnetic and IP signatures. Finally, we perform 3D MVI and 1D EM inversion on selected targets to determine the size, the depth and the magnetic and electrical properties of these targets.
INTRODUCTION
Airborne magnetic and electromagnetic surveys have been extensively used for kimberlite exploration. Most kimberlites occur in stable Archaean cratons in swarms. They have distinctive magnetic and electromagnetic signatures, which are in general roughly circular anomalies with various diameters in surface and with carrot-shaped extension at depth (Smith and Klein, 1996). Kimberlites’ magnetic susceptibility is variable and it usually high. However, many known kimberlites in Africa do not have a clear magnetic signature, yet they exhibit electromagnetic response due to contrasts in resistivity with host rocks (Macnae, 1979). In many cases, the near-surface weathered kimberlite portion and overlying volcano-sediments exhibit higher conductivity contrast with the host rocks that can be detected by airborne electromagnetic systems (Cunion, 2009). In Angola, many large kimberlite pipes including the Catoca’s large pipe have a clear electromagnetic signature and no magnetic signature (Le Roux and Steenkamp, 2014). Therefore, AEM techniques have proven as cost-effective for the exploration of kimberlite pipes in Africa.
In this paper, we propose a new kimberlite exploration strategy and we show results from its application to EM and magnetic data collected with a helicopter-borne electromagnetic survey that was recently carried out in the Cuango area, Angola. First, we apply the Keating’s pattern recognition technique (Keating, 1995) to both magnetic analytic signal and EM resistive limit data for automatic detection of magnetic and conductive pipe-like structures, and then we perform a 3D magnetization vector inversion (MVI), (Elis et al., 2012) and 1D EM inversion (Brodie, 2015) for selected targets for their better definition.
PREDICTION METHOD
We apply an automated pattern recognition process based on the Keating’s method to the analytic signal data to predict magnetic pipe-like structures. To implement the prediction process we use a series of reference models composed of homogeneous magnetic vertical cylinders of various diameters ranging from 100m to 500m. The model responses are then compared to the survey data using a linear regression analysis. This analysis provides clustered solutions for predicted pipes with associated correlation coefficients (Keating and Sailhac, 2004). Well-defined clustered solutions with associated high correlation coefficients (>80%) are typically retained whilst sparse and poorly clustered solutions are normally rejected.
Unlike the magnetic data, which are presented as a single channel data, the TDEM data are collected in multiple channels. To implement the prediction analysis, we first convert the multichannel EM data to the Resistive Limit (RL), and then we cross correlate the observed data with the reference model response using the Keating’s pattern recognition technique.
The RL is defined as a state when eddy currents have fully penetrated the conductive body and the rate of change of the induced secondary fields is negligible. The RL concept has been extensively used for 2D and 3D modeling of frequency and time-domain EM data (Stoltz and Macnae, 1997; Schaa and Fullagar, 2012). In time domain, the RL for a step function of the primary field is defined as the time-integral of the magnetic flux density using the concept of 1st order magnetic moments (Smith and Lee, 2002) given by the following equation (1),
![]() (1)
(1)
where M(1) is the 1st order magnetic moment and B, the magnetic flux density.
The multichannel EM data are first converted to the RL according to equation (1). Next, a more complex kimberlite conceptual model is used for the prediction analysis. It is composed of a surface conductive and weathered crater zone, located on top of a resistive and unweathered diatreme zone. The kimberlite pipe is hosted by resistive rock featuring the Precambrian basement. A moderately conductive thin overburden layer overlies the whole model. This model features most of the conductive kimberlite pipes known in Angola.
The forward calculations are performed with the 3D CSIRO Samair Code (Raiche et al., 2007) using various model diameters of the kimberlite pipes ranging from 100 m to 500 m. An amount of chargeability is included in the crater infill sediments to account for IP effect in the EM data.
Figure 1 displays the forward modeling results and the calculated resistive limit for a 300m-diameter kimberlite model. Only the first twenty decay channels (Figure 1b) are used to calculate the RL (Figure 1c) to avoid the inclusion of negative decays associated with the IP effect. The RL grid (Figure 1d) depicts a well-focused circular response above the kimberlite pipe model alike the magnetic analytic signal.
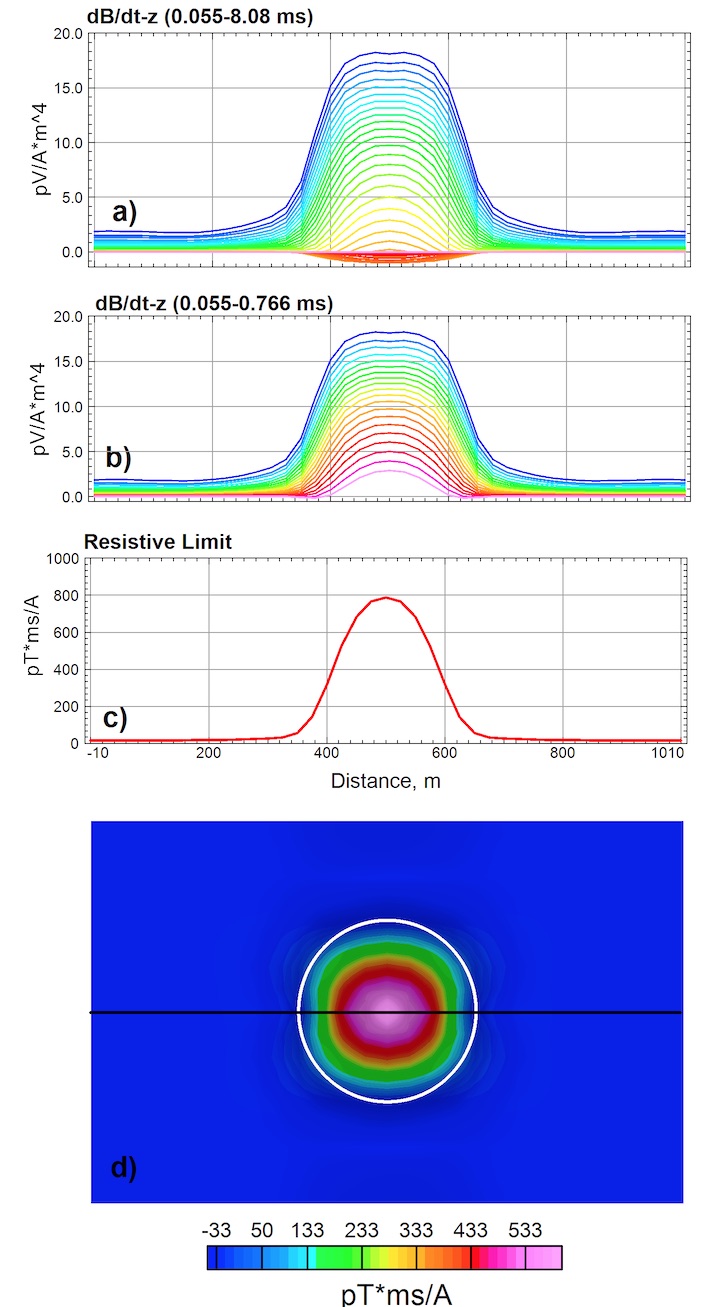
Figure 1: Calculated EM decays for a 300m-wide kimberlite pipe; a) All decay channels (0.055- 8.08 ms), b) First twenty decay channels (0.055-0.766 ms), c) Resistive limit profile, and d) Resistive limit grid image with the pipe model outline (white circle). The black line represents the trace of the central line.
APPLICATION AND RESULTS
We apply the prediction analysis to the helicopter-borne TDEM data from a survey carried out over the Cuango area, located in northeastern Angola (Figure 2).
AEM survey
The aim of the survey was to detect magnetic kimberlite pipes with the gradiometer system and to map local conductive zones with the EM system that may be associated with conductive crater infill volcano-sediments and conductive weathered kimberlite zones. The high-resolution survey combined EM and magnetic horizontal gradient measurements and covered an area of approximately 2,000 square kilometres. The traverse lines were flown in the north-south direction and were spaced at 150 m apart. The tie lines were flown in the east-west direction and were spaced at 1,500 m apart. The helicopter was flying at a mean speed of 80 km/h and at an average altitude of 75 m above ground. The average ground clearance of the helicopter-borne EM transmitter-receiver system was 40 m and the magnetic gradiometry system was located at 50 m above ground, in average.
Geology of the survey area
The study area lies within the Congo-Kasai Craton. It is located in the northeast of Angola within the Lucapa structure, a NE trending rift system formed following the Gondwana break-up during the Jurassic (Figure 2).
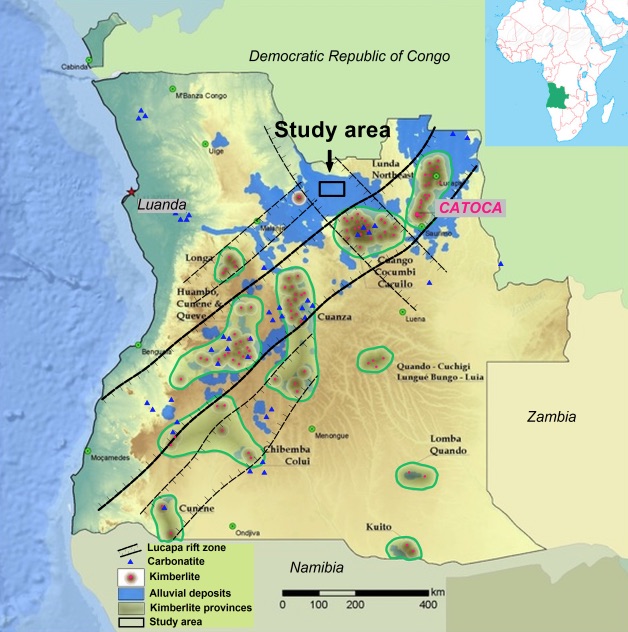
Figure 2: Kimberlite provinces of Angola and associated Lucapa rift zone. The study area is located in north-eastern Angola (modified after Pereira et al., 2003 and Egorov et al., 2007).
The rift zone, which has facilitated the emplacement of alkaline, carbonatitic and kimberlitic magmas (Pereira et al., 2003), is known to host most of the diamondiferous kimberlites in Angola (Jelsma et al., 2009).
Locally, the survey area lies within the Cuango diamondiferous province. Diamonds are extracted from recent alluvial deposits and the Cretaceous sediments of the Calonda Formation that unconformably overlie the Precambrian basement rocks.
Magnetic pipes prediction results
Figure 3 shows the predicted magnetic pipe-like structures superimposed on the analytic signal image for the eastern portion of the survey area. The white dots represent the centres of the predicted pipe-like features using various model diameters. Only solutions corresponding to correlation coefficients > 80 %, normalized relative errors < 13 % and amplitudes > 3 nT/m are retained and the rest of solutions are rejected.
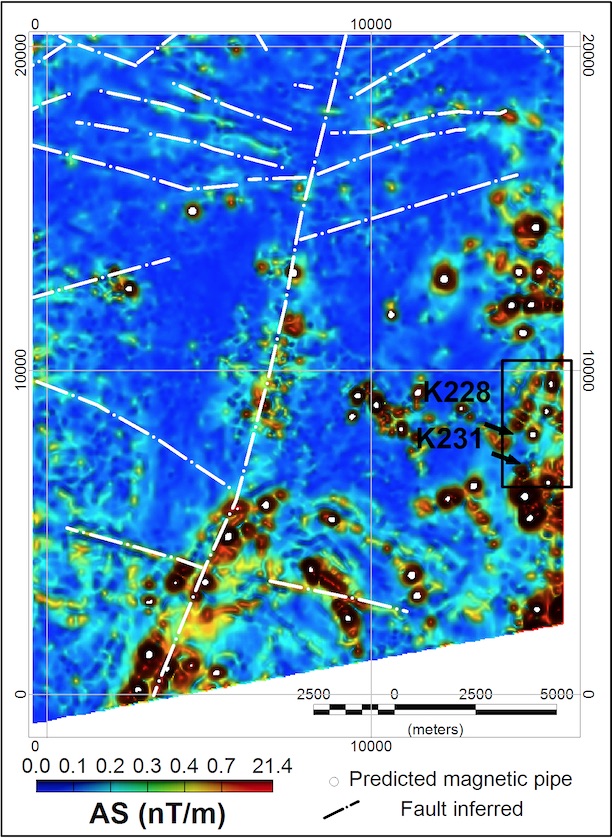
Figure 3: Predicted pipe-like magnetic structures (white dots) over the colour shaded relief of the analytic signal image
Numerous solutions are obtained and most of them appear to be aligned along linear and curvilinear features. It is unlikely that all these solutions represent potential targets; however, many identified isolated anomalies appear to represent good candidates for kimberlite pipe exploration. These targets are occurring in the easternmost edge of this area in association with local conductive EM anomalies as shown in the next section. It is worth mentioning, that a number of magnetic kimberlite pipes are known outside of the survey area, near to its eastern boundary. Therefore, these magnetic targets may belong to known kimberlite clusters of the nearby Cuango-Cucumbi province.
Conductive pipes prediction results
Figure 4 shows the predicted conductive pipes represented by white dots. The retained solutions correspond to correlation coefficients > 75 % and to RL amplitudes > 50 pT·ms/A; however, only targets that are represented by well-defined clustered solutions have a high confidence and are therefore retained for follow-up. Solutions that are represented by sparse and poorly clustered solutions are rejected from further analysis. There are 04 well-defined clusters occurring in the southeastern edge of this target area that deserve further analysis. These are outlined by the black rectangle.
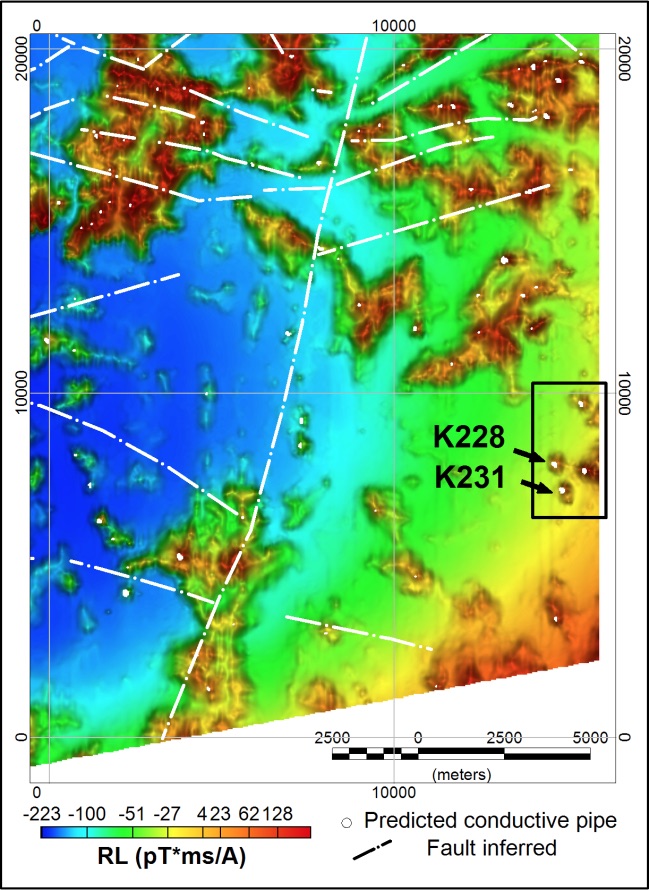
Figure 4: Predicted conductive structures (white dots) over the colour shaded relief of the Resistive Limit image.
Targeting results
Given the large number of obtained solutions, further screening and classification are required before target selection and prioritization. Only solutions associated with high correlation coefficients and forming well-defined clusters are considered for further screening. Next, the targets are classified into 04 categories depending on their magnetic, EM and IP signatures. Some targets have clear and well-defined magnetic and EM signatures and others have either EM or magnetic signature. Additionally, for some targets, IP effect is observed in the EM decays. This IP effect, which in general, is indicated by the presence of negative late time decays, represents an important criterion for kimberlite exploration, since it may be linked to chargeable lake sediments (clays) that may occur within the crater zone of the kimberlite pipe.
Two targets, namely K231 and K228 are selected for a further study and are presented here.
- Target K231
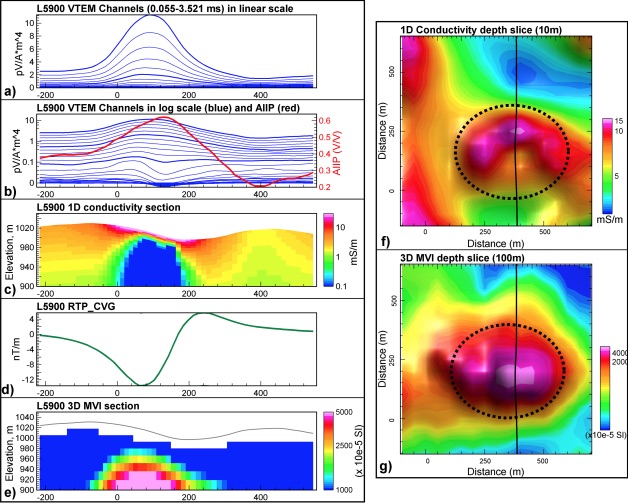
Figure 5: EM and magnetic inversion results for the target K231 of Figure 4; a) EM decays (linear scale), b) EM decays in log scale (blue) and AIIP curve (red), c) 1D inversion results, d) CVG profile, e) 3D MVI results, f) conductivity depth slice (10 m), and g) 3D MVI depth slice (100 m). The dashed line is the suggested kimberlite outline and the bold line is the section trace.
Figure 5 presents the EM and magnetic responses and their inversion results for this target. The latter belongs to the 1st category (circular magnetic anomaly, occurring in coincidence with EM anomaly and includes IP effect). The IP effect is clearly indicated by the presence of negative late time decays and a clear AIIP anomaly (Kwan et al., 2015), (Figure 5b). The 1D EM inversion results (Figure 5c) indicates the presence of a resistive feature attributed more likely to unweathered kimberlite pipe. The thin conductive layer occurring on top of the resistive feature may be associated with chargeable and conductive sediments (clay) and/or with weathered kimberlite. The resistive feature occurring in coincidence with a magnetic structure is supporting its kimberlite nature. The topographical relief low may represent a small crater. On the plan map, the suggested kimberlite structure is roughly oval-shaped with estimated dimensions of 400 m × 500 m as shown in Figures 5f and 5g.
- Target K228
Target K228 belongs to the 4th category and is associated with a moderately strong early and mid-time EM response with IP effect and with no magnetic association. The resistivity depth imaging (RDI) section shown in Figure 6e indicates the presence of a shallow seated conductive feature similar to those observed over non-magnetic kimberlite pipes occurring in other areas. The conductive feature, of approximately 50 m in thickness, is potentially associated with a conductive weathered zone and/or chargeable sediments that typically occur on top of kimberlite structures.
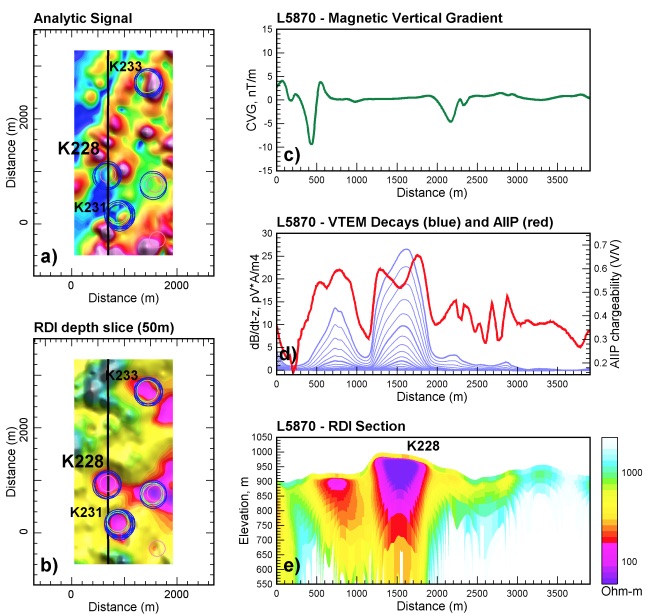
Figure 6: EM and magnetic responses for the target area of Figure 4; a) Analytic signal, b) RDI depth slice at 50m, c) CVG profile, d) VTEM decays and AIIP, and e) RDI section. The coloured circles in a) and b) correspond to predicted solutions calculated from the EM Resistive Limit (using various model diameters) and the bold line represents the section trace across the target K228.
CONCLUSIONS
The proposed new exploration approach applied to both magnetic data (Analytic Signal) and EM data (Resistive Limit) helped predict numerous potential pipe-like structures within the Cuango area. Further analysis of selected targets using 1D EM and 3D MVI inversions helped better define these structures and determine their shape and size. These results confirmed their link to pipe-like structures consistent with kimberlite pipes.
ACKNOWLEDGEMENTS
We are grateful to KIMANG Ltda of Angola for permission to publish these results.
REFERENCES
Brodie, R.C., 2015, GALEISBSTDEM: A deterministic algorithm for 1D sample by sample inversion of time-domain AEM data–theoretical details: Geoscience Australia.
Cunion, E., 2009, Comparison of ground TEM and VTEM responses over kimberlites in the Kalahari of Botswana, Exploration Geophysics, 40, 308–319, https://doi.org/10.1071/eg09019.
Egorov, K.N., E.F. Roman’ko, V.T. Podvysotsky, S.M. Sablukov, V.K. Garanin, and D.B. D’yakonov, 2007, New data on kimberlite magmatism in southwestern Angola: Russian Geology and Geophysics, 48, 323–336, https://doi.org/10.1016/j.rgg.2006.08.001.
Ellis, R. G., B. de Wet, and I. N. Macleod, 2012, Inversion of magnetic data from remanent and induced sources. ASEG Extended Abstracts 2012: 22nd Geophysical Conference, 1–4, https://doi.org/10.1071/aseg2012ab117.
Jelsma, H., W. Barnett, S. Richards, and G. Lister, 2009, Tectonic setting of kimberlites: Lithos, 112, 155–165, https://doi.org/10.1016/j.lithos.2009.06.030.
Keating, P., 1995, A simple technique to identify magnetic anomalies due to kimberlite pipes: Exploration and Mining Geology, 4, 121–125.
Keating, P., and P. Sailhac, 2004, Use of the analytic signal to identify magnetic anomalies due to kimberlite pipe: Geophysics, 69, 180–190, https://doi.org/10.1190/1.1649386.
Kwan, K., A. Prikhodko, J. Legault, and E. Goncharov, 2015, Airborne inductively induced polarization effects in and their removal from the VTEM data from Mirny, Russia: 85th Annual International Meeting, SEG, Expanded Abstracts, 2032–2036, https://doi.org/10.1190/segam2015-5845297.1.
Le Roux, C. L., and W. H. B. Steenkamp, 2014, Geophysical characteristics of a few Angolan Kimberlite examples: Proceedings of the GSSA Kimberley Diamond Symposium.
Macnae, J. C., 1979, Kimberlites and exploration geophysics: Geophysics, 44, 1395–1416, https://doi.org/10.1190/1.1441014.
Pereira, E., J. Rodrigues, and B. Reis, 2003, Synopsis of Lunda geology, NE Angola: Implications for diamond exploration: Comunicações do Instituto Geológico e Mineiro, 90, 189–212.
Raiche, A., F. Sugeng, and G. Wilson, 2007, Practical 3D EM inversion? The P223F software suite. ASEG Extended Abstracts 2007,1–5, https://doi.org/10.1071/aseg2007ab114.
Schaa, R., and P. K. Fullagar, 2012, Vertical and horizontal resistive limit formulas for a rectangular-loop source on a conductive half-space: Geophysics, 77, no. 1, E91–E99, https://doi.org/10.1190/geo2011-0141.1.
Slater, L. D., and D. Lesmes, 2002, IP interpretation in environmental investigations: Geophysics, 67, 77 –88, https://doi.org/10.1190/1.1451353.
Smith, R. S., A. P. Annan, J. Lemieux, and R. N. Pedersen, 1996, Application of a modified GEOTEMT® system to reconnaissance exploration for kimberlites in the Point Lake area, NWT, Canada: Geophysics, 61, 82 –92, https://doi.org/10.1190/1.1443959.
Smith, R. S., and T. J. Lee, 2002, The moments of the impulse response: A new paradigm for the interpretation of transient electromagnetic data: Geophysics, 67, 1095–1103, https://doi.org/10.1190/1.1500370.
Stoltz, E. M., and J. C. Macnae, 1997, Fast approximate inversion of TEM data: Exploration Geophysics, 28, 317–322, https://doi.org/10.1071/eg997317..